

Note: All market prices and on-chain figures in this article are as of August 13, 2026. Both move continuously, so the numbers below will have shifted by the time you read them.
1. Bitcoin's implied median sits near $75,000
The 2026 Bitcoin ladder carries $52.2M in volume, making it the deepest crypto book available and the closest thing to a consensus distribution the market produces.
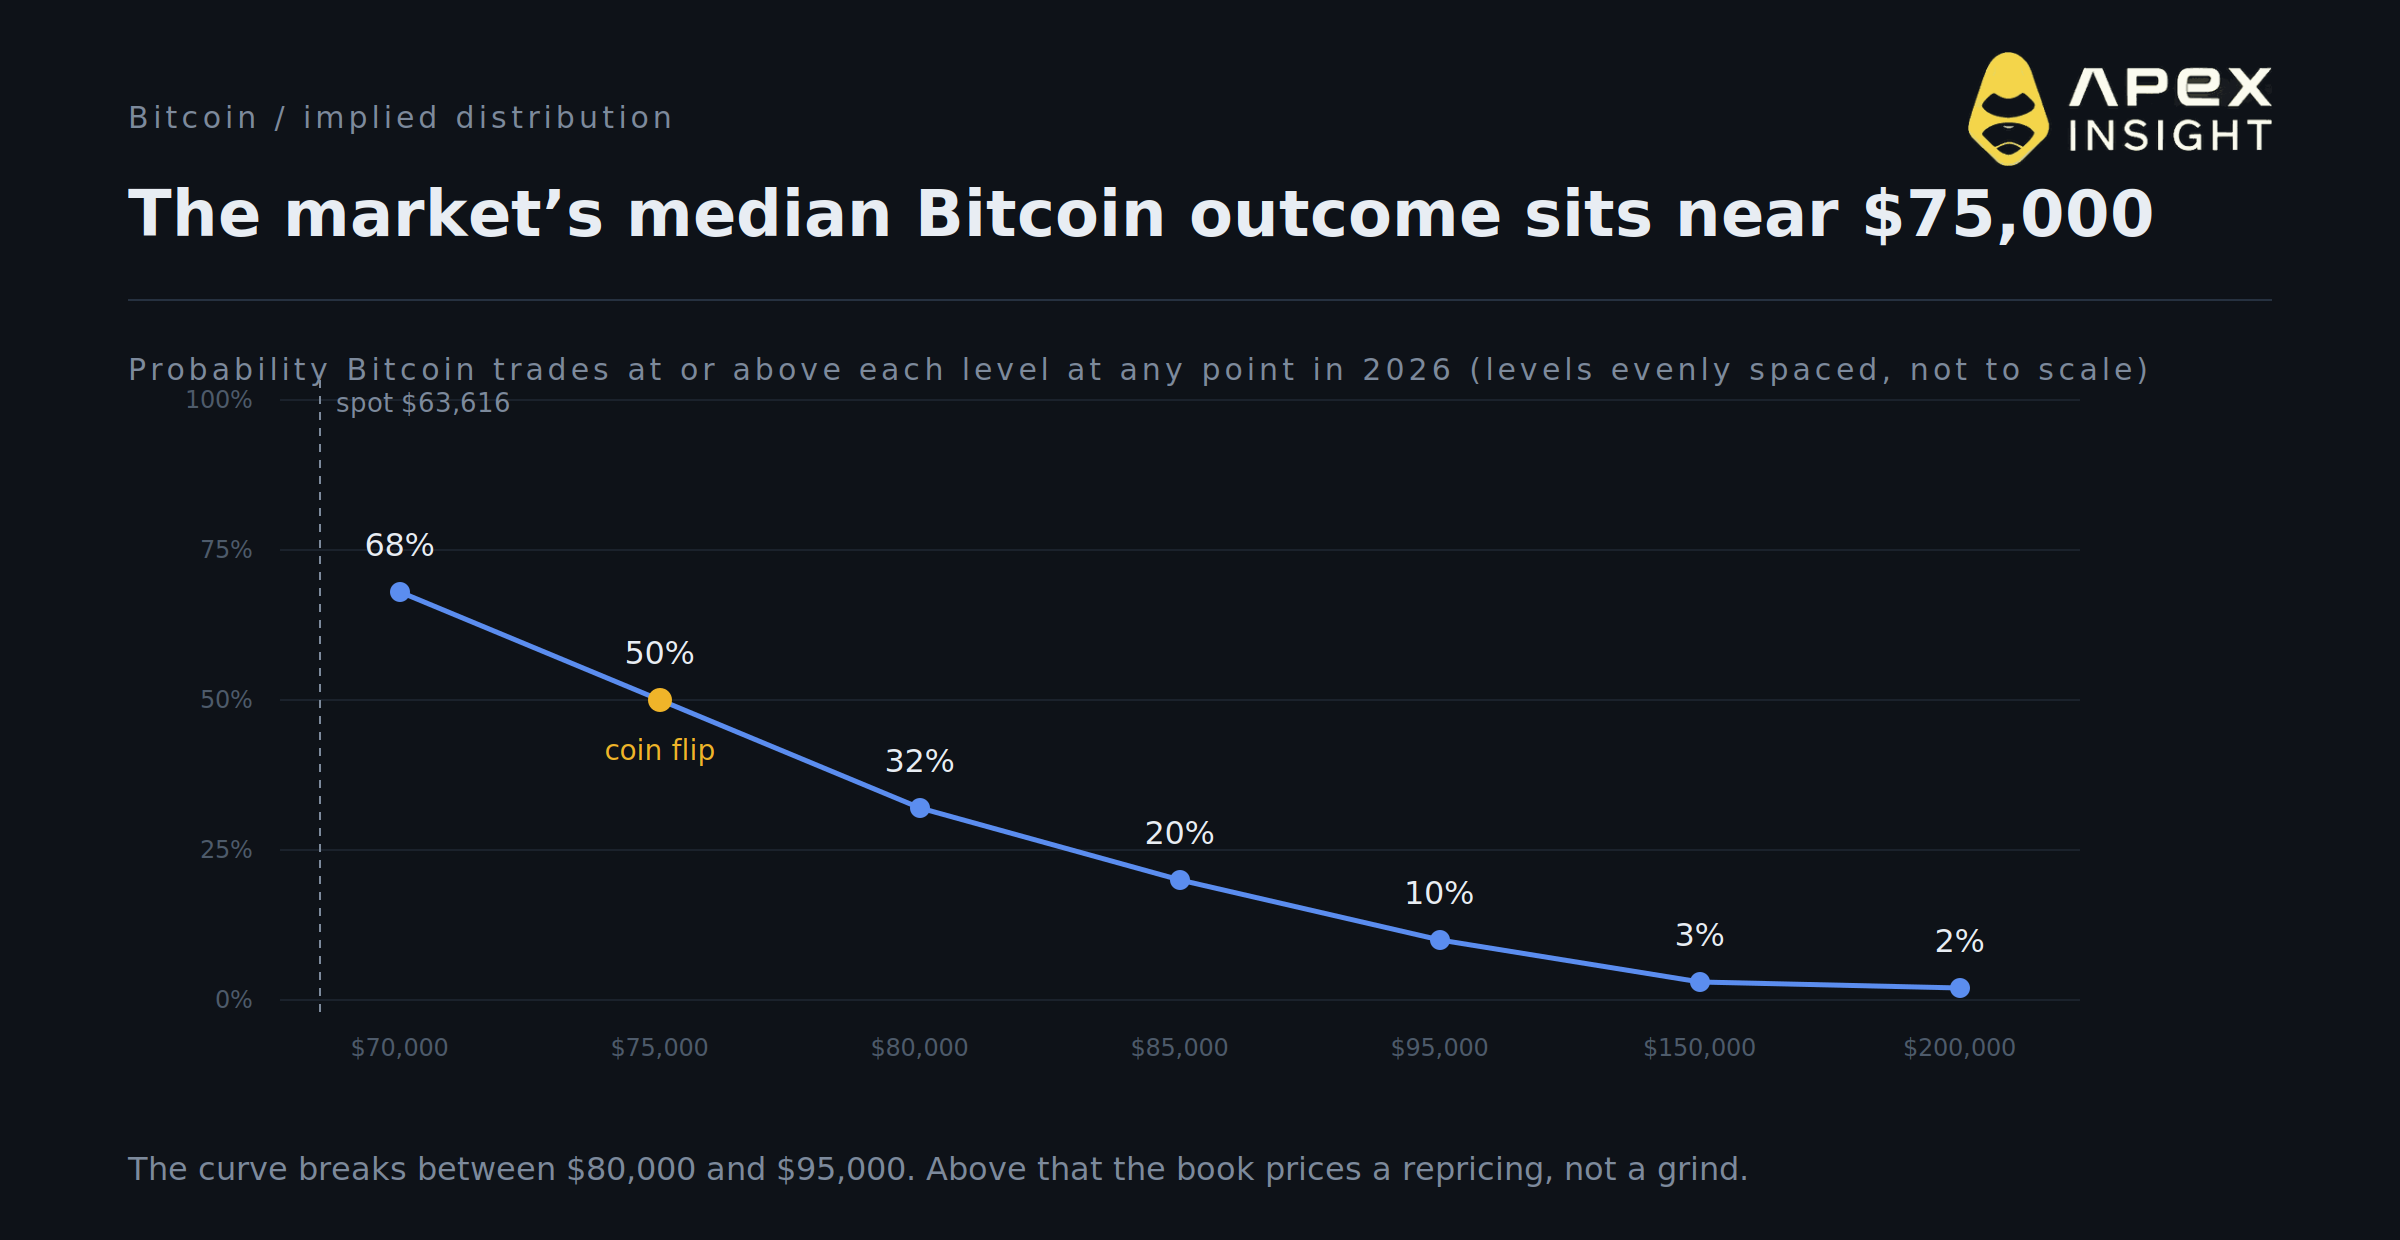
With spot at $63,616, a touch of $75,000 is the median outcome at 50 percent. That is roughly 18 percent above spot, which is a modest year by any historical Bitcoin standard.
The shape matters more than any single point. Probability falls 18 points between $70,000 and $75,000, then another 18 between $75,000 and $80,000, then decays smoothly toward zero. There is no second hump. Markets that expect a regime change usually show one, because a break above a key level implies a much wider range beyond it. This curve prices continuation of the current range, not a breakout from it.
For positioning, the practical read is that the asymmetry between $75,000 and $95,000 is where the disagreement is cheapest to express, since that segment carries the steepest decay per dollar of strike.
2. Four independent books converge on no new record
Convergence across unrelated markets is a stronger signal than any single price, because the participants and the liquidity are different in each.
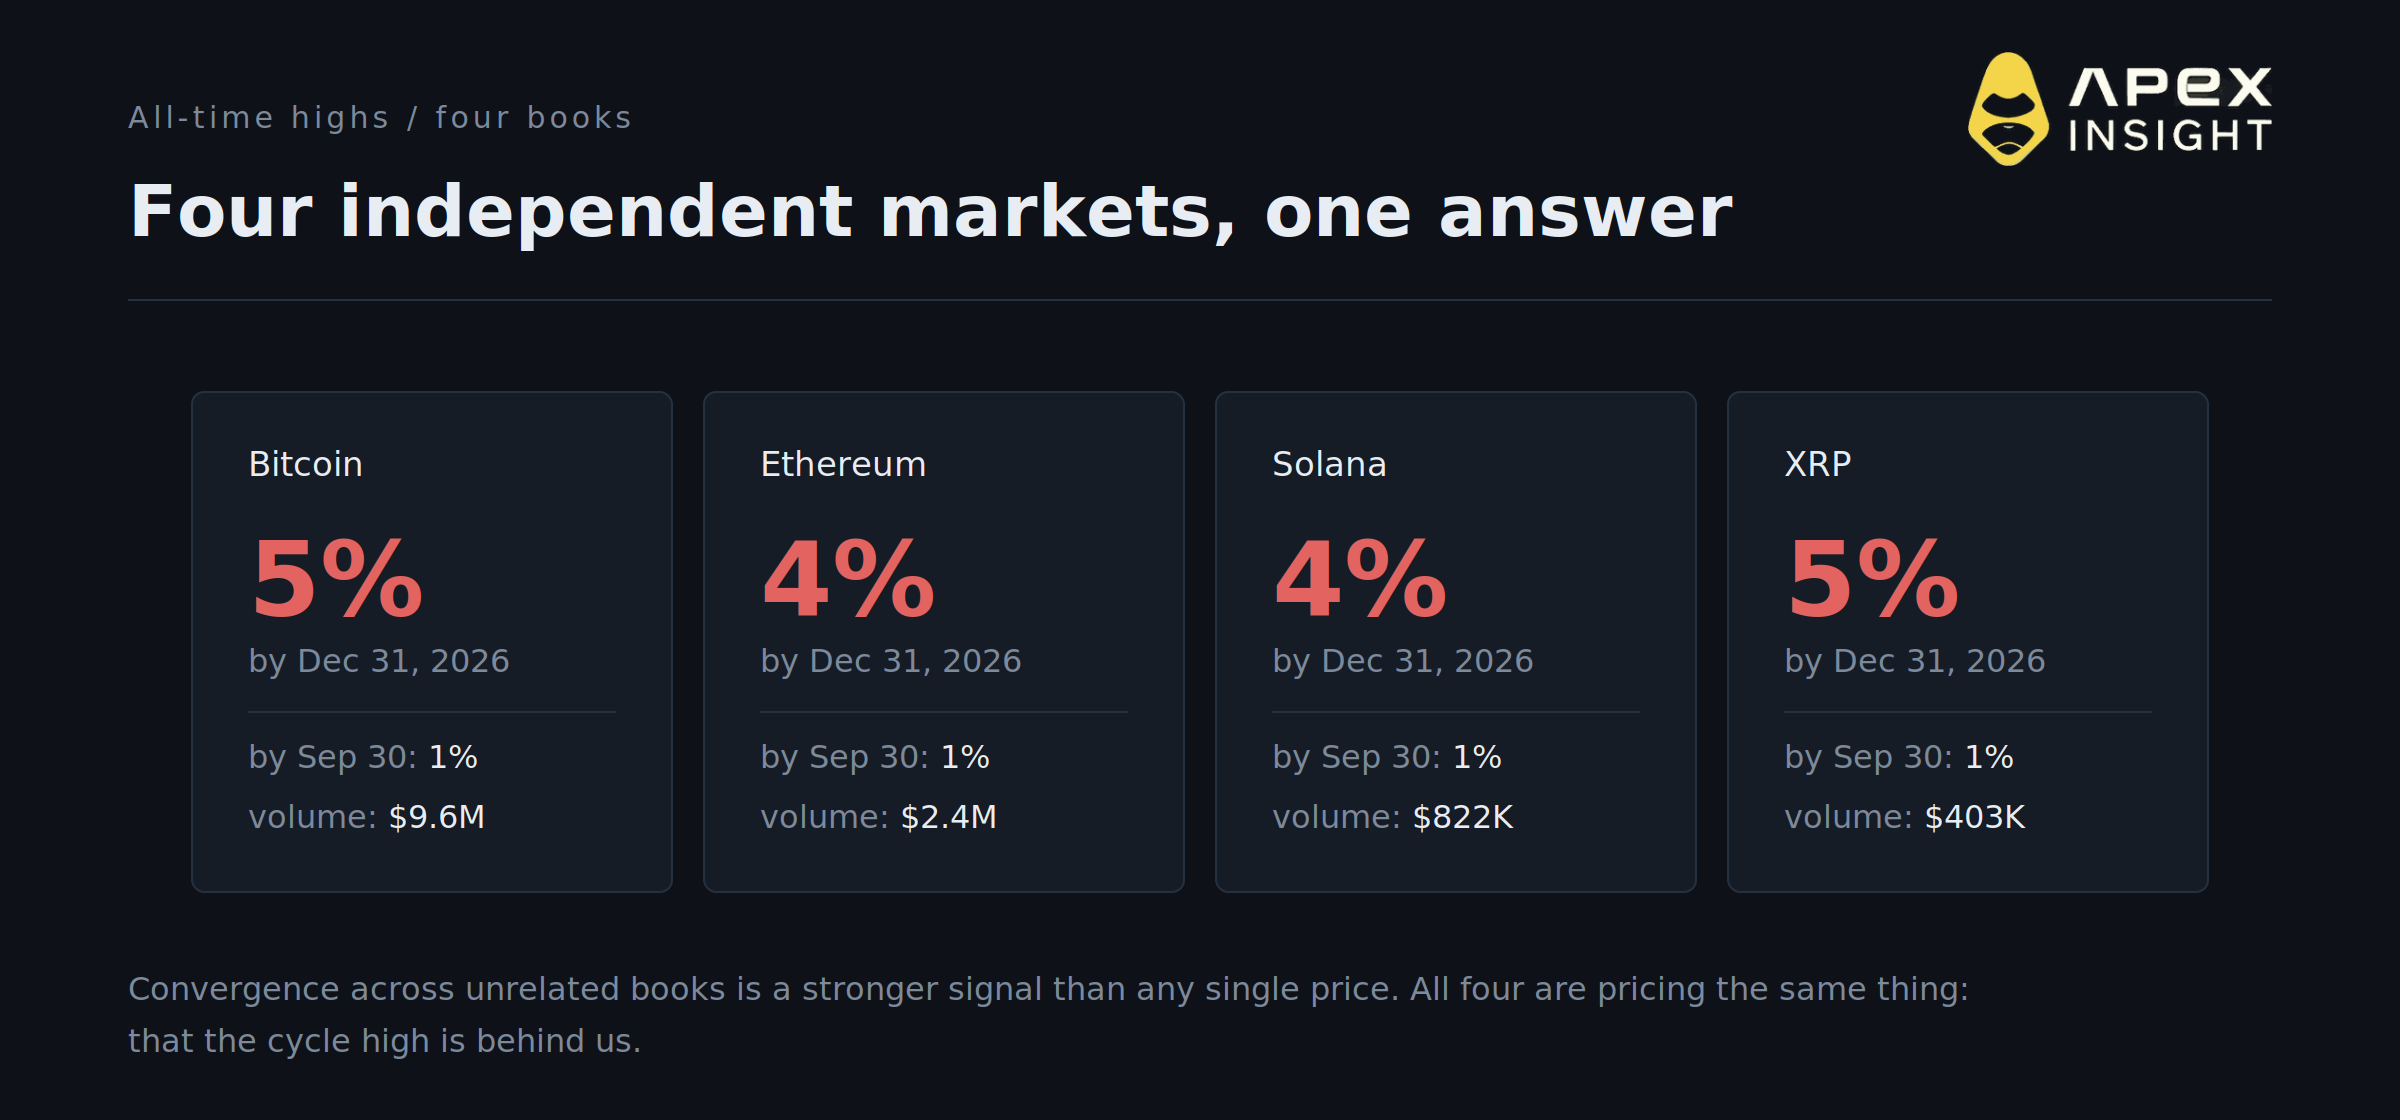
Bitcoin and XRP both price a new all-time high by December 31 at 5 percent. Ethereum and Solana price theirs at 4 percent. By September 30 all four sit at 1 percent.
These are four different assets with four different holder bases, four different supply dynamics and four separate order books. When they land within a point of each other, they are not pricing asset-specific factors. They are pricing a common one, and the only common factor available is the view that this cycle's high is already set.
Anyone whose thesis requires a record in a single asset is implicitly positioned against three other books at the same time.
3. The $150k thesis decayed in volume before it decayed in price
The market on Bitcoin reaching $150,000 carries $27.1M in total volume, second only to the main ladder. The current price is 3 percent, but the distribution of that volume is the more informative number.
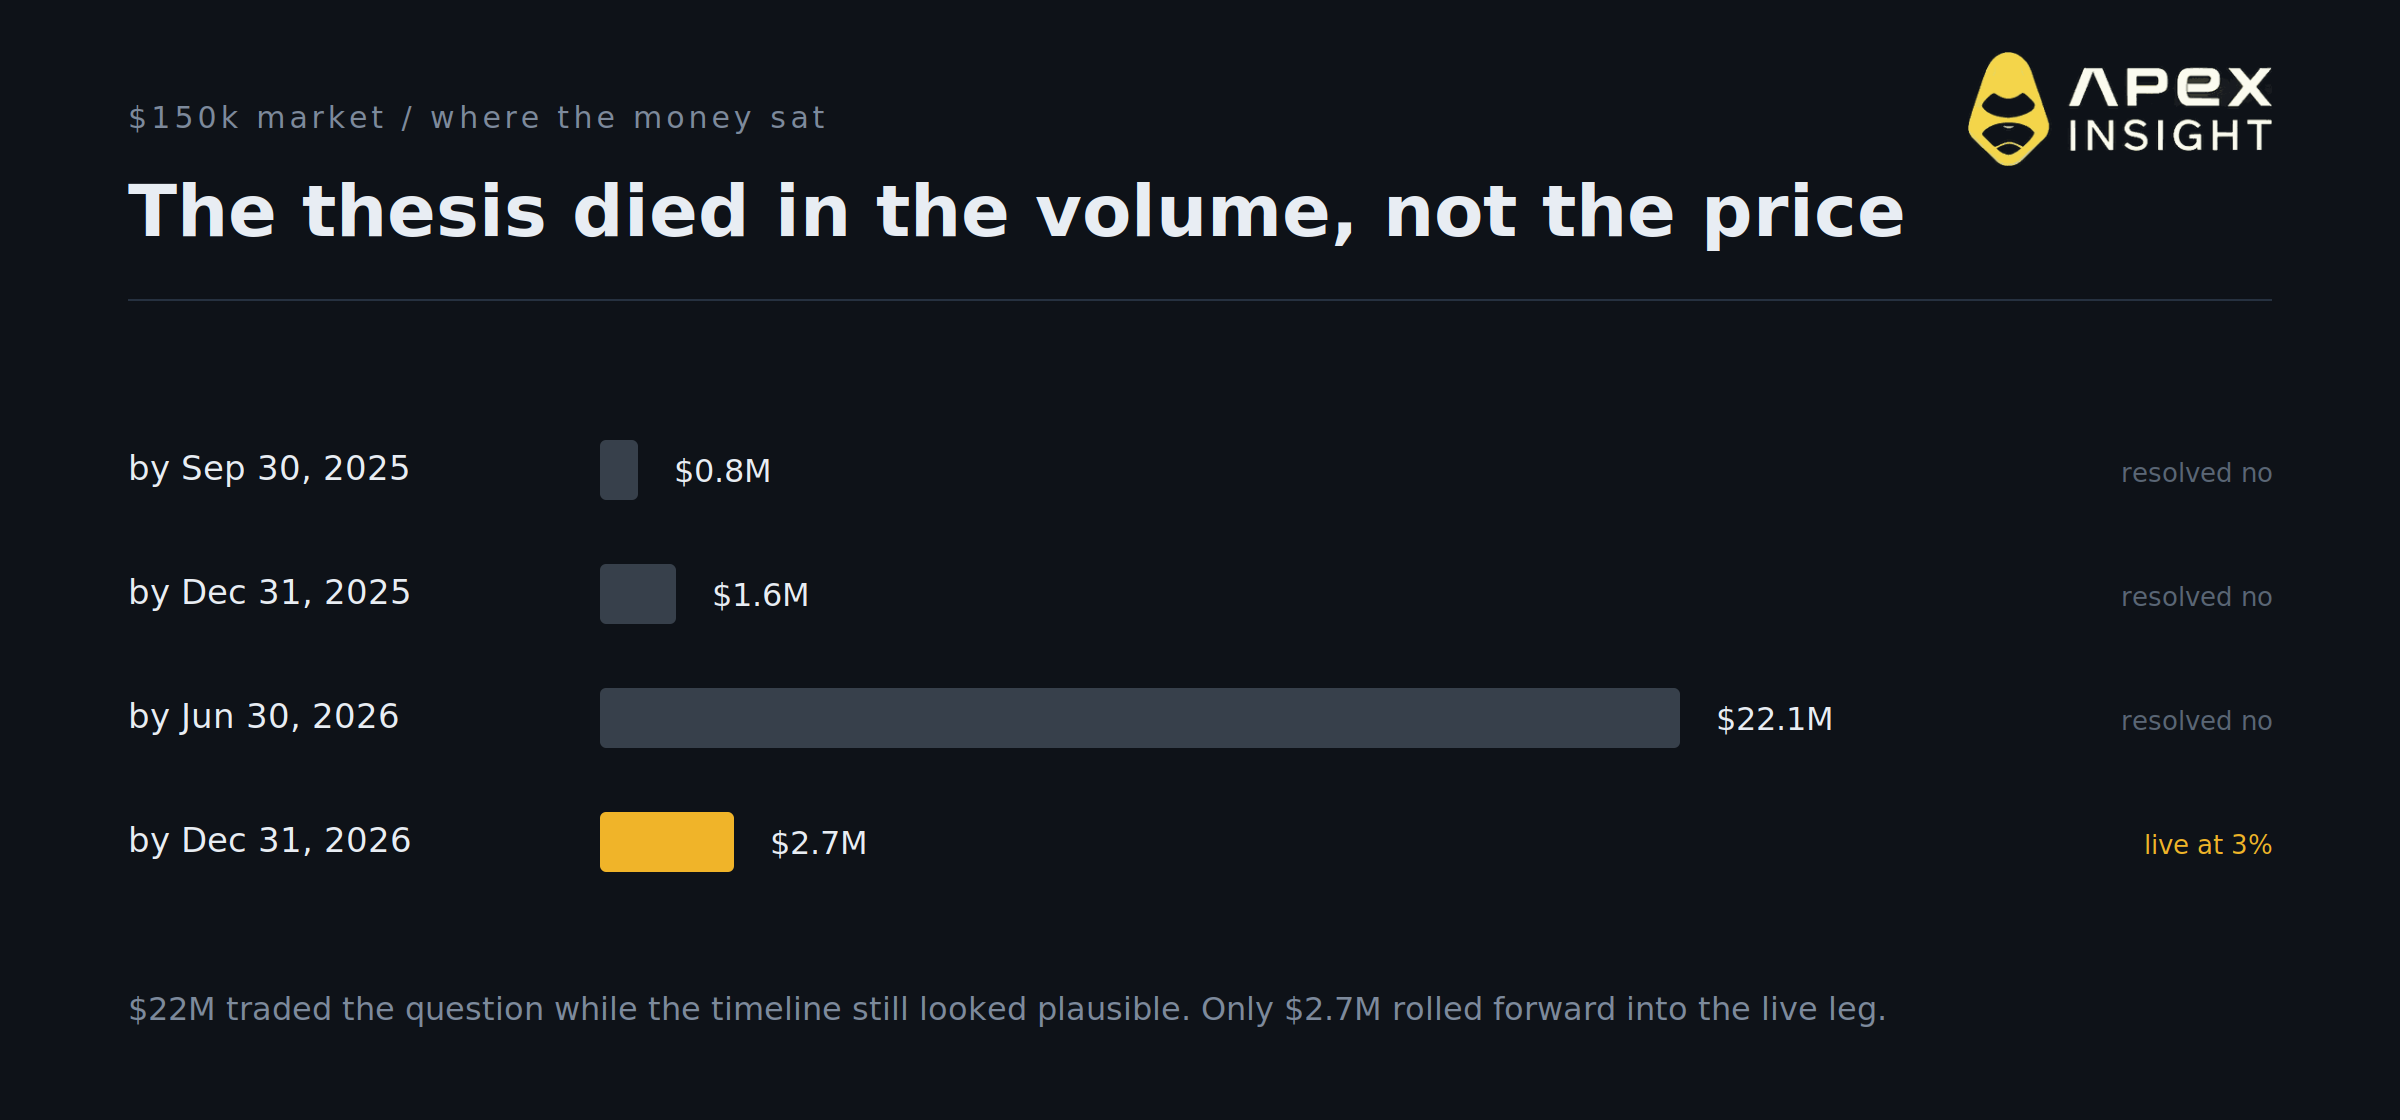
More than $22M traded on the June 30 leg, which has resolved no. Only $2.7M sits on the live December leg.
This is what a thesis looks like when it is abandoned rather than repriced. Capital engaged heavily while the timeline was plausible, lost, and did not roll forward into the next expiry. A 3 percent price on a book that has been vacated tells you far less than the eight-to-one ratio between dead and live volume.
The general lesson applies across the board. When you see a low probability, check whether it is low because the market has considered it and declined, or low because the market has stopped participating. Those are different signals and only one of them is tradeable.
4. Ethereum's curve is steeper than Bitcoin's
Ethereum sits at $1,885. The ladder prices $2,000 at 84 percent, $2,250 at 56 percent, $2,500 at 39 percent and $3,000 at 18 percent.
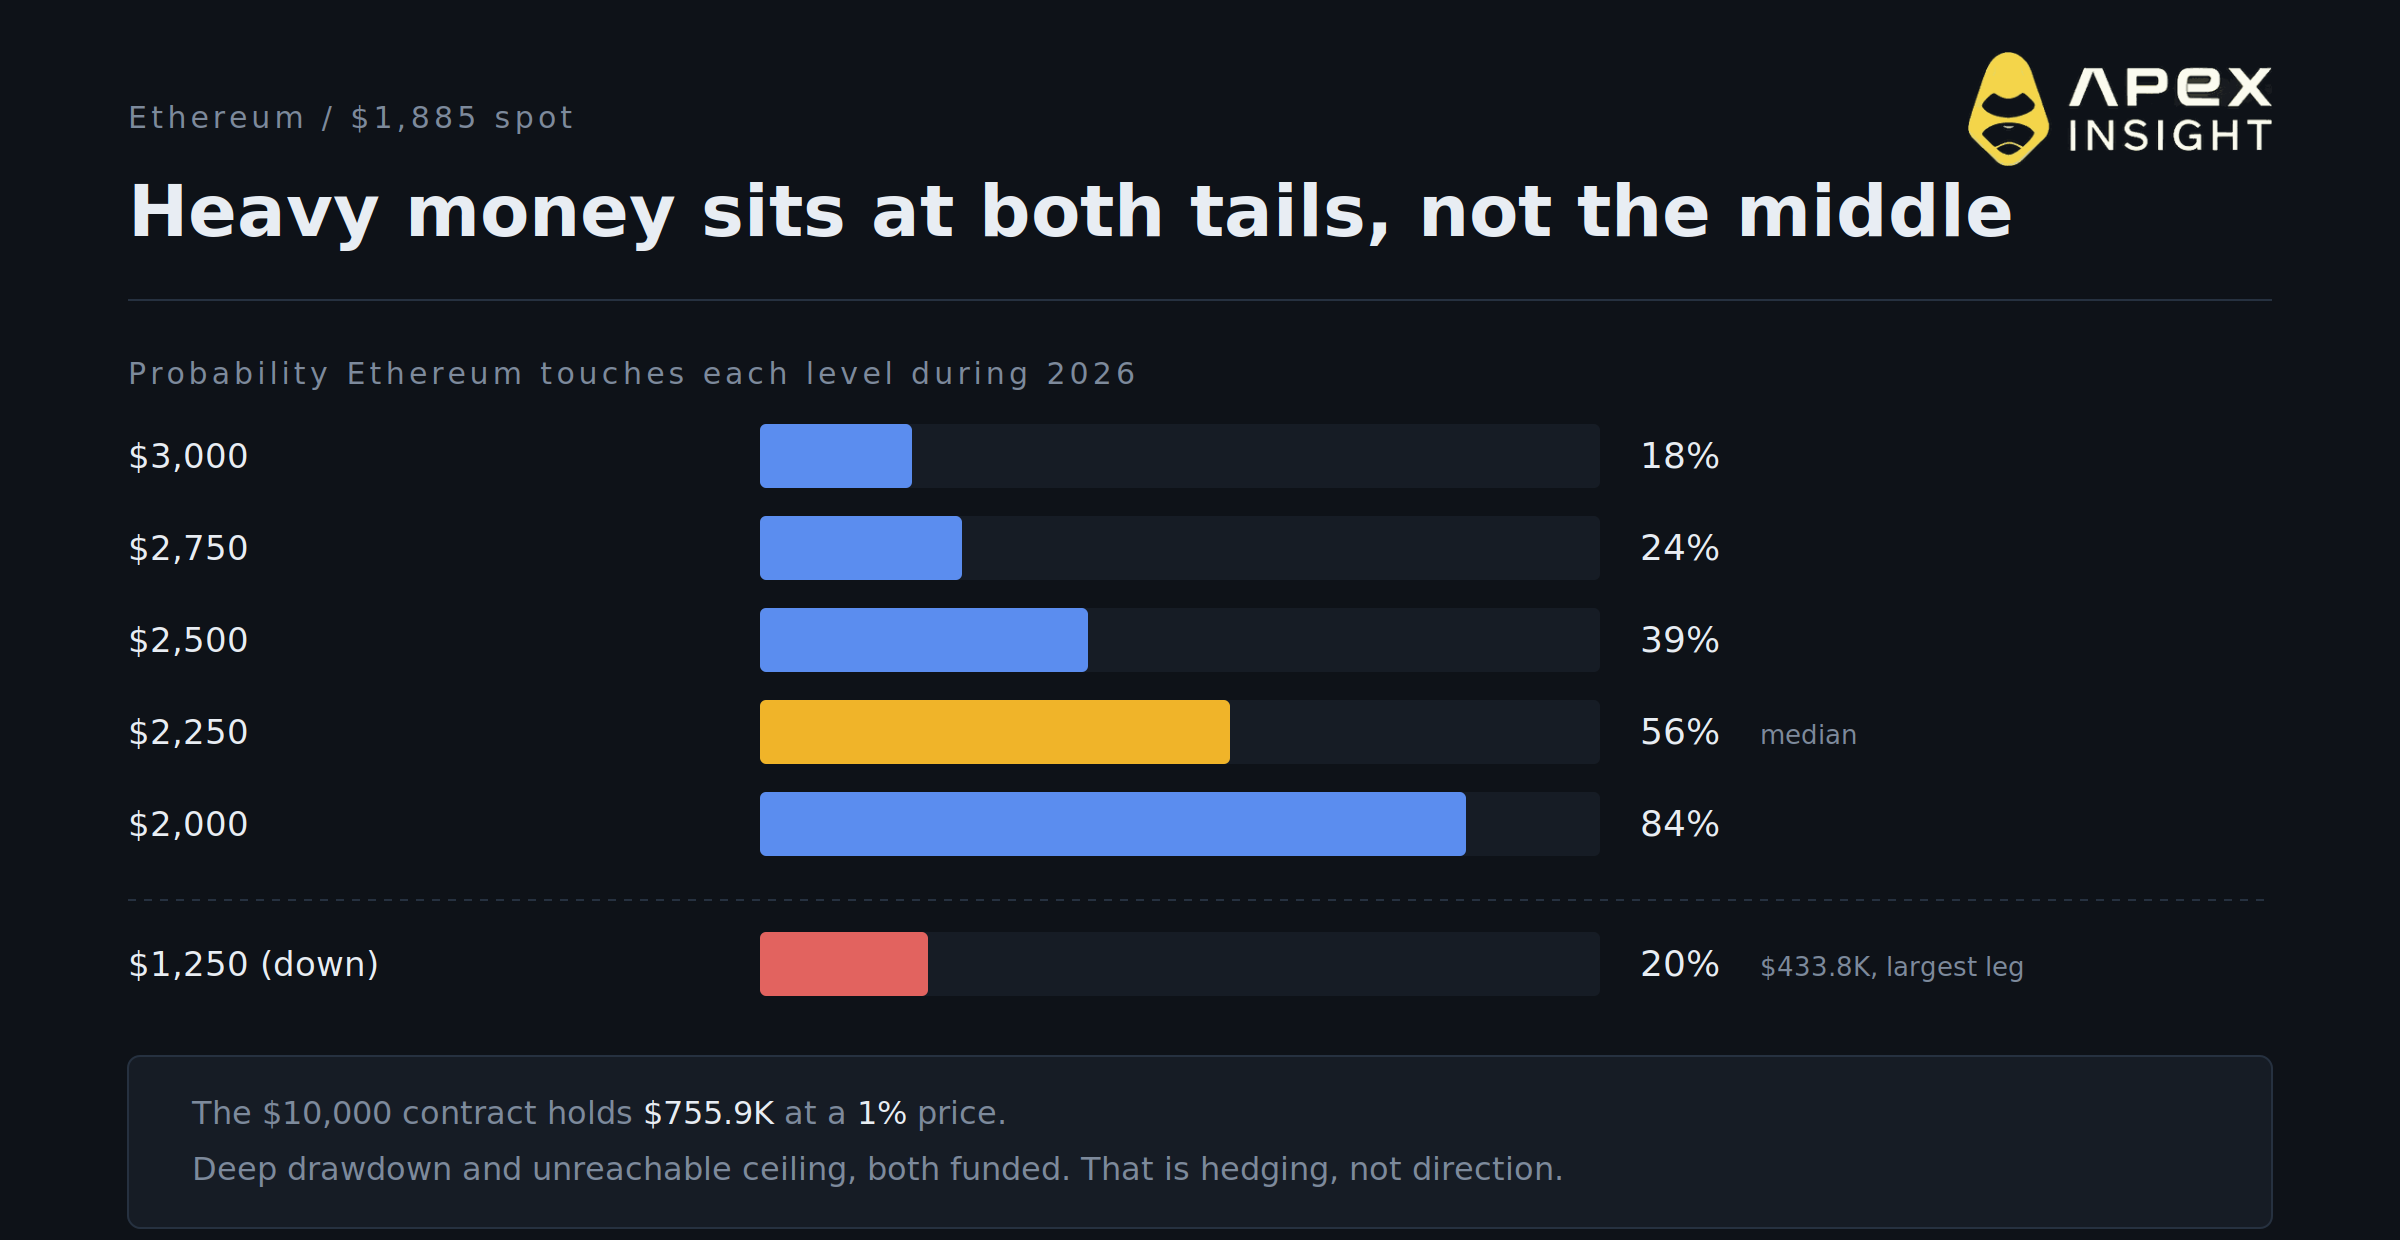
Normalised for spot, the median outcome sits about 19 percent above the current price, almost identical to Bitcoin's 18 percent. But the decay past the median is faster: Ethereum loses 45 points between plus 6 percent and plus 33 percent, where Bitcoin loses 36 points across a comparable span.
The downside legs carry the weight here. A touch of $1,250, roughly 34 percent below spot, prices at 20 percent and carries $433.8K, more volume than any upside leg on the ladder. Meanwhile the $10,000 contract holds $755.9K at a 1 percent price.
That combination, heavy money on a deep drawdown and heavy money on an unreachable ceiling, is characteristic of a market being used for hedging at both tails rather than for directional expression in the middle.
5. Solana prices less range than its beta implies
Solana trades at $75.92. The near ladder prices $90 at 56 percent, $100 at 38 percent, $120 at 20 percent and $140 at 10 percent, with a touch of $50 at 26 percent.
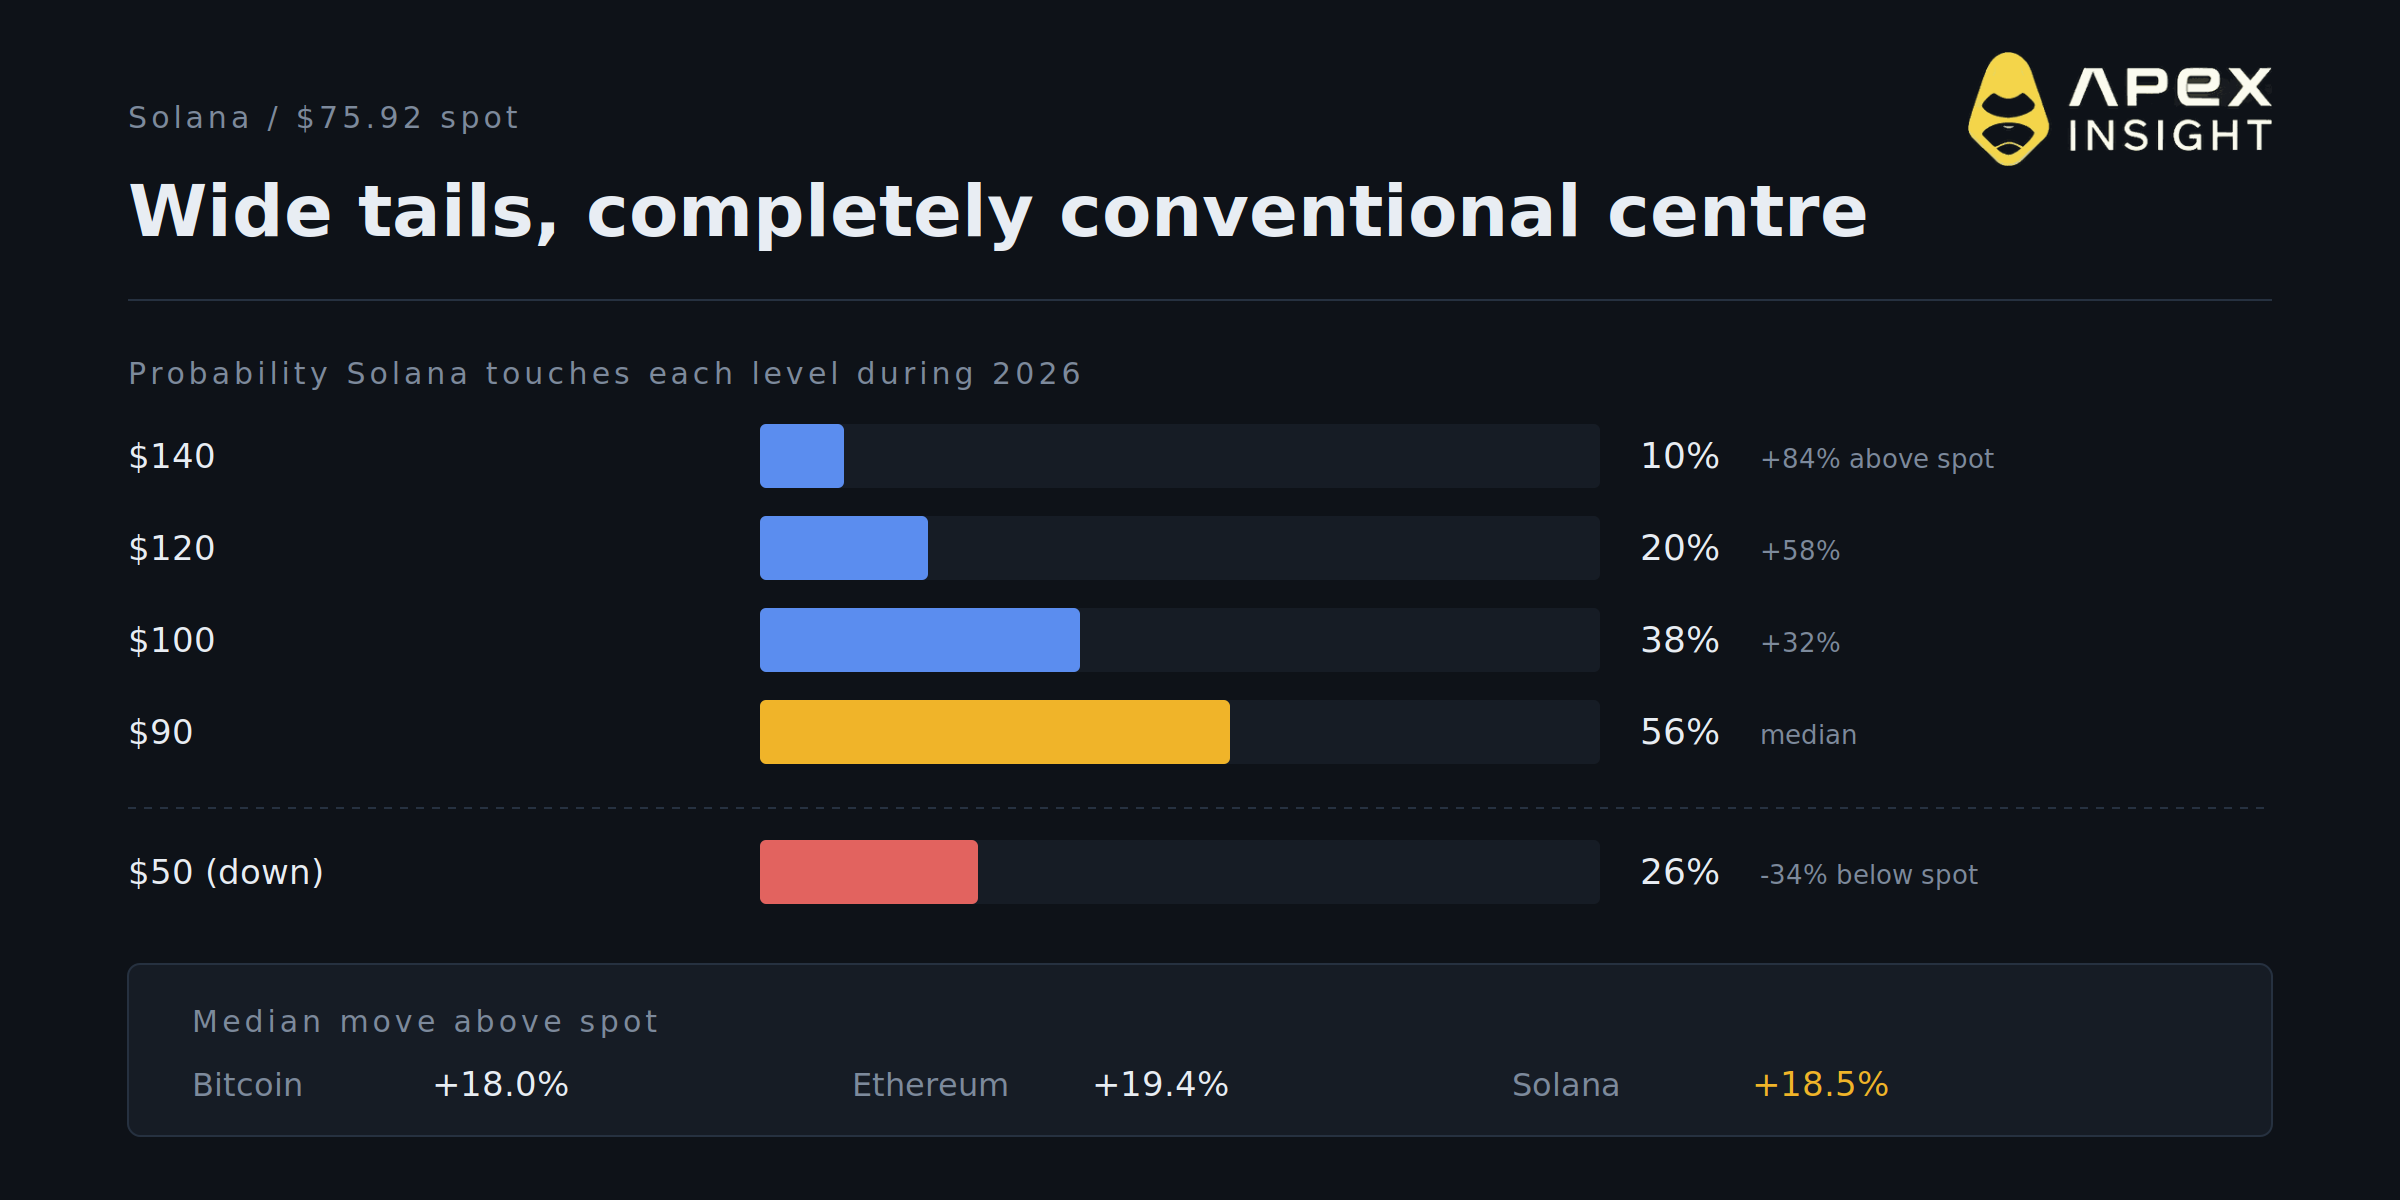
Normalise those and the picture is unusual. Solana's 10 percent line sits about 84 percent above spot. Bitcoin's sits about 49 percent above. That is a wider tail, as you would expect from a higher-beta asset. But its median sits at plus 18.5 percent, effectively identical to Bitcoin's and Ethereum's.
In other words, the market is pricing Solana with normal-sized tails and a completely conventional centre. Historically, Solana's realised distribution has been far wider in both directions than the majors it is being priced alongside. Either the market has decided this cycle is different, or the middle of that ladder is mispriced relative to realised behaviour.
6. One major prices its downside above its upside
Comparing equidistant moves strips out spot and makes skew visible directly.
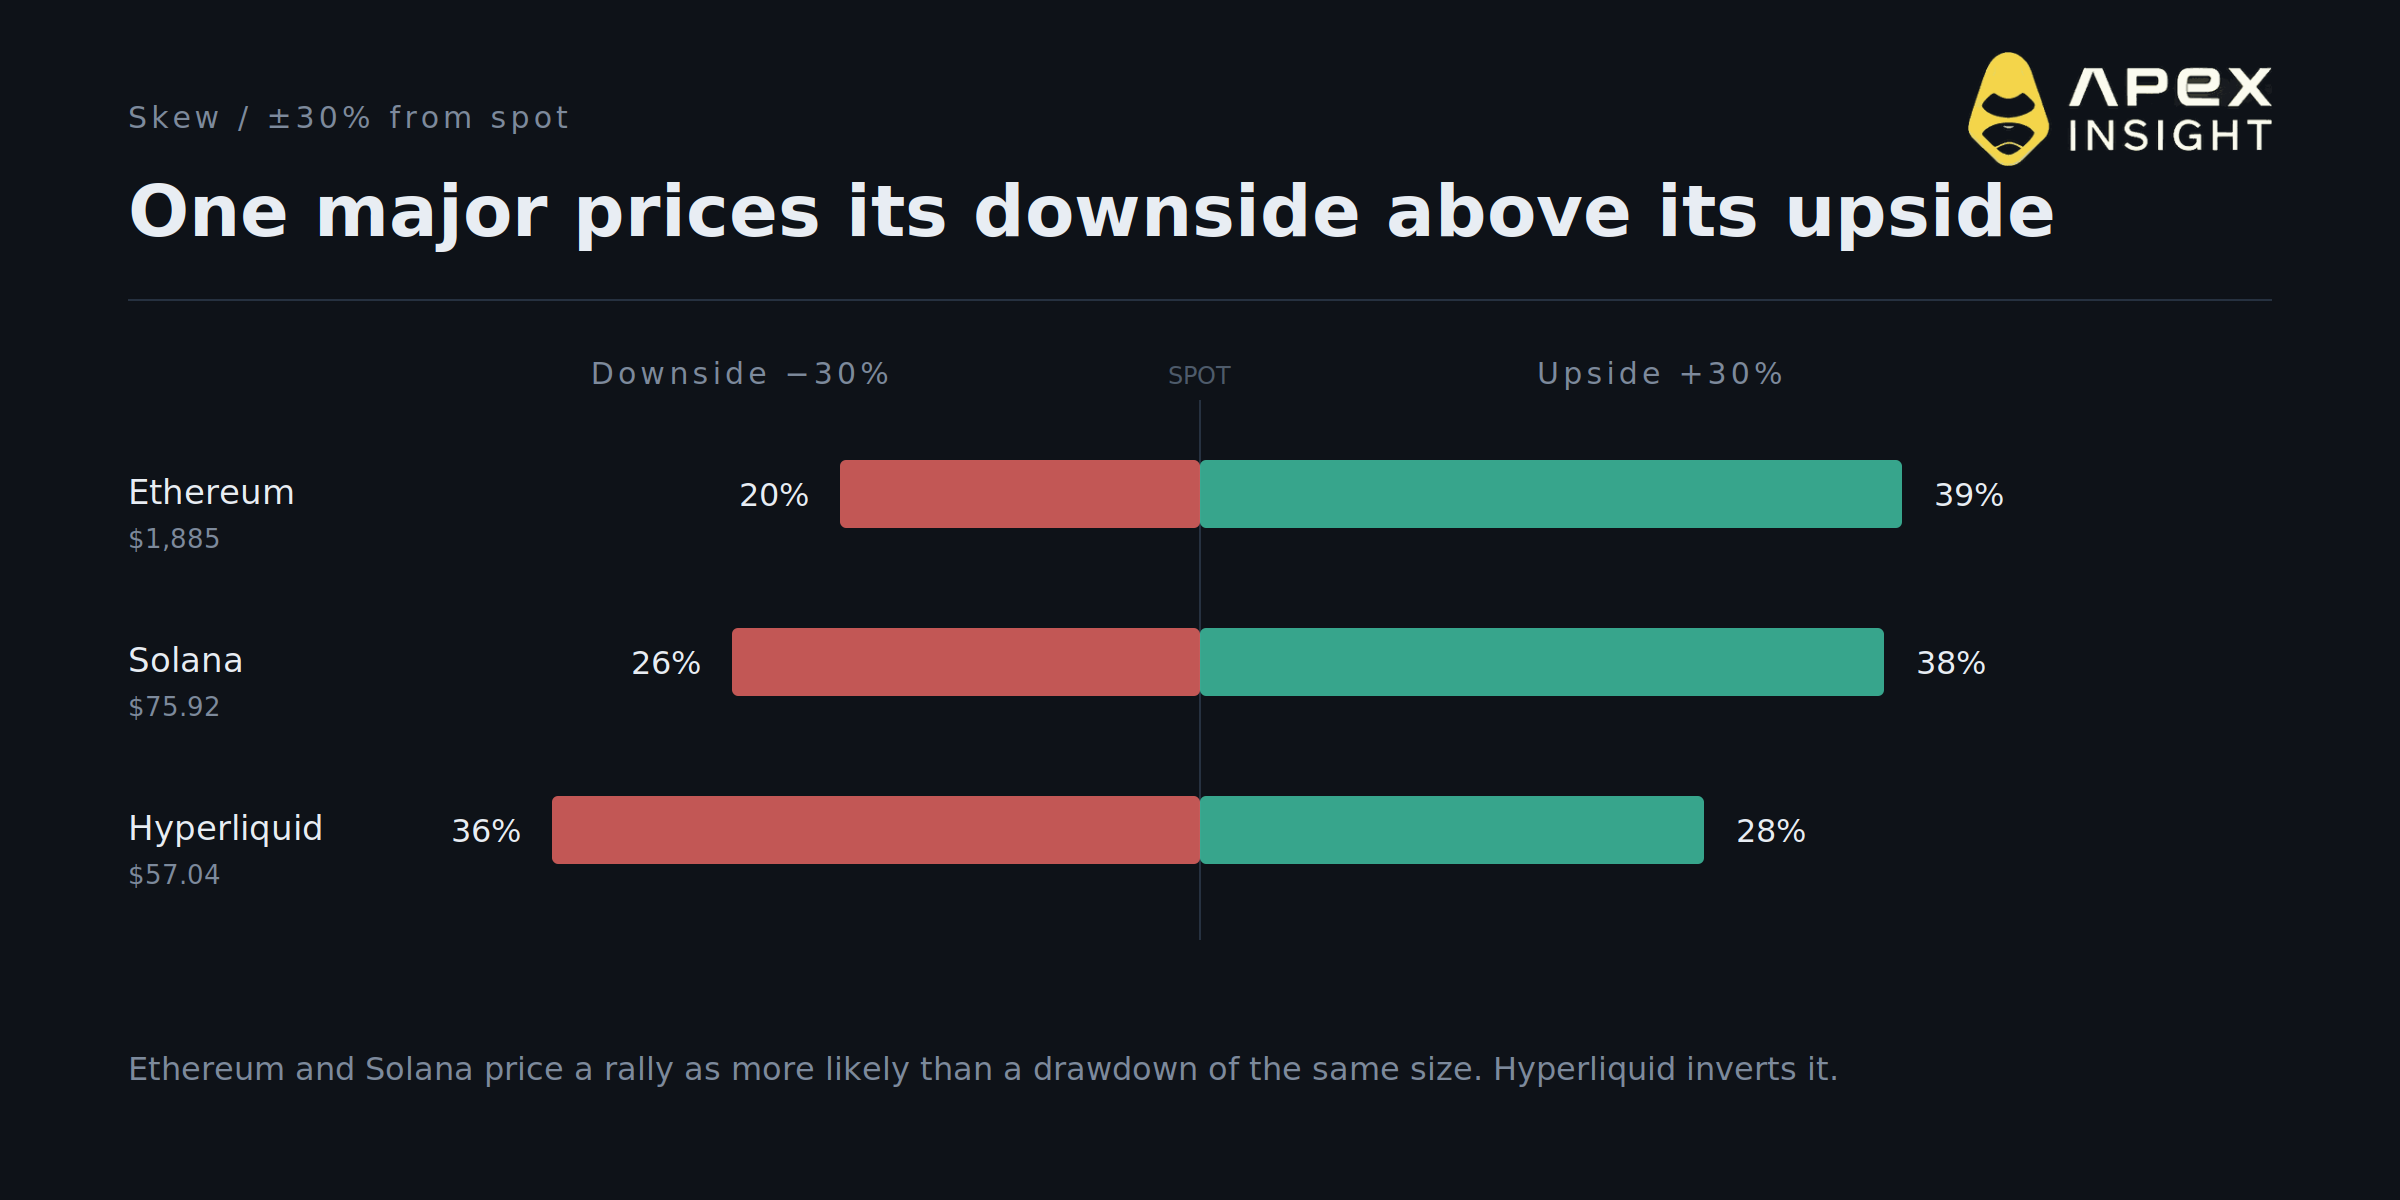
Ethereum prices a 30 percent rally at 39 percent against a 30 percent drawdown at 20 percent. Solana prices 38 against 26. Both lean positive.
Hyperliquid inverts it. At $57.04 spot, a touch of $80 prices at 28 percent while a touch of $50 prices at 73 percent and $40 at 36 percent. It is the only major on the board where the market prices the downside above the upside at comparable distance.
Worth noting alongside that: the $100 leg holds $535.5K, the largest single position in the market and the furthest out of the money. Concentrated volume at a distant strike is not evidence of conviction in that outcome. It is usually cheap optionality, and it distorts any read that weights markets purely by traded size.
7. XRP's distribution has collapsed into a range
XRP trades at $1.01 having touched both $2.40 and $1.20 earlier in the year, which is why both of those legs sit resolved.
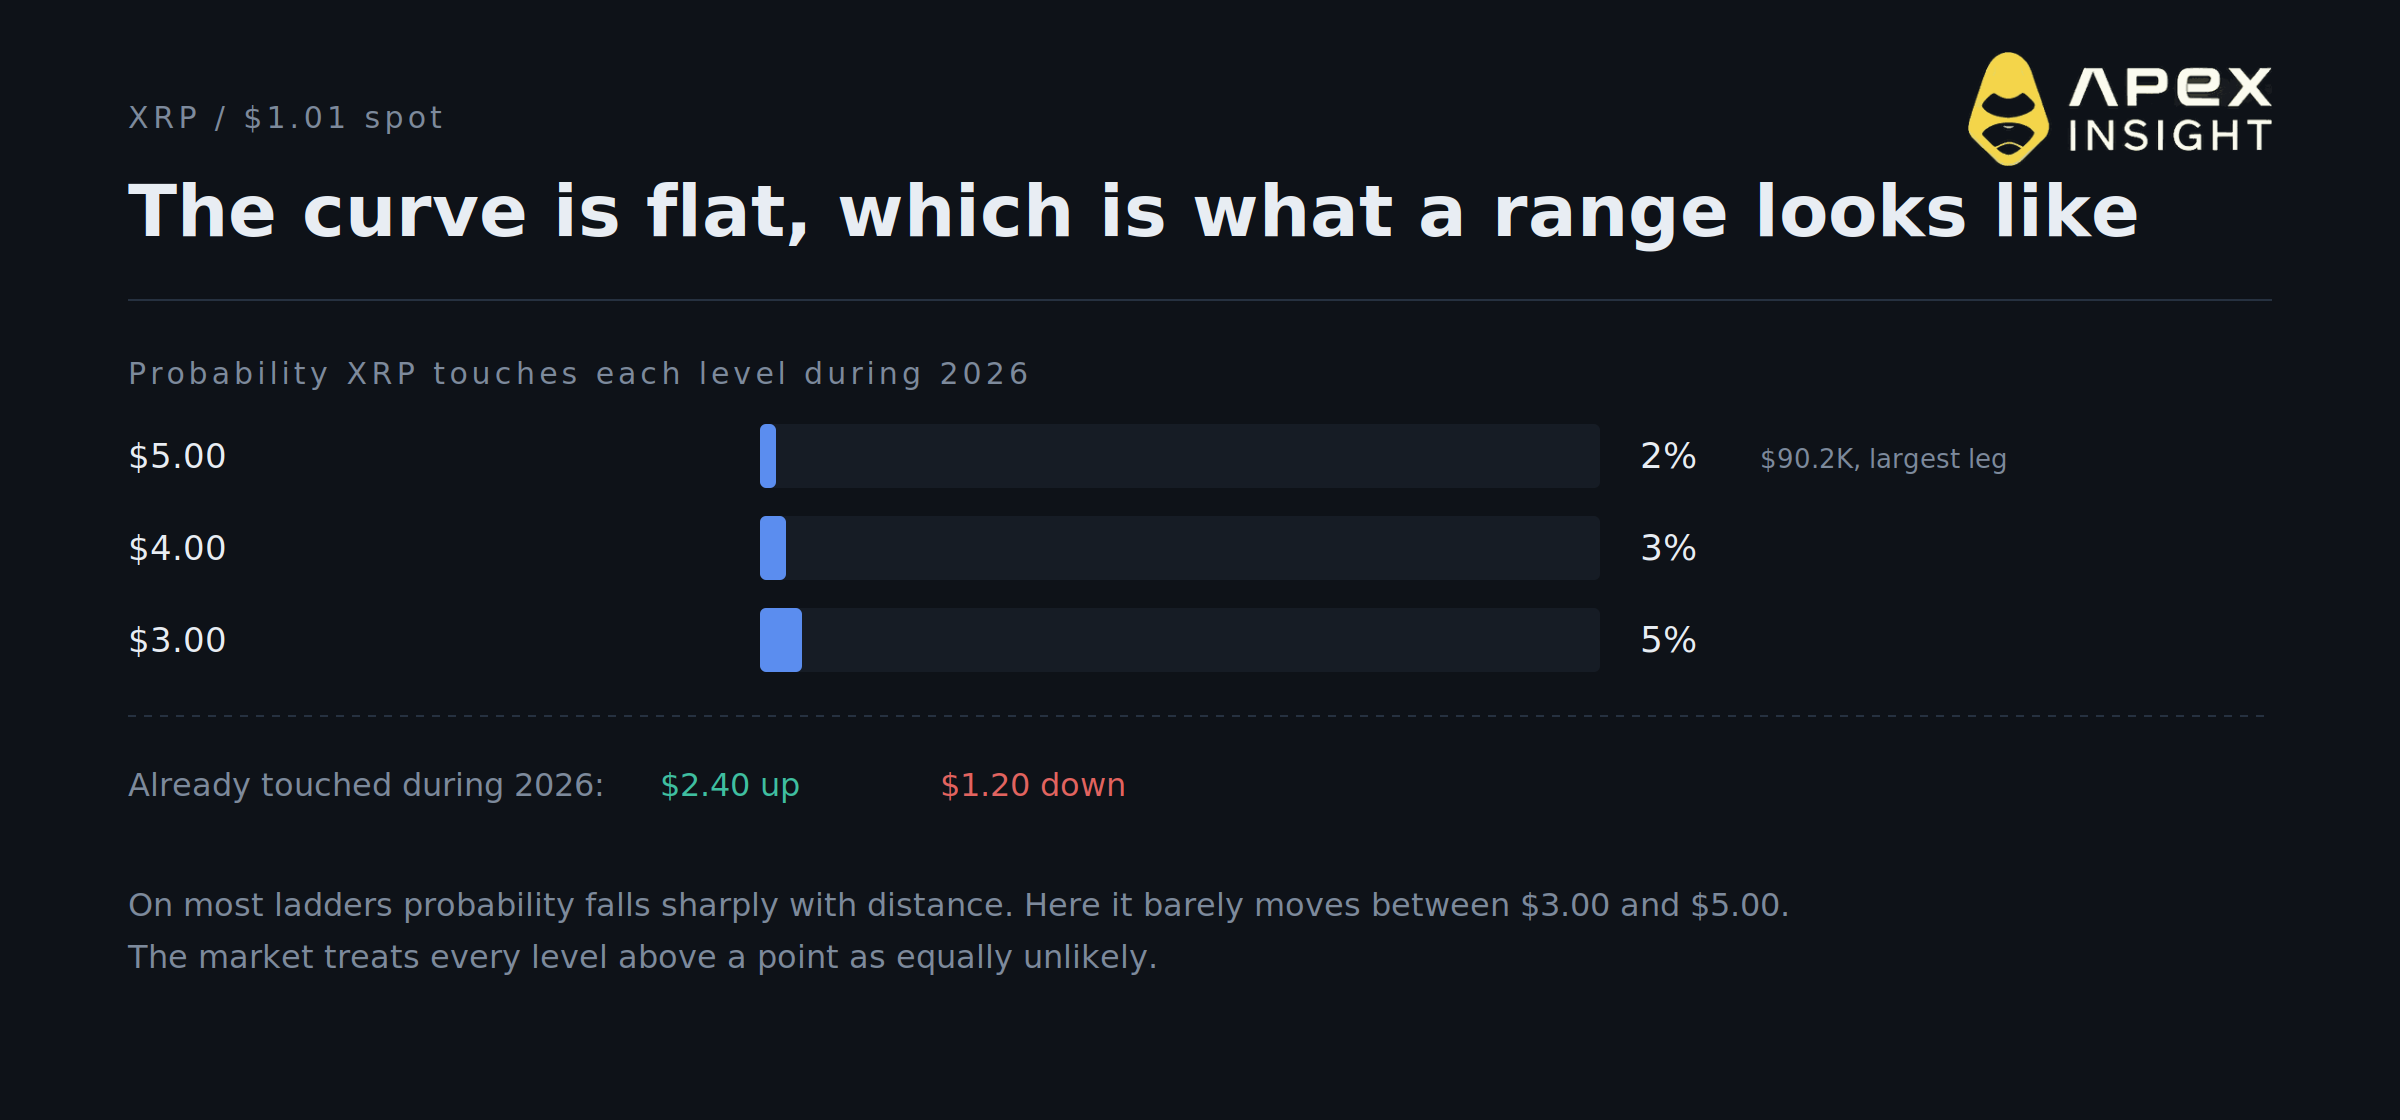
What remains prices flat and low. A touch of $3.00 is 5 percent, $4.00 is 3 percent, and $5.00 is 2 percent while carrying $90.2K, the largest position in the book.
The flatness is the signal. On most ladders, probability falls sharply with distance. Here it barely moves between $3.00 and $5.00, which is what a distribution looks like when the market treats every level above a certain point as equally unlikely. That is range pricing, not trend pricing.
8. Index exposure is favoured over both metals and crypto
The three-way relative performance market is the cleanest cross-asset read available.
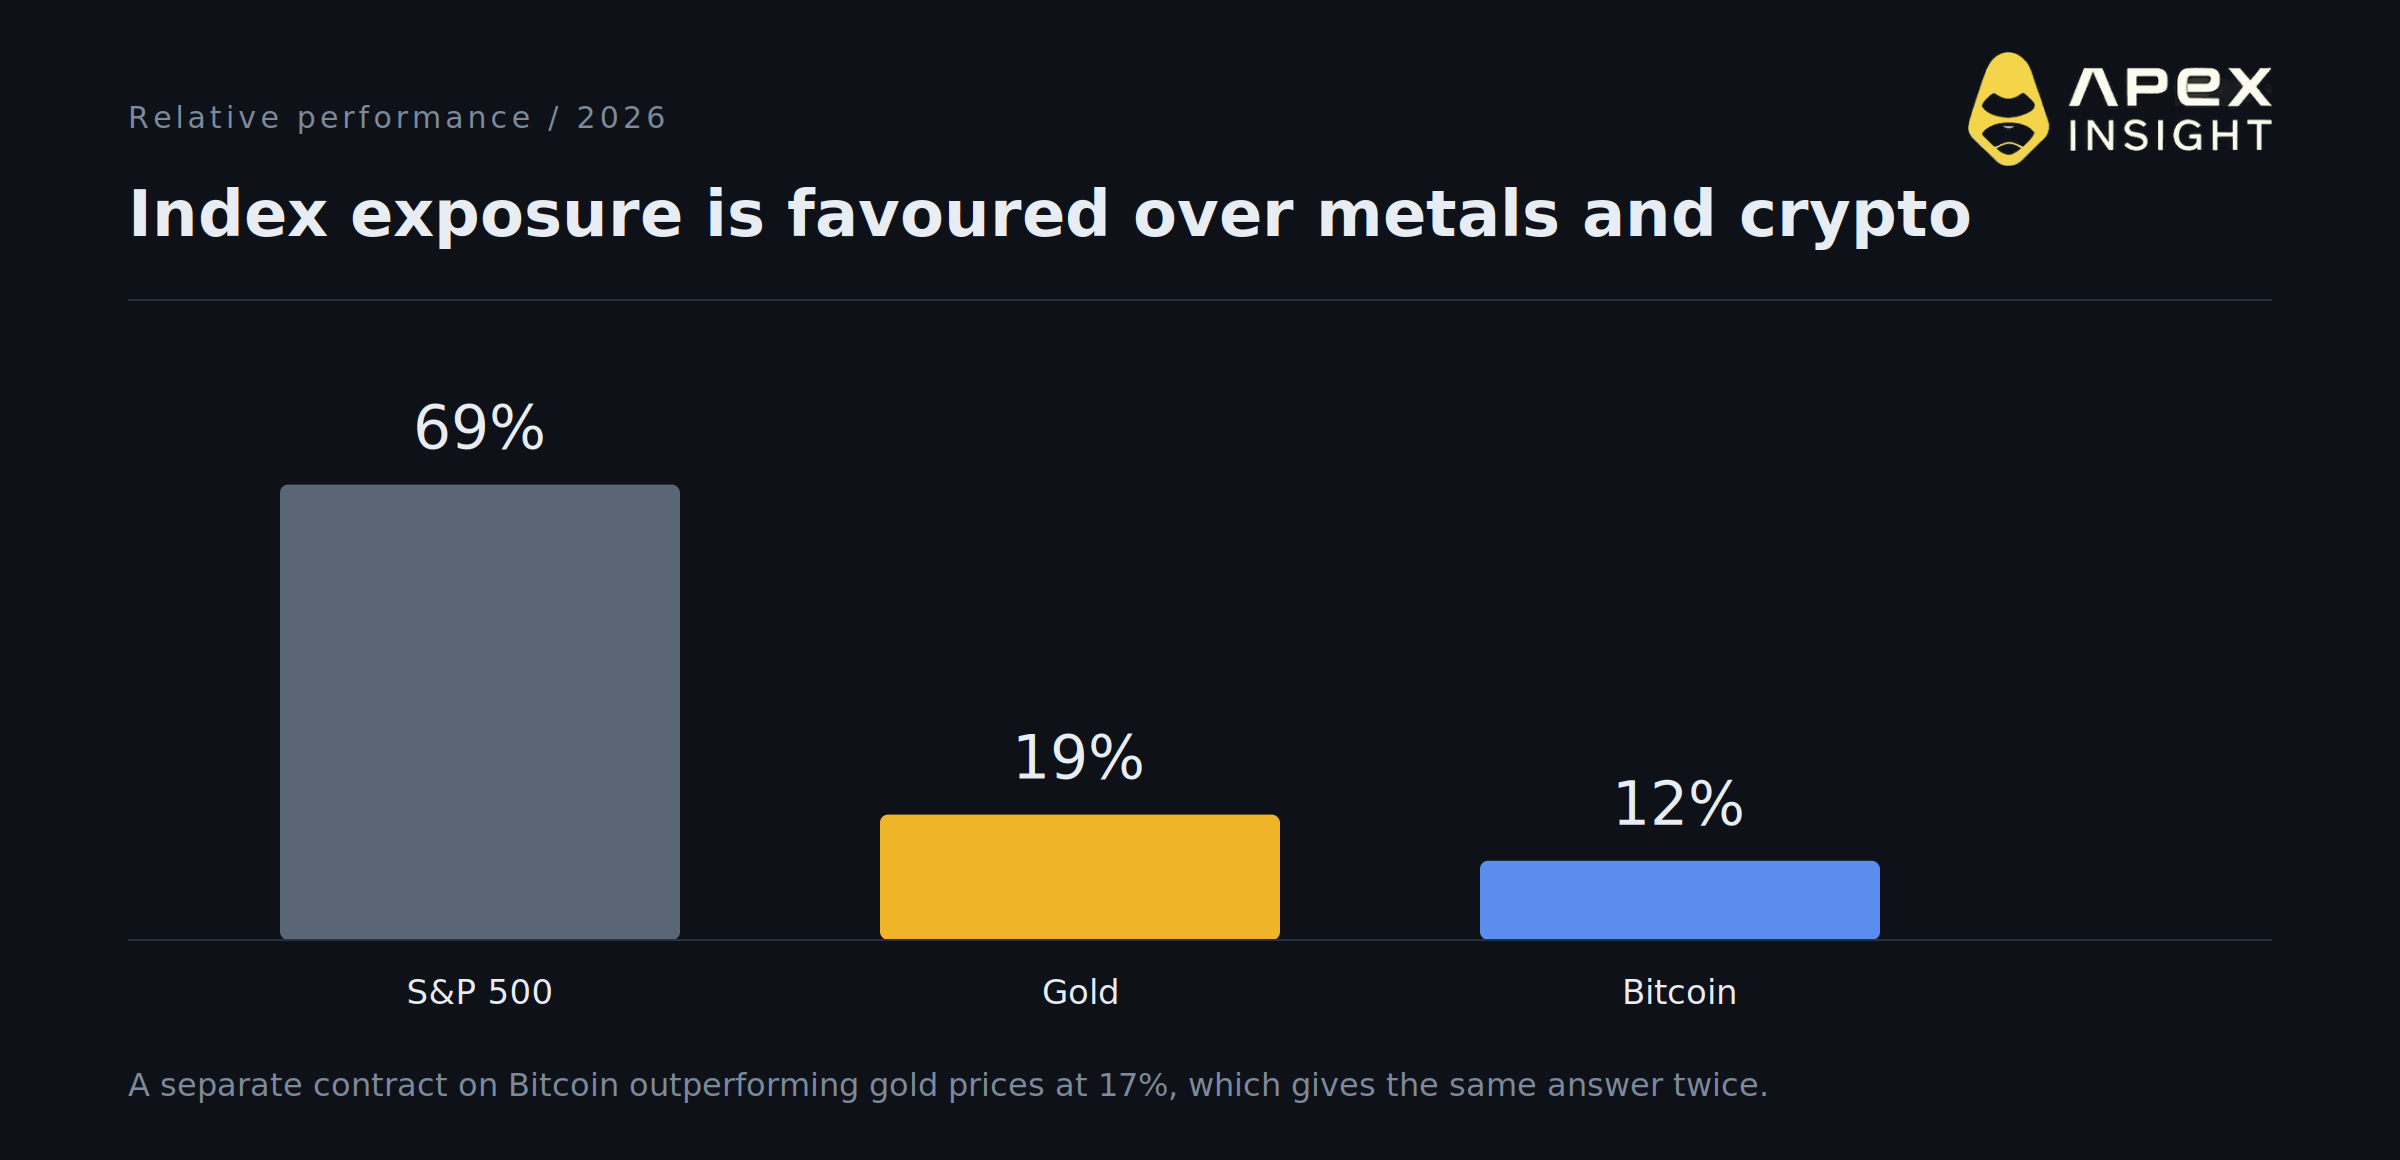
A separate contract on Bitcoin outperforming gold in 2026 prices at 17 percent on $436.3K, which independently corroborates the three-way split.
Every standard case for Bitcoin, whether debasement hedge, digital gold, or high-beta risk proxy, implies outperforming at least one of these two. The market prices all versions at a discount, and puts passive index exposure ahead of both. For anyone running a crypto allocation against a traditional benchmark, that is the single most uncomfortable number in this article and the one most worth stress-testing.
9. On-chain data corroborates the book
Prediction markets can be wrong together. The useful test is whether independent data agrees, and here it does.
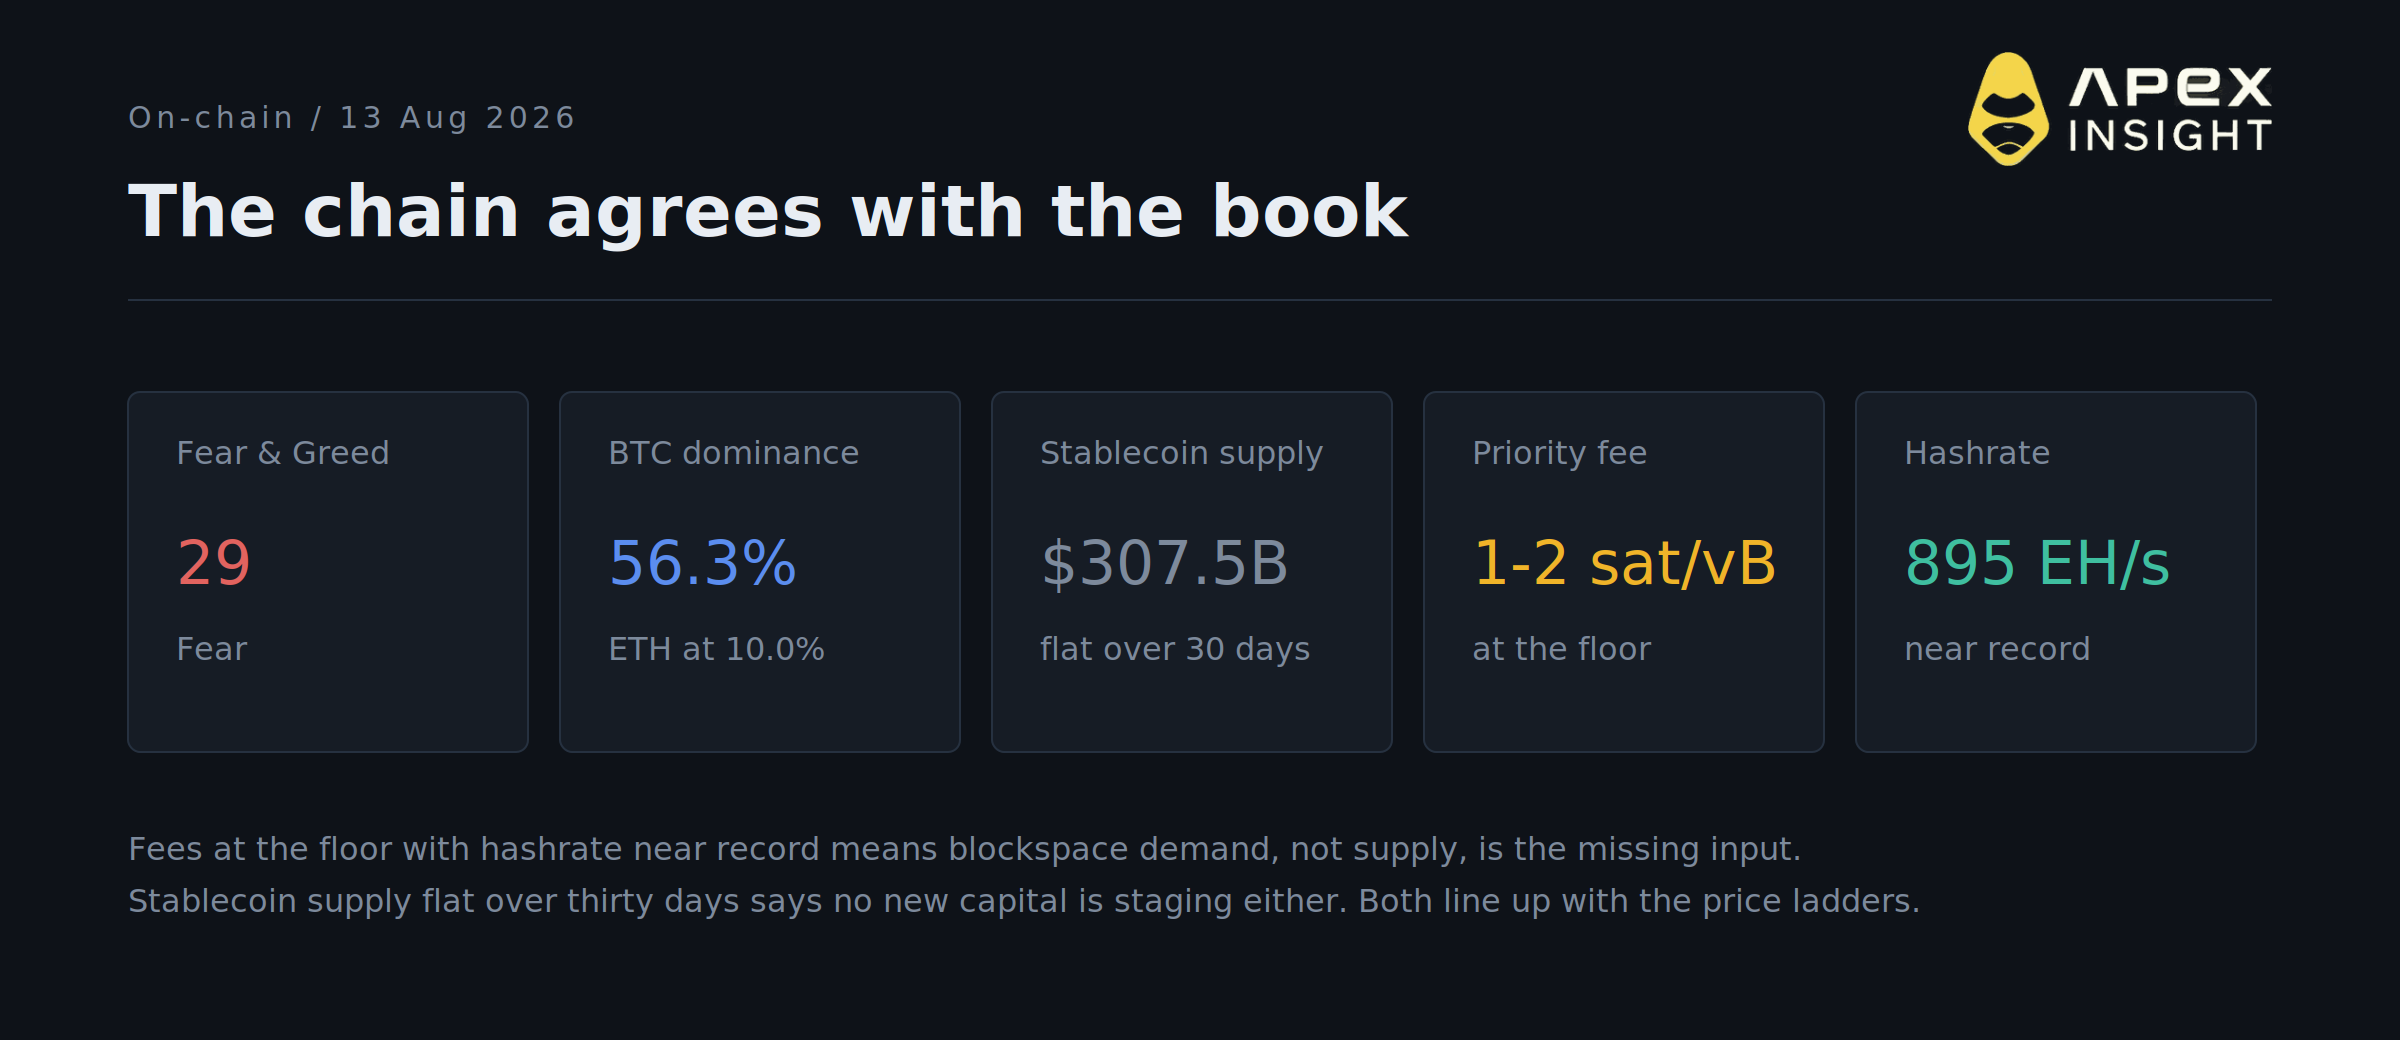
Three things stand out. Bitcoin priority fees sit at 1 to 2 sat/vB with hashrate near record levels, which means the constraint is demand for blockspace rather than supply of it. Stablecoin supply at $307.5B is flat over thirty days, so no new capital is staging on the sidelines waiting to deploy. Bitcoin dominance at 56.3 percent against Ethereum's 10.0 percent shows no rotation into higher-beta assets.
Sentiment at 29 on the Fear and Greed index is the one contrarian input, and it is worth treating carefully. Fear readings are only useful as a reversal signal when they diverge from flows. Here they do not. Fees, stablecoin supply and the price ladders are all pointing the same direction, which makes 29 a description of conditions rather than a setup.
10. The one steep curve on the board is in privacy assets
Every ladder above prices upside as expensive. One corner does not, and normalising for spot makes it obvious.
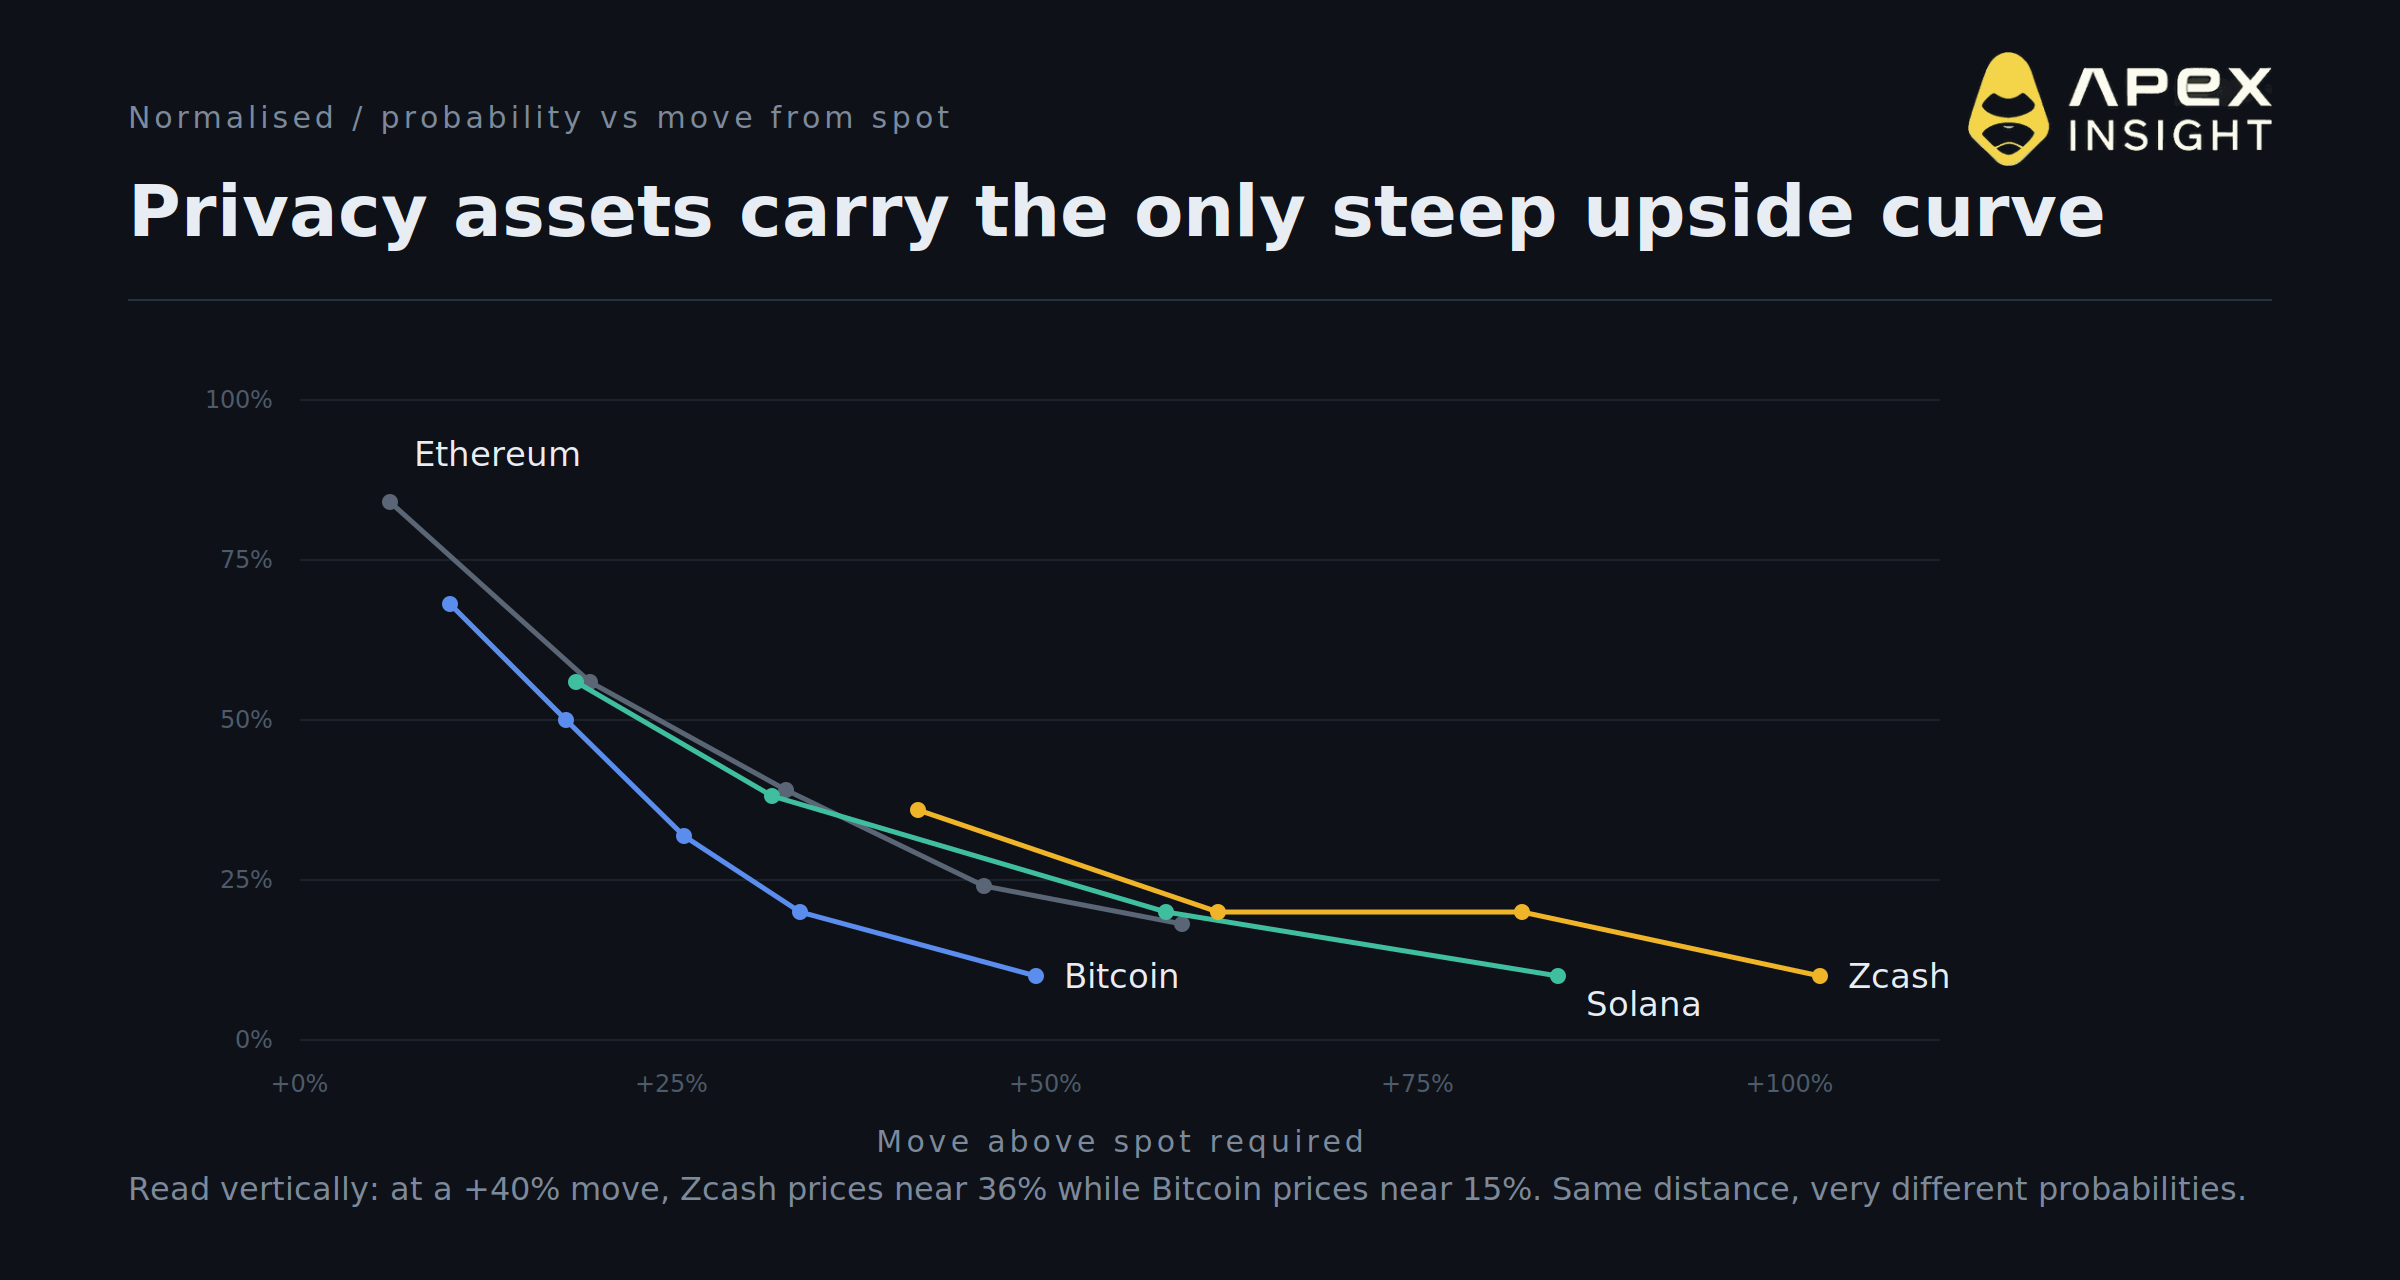
Zcash trades at $494.90. A touch of $700, roughly 41 percent above spot, prices at 36 percent. $1,000, about 102 percent above spot, prices at 10 percent. Monero reaching $1,000 from $404.85 prices at 8 percent.
Compare like for like. At a 40 percent move above spot, Zcash prices near 36 percent while Bitcoin prices near 15 percent. At a 100 percent move, Zcash still prices 10 percent while Bitcoin's equivalent is closer to 3 percent. The curve does not just sit higher, it decays more slowly, which is the signature of a market pricing a genuine regime possibility rather than drift.
This is the clearest divergence in the dataset. Whether it reflects regulatory expectations, supply dynamics or a rotation that has not yet reached mainstream coverage, the money is expressing it here before it appears anywhere else. If you take one actionable item from this piece, it is that the privacy ladder is the only place on the board where a large move is being priced as reasonably likely.
What this adds up to
The market is pricing a range-bound 2026 with a defined ceiling, no record highs, and equity exposure outperforming the entire asset class. On-chain data supports rather than contradicts that view, which removes the most common counterargument that markets are simply too pessimistic after a drawdown.
The two places worth further work are the Solana ladder, which prices a conventional centre for an asset with an unconventional realised distribution, and the privacy complex, which is the only part of the board where the shape of the curve implies a regime change rather than drift.
Everything above is a snapshot. The value is not in the levels, which will be stale within days. It is in the method: read the full distribution rather than the headline, normalise for spot before comparing assets, check whether volume is live or abandoned, and test the book against independent on-chain data before acting on it.
Where to watch it
Every ladder in this article is live on ApeX Omni, where Polymarket's order books are integrated directly: the same liquidity and the same settlement source, minus the KYC. The crypto board carries the full strike ladders rather than the headline binary, alongside all-time-high contracts, relative performance markets and margin-style distributions, and it shows the volume and recent move behind each level so you can tell a live book from an abandoned one.
We appreciate your continued support.
Published by ApeX. For informational and educational purposes only. Not investment advice, and not a forecast or endorsement of any outcome. Trading involves risk, including total loss.