




What an indicator actually is
A technical indicator is a calculation performed on past price (and sometimes volume) and plotted so you can read a specific feature of it. Two consequences follow from that one sentence, and they govern everything.
First, indicators are derived from price. They introduce no new information to the market; they are transforms of data you already have (CME Group). A stack of five indicators is not five witnesses, it is one witness, the price, restated five ways.
Second, indicators are lagging. Because they are built from past prices, they can only turn after the prices that feed them have already turned. They are, by construction, a step behind the market. That lag is not a flaw to be tuned away; it is baked into the arithmetic of averaging the past.
The three you will meet constantly:
Moving average (MA) is the average price over the last N periods, redrawn each bar. It smooths the noise to show the trend, and traders watch for a faster average crossing a slower one. It is the purest lagging indicator: an average of old prices.
RSI (Relative Strength Index), introduced by J. Welles Wilder in 1978, is a momentum oscillator scaled from 0 to 100 that compares the size of recent gains to recent losses. Readings above 70 are called overbought and below 30 oversold.
MACD (Moving Average Convergence Divergence), devised by Gerald Appel, is the difference between a fast and a slow exponential moving average, with a signal line on top; traders trade the crossover. It is, quite literally, two lagging averages subtracted from each other.
Watch an indicator lag
The lag is not subtle, and a moving-average crossover shows it cleanly.
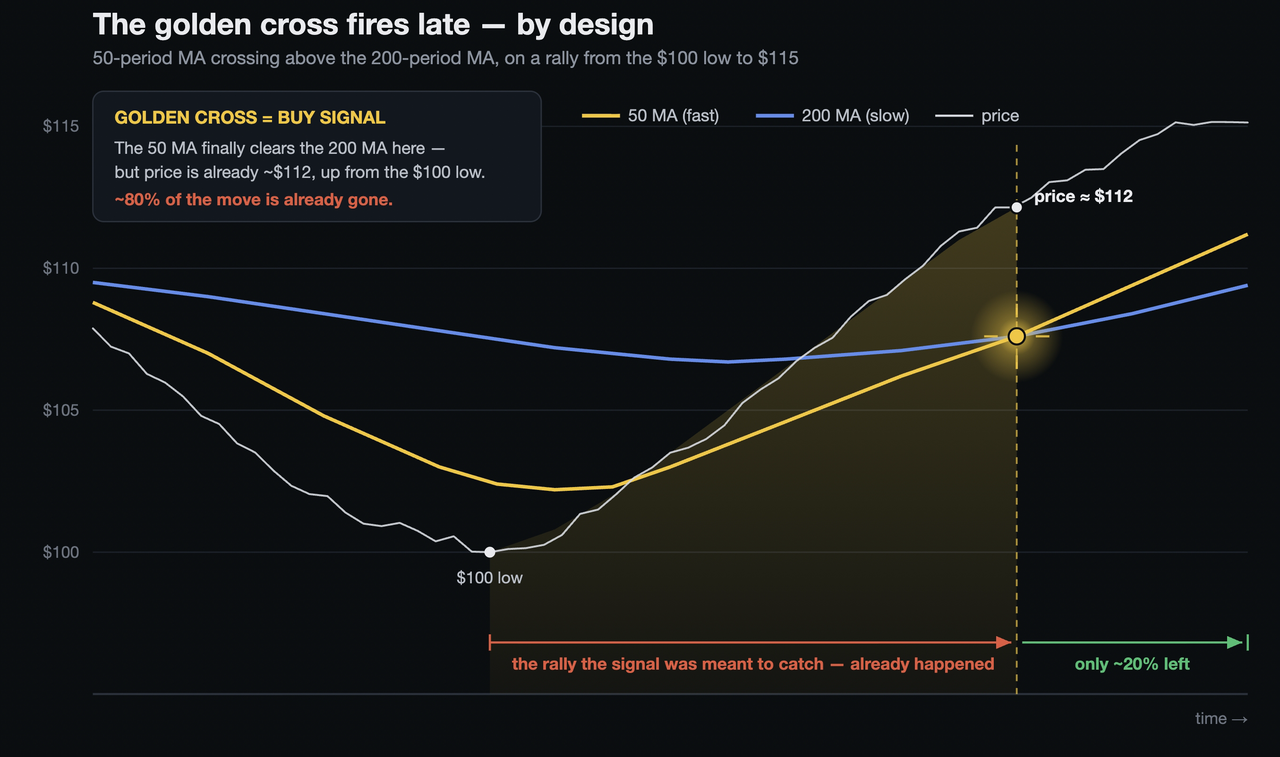
This is not a badly tuned setting. An average of the last fifty prices cannot rise until enough new, higher prices have already pushed it up, which by definition is after the rise is well underway. Every moving-average signal, and MACD is built from moving averages, inherits this delay. The indicator is telling you what the price already told you, with a lag you paid for in the move you missed. Used as a description of trend, that is fine. Used as a trigger, it is chronically late.
Do they actually work? What the testing shows
Indicators are among the most tested ideas in finance, and the record is a cautionary tale about the difference between a backtest and an edge.
The optimistic data point is real. In a landmark 1992 study, Brock, Lakonishok and LeBaron tested simple moving-average and trading-range rules on the Dow from 1897 to 1986 and found they beat a buy-and-hold strategy (Brock, Lakonishok & LeBaron, 1992). For a while that was taken as proof the indicators worked.
Then the same data got a harder look. Sullivan, Timmermann and White re-ran the exercise across roughly 8,000 rule variations over a full century of daily data and showed the apparent edge shrinks substantially once you correct for data-snooping, the simple fact that if you test thousands of rules, some will look brilliant by pure chance (Sullivan, Timmermann & White, 1999). Layer in real transaction costs, which the pretty backtests routinely ignore, and the profit thins further. The honest reading of the literature is not "indicators never work," it is "the edge in a simple indicator rule is smaller and less certain than any backtest suggests, and much of it is the residue of trying enough rules."
This is exactly what you should expect from the "91% win rate" strategies sold online. A high win rate is not profit; a rule that wins small ninety times and loses big ten times is a losing rule, as the expectancy maths from the finale showed. And a strategy tuned until its backtest sparkles is usually not a discovery, it is data-snooping with a marketing page. The indicator that looks perfect on history is the one most likely to have been fitted to it.
Reputation versus evidence
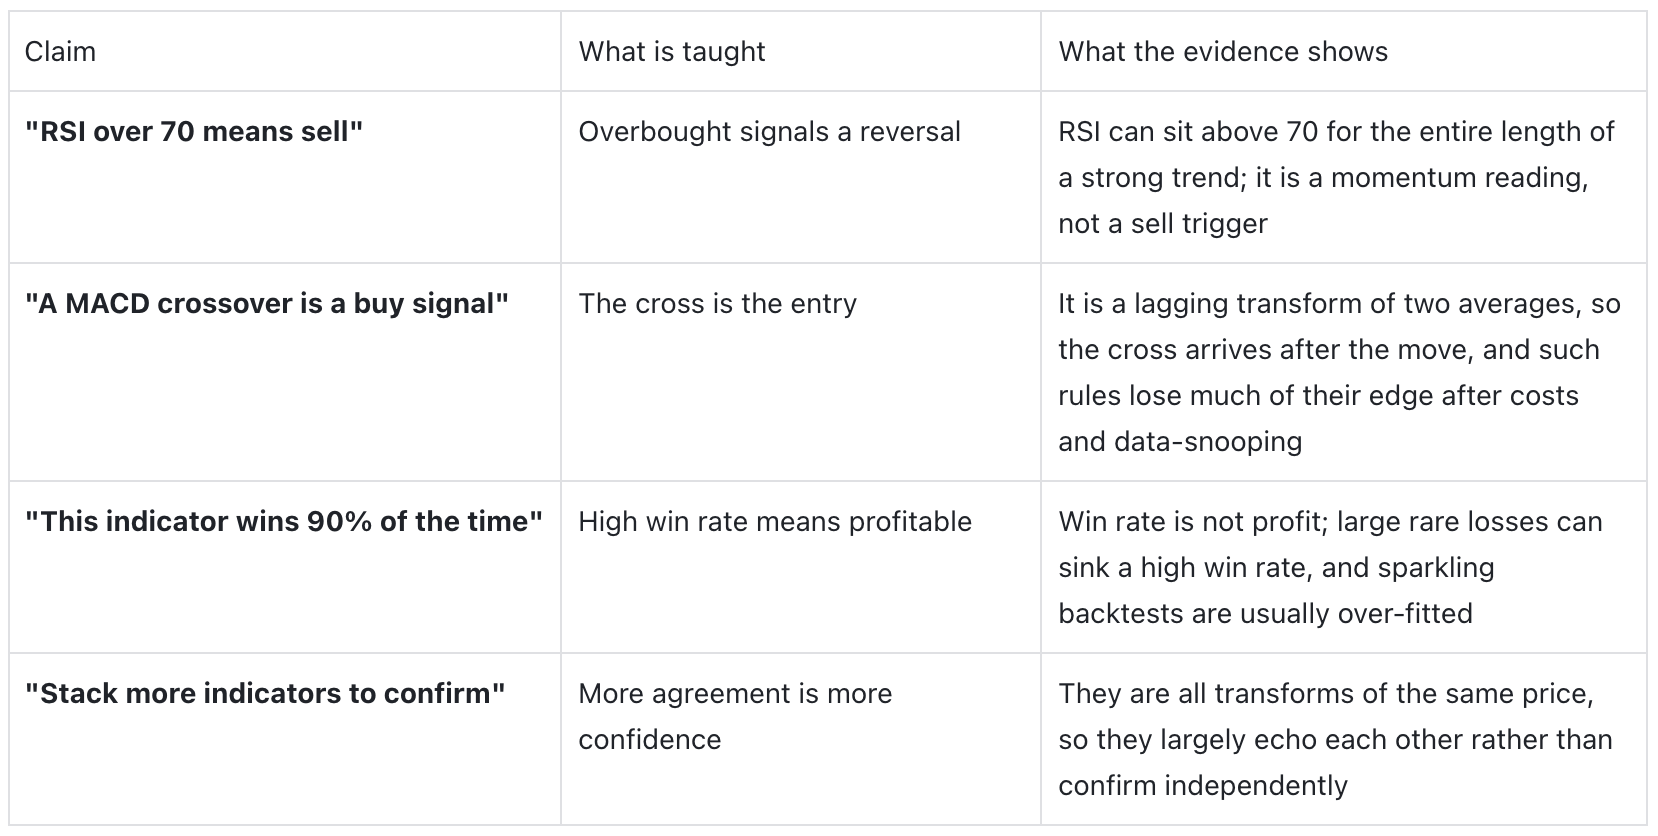
That last row is the one most traders never hear. Confluence between five indicators feels like five confirmations, but since all five are computed from the same price, they are not independent evidence; they are the same information wearing different costumes. Genuine confluence comes from independent things agreeing, a level, a trend, and volume, not from RSI and MACD, which are close cousins by construction.
Using indicators honestly
Treat them as descriptions, not signals. A moving average is a clean way to see the trend; RSI is a clean way to gauge momentum. Read them for what they summarise, not as commands to buy or sell.
Do not mechanise a single line. "RSI hit 70, so short" ignores that momentum can stay hot for weeks. The reading is context, not a trigger.
Prefer one or two, not twenty. Because indicators repeat the price, a cluttered chart is not more informed, just more crowded. Pick a trend read and a momentum read and stop.
Watch divergence with caution. Price making a new high while RSI does not is a genuinely interesting tell of fading momentum, but it is a heads-up to pay attention, not a standalone entry, and it can persist.
Cost every rule and doubt every backtest. If a strategy's edge disappears once you add realistic fees, it was never an edge. If it was optimised to look great on history, assume it was fitted.
Common mistakes
Trading a line mechanically - "cross means buy" ignores the lag baked into the average.
Confusing win rate with profit - the metric that matters is expectancy, not how often you are right.
Indicator soup - twenty indicators on one chart is one price restated twenty times, not twenty signals.
Trusting the perfect backtest - the strategy that fits history flawlessly is usually curve-fitted and fails live.
Forgetting indicators lag - by the time the signal prints, the move it describes is often mostly done.
Indicators on ApeX Omni
The charts on ApeX Omni carry the full set of standard indicators, RSI, MACD, moving averages and the rest, alongside the price action the earlier parts of this series taught you to read. The honest way to use them is as a second lens on the same picture: let a moving average clarify the trend and RSI gauge momentum, then make the decision on structure, levels and volume, the independent evidence, rather than on an indicator crossover alone. An indicator is a good servant and a poor master, and on a perps DEX where leverage magnifies every mistimed entry, treating a lagging line as a signal is an expensive habit. Trade the chart on ApeX Omni with indicators as context, not gospel.
The bottom line
Indicators are not gauges reading a hidden market; they are formulas rearranging the price already in front of you, and they always report a step late. RSI, MACD and moving averages each make one feature of price, its momentum or its trend, easier to see, and that is a real, modest use. What the evidence will not support is the way they are sold: the mechanical signals, the stacked confirmations, the miraculous win rates. Simple indicator rules that looked profitable on paper mostly faded once costs and data-snooping were taken seriously. Read indicators as descriptions of the chart, lean on independent evidence for your decisions, and remember that no transform of the price can tell you something the price has not already said.
Frequently asked questions
Do technical indicators actually work? They describe features of price, like trend and momentum, usefully, but the tested edge of simple indicator trading rules is small and largely disappears after transaction costs and after correcting for the thousands of rules people test. Treat them as context, not as reliable buy and sell signals.
Are RSI and MACD leading or lagging indicators? Both are lagging. They are calculated from past prices, so they turn only after the prices that feed them have turned. They confirm a move more than they predict one.
Does RSI over 70 mean I should sell? Not on its own. RSI above 70 means momentum is strong, and it can stay there for the whole of a powerful trend. It is a reading to interpret in context, not an automatic sell signal.
Which indicator is the most accurate? None is reliably accurate as a standalone signal, because all indicators are transforms of the same price and none adds new information. Combining a trend read and a momentum read with independent evidence, levels and volume, beats hunting for one perfect indicator.
Why do my indicator signals arrive late? Because indicators average past prices, so they can only move after enough new prices have. This lag is built into the maths and cannot be tuned away, only traded around.
Is a strategy with a 90% win rate a good one? Not necessarily. Win rate is not profitability; a rule that wins often but small and loses rarely but large can still lose money. Judge a strategy by its expectancy and whether its edge survives real costs.
Explore more from this series: Part 5: Trend and Trendlines | Part 8: Putting It All Together | Part 11: Mark, Index and Basis | Part 12: Order Types
This article is for educational and informational purposes only and is not financial, investment, or legal advice. Do your own research before making any trading decision.