




Note: All market prices and spot figures are as of 26 August 2026. The daily and weekly books resolve within days, so the near-term numbers move fastest. The 2026 ladder is the one worth returning to.
1. The year's coin flip is $90,000
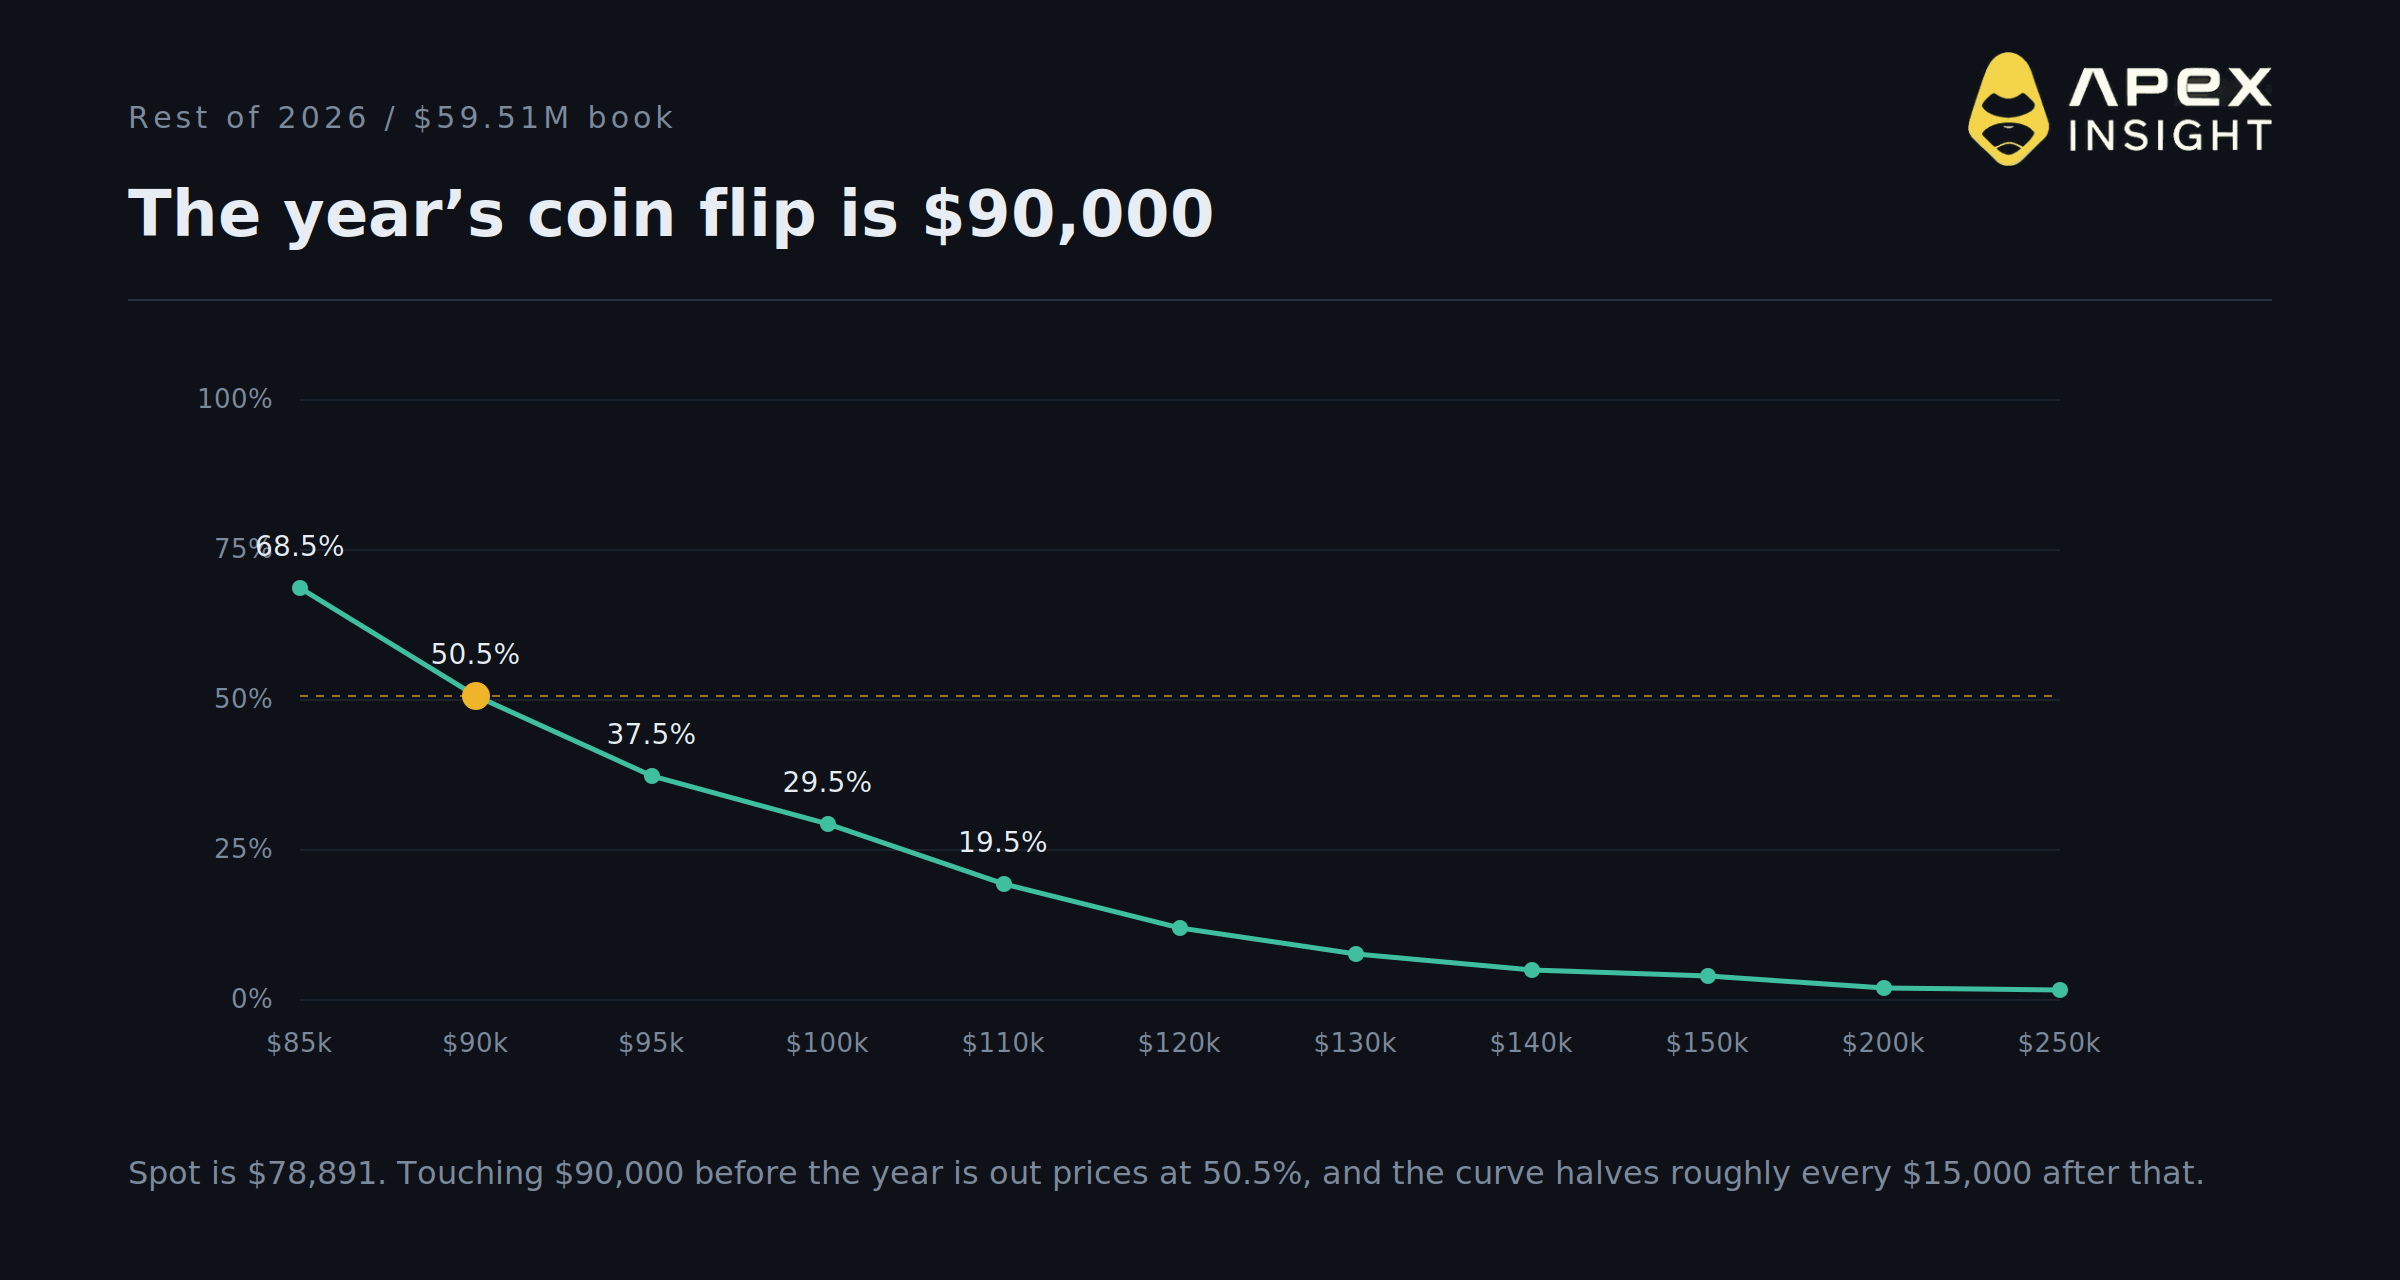
The 2026 touch ladder carries $59.51M, making it the deepest forward-looking book on the board. Touching $85,000 before year end prices at 68.5 percent. $90,000 sits at 50.5 percent, which is as close to even money as the ladder gets.
Above that: $95,000 at 37.5 percent, $100,000 at 29.5 percent, $110,000 at 19.5 percent, $120,000 at 12 percent, $130,000 at 7.7 percent and $150,000 at 3.9 percent.
The shape matters as much as any single point. Probability roughly halves for every $15,000 of additional upside, which is a smooth decay rather than a cliff. Markets that expect a regime change usually show a second hump further out, because a break above a key level implies a much wider range beyond it. This curve does not have one.
2. Six figures against a new low
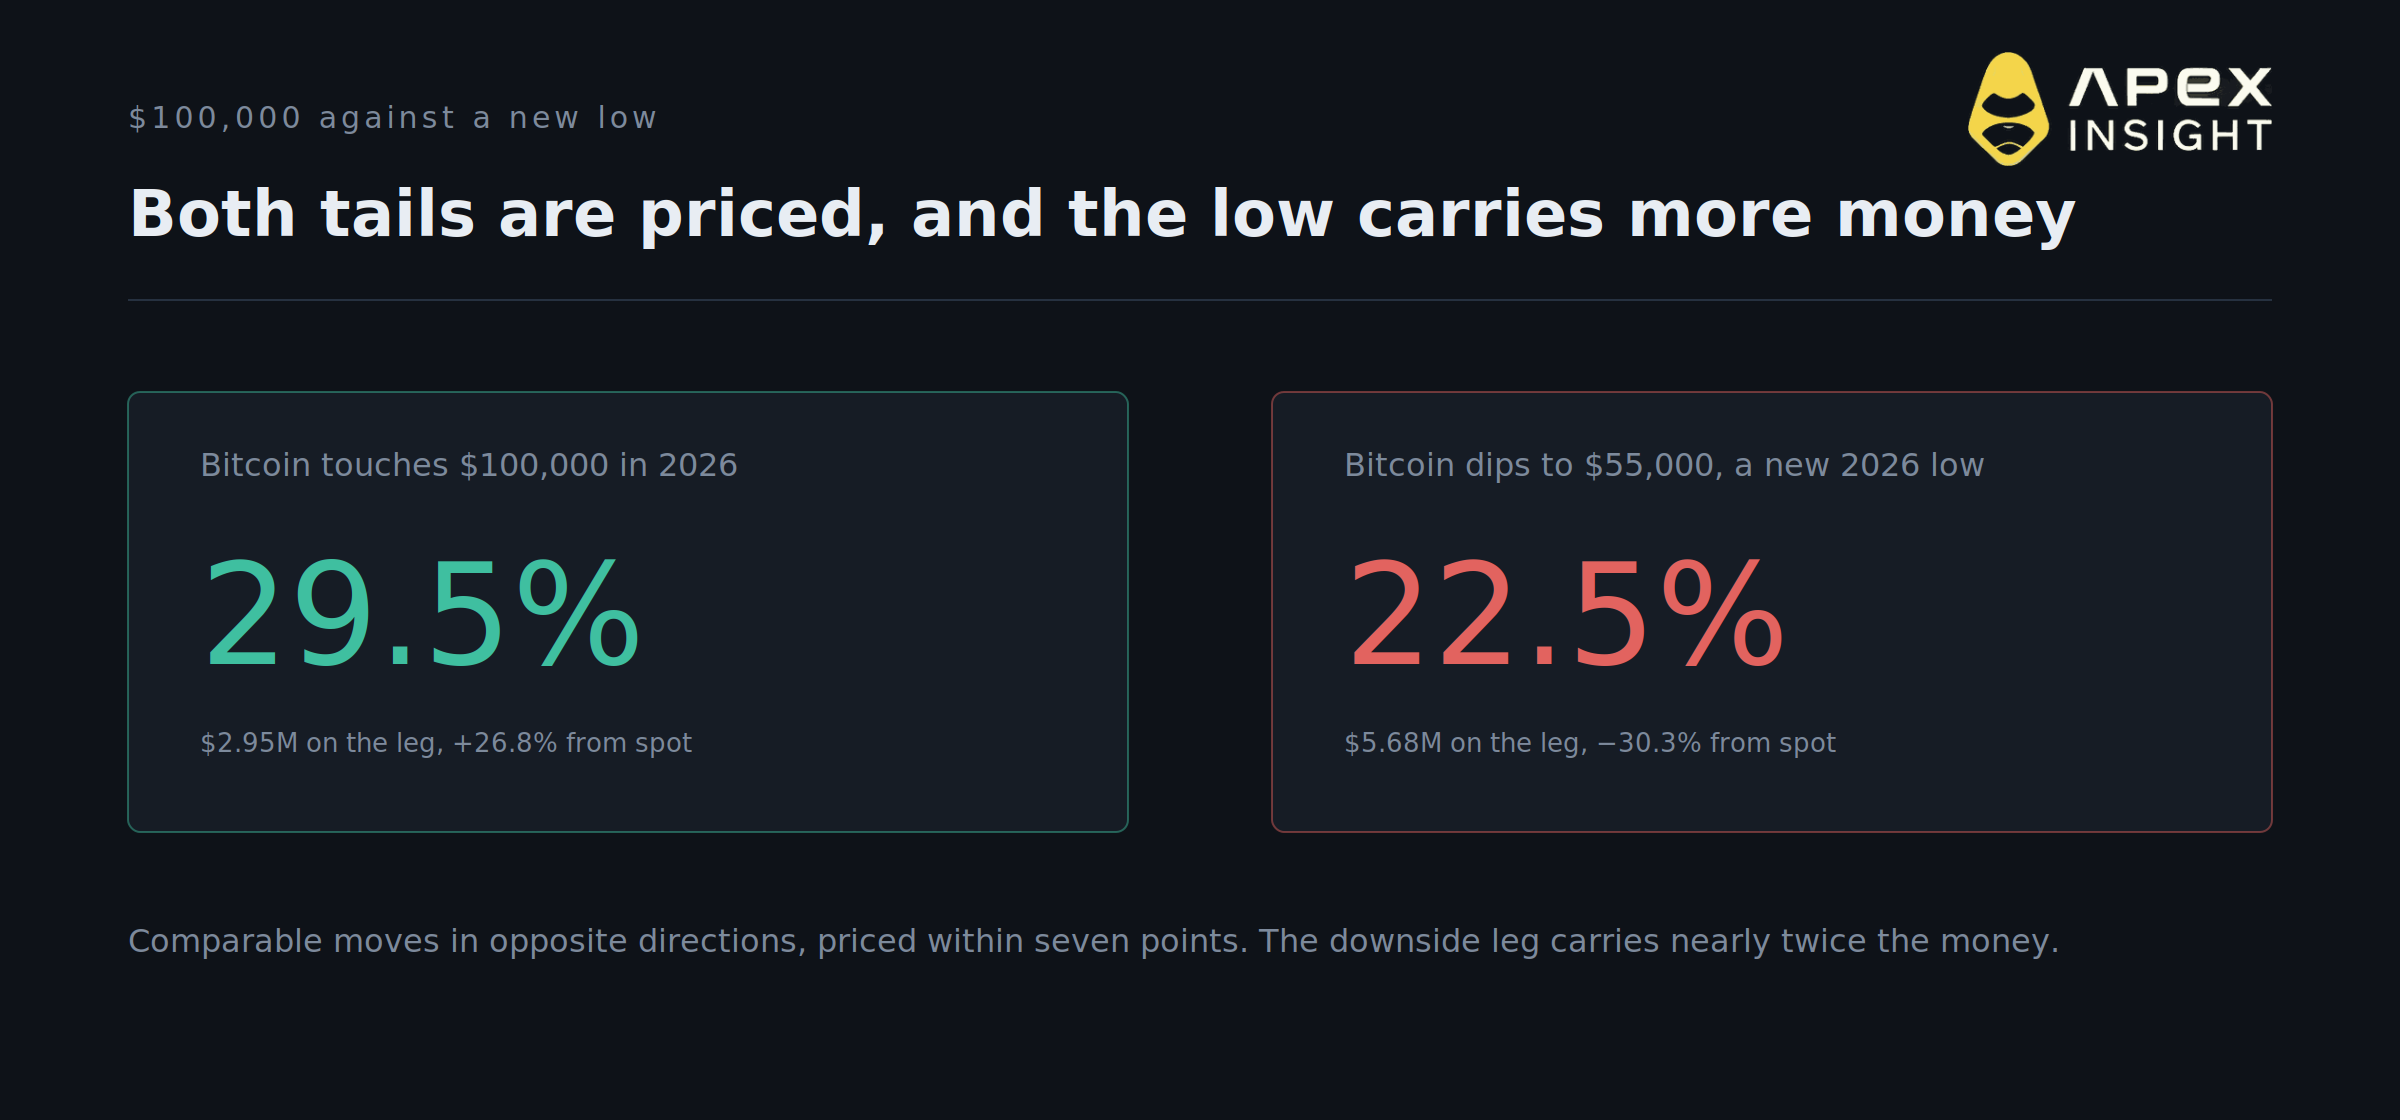
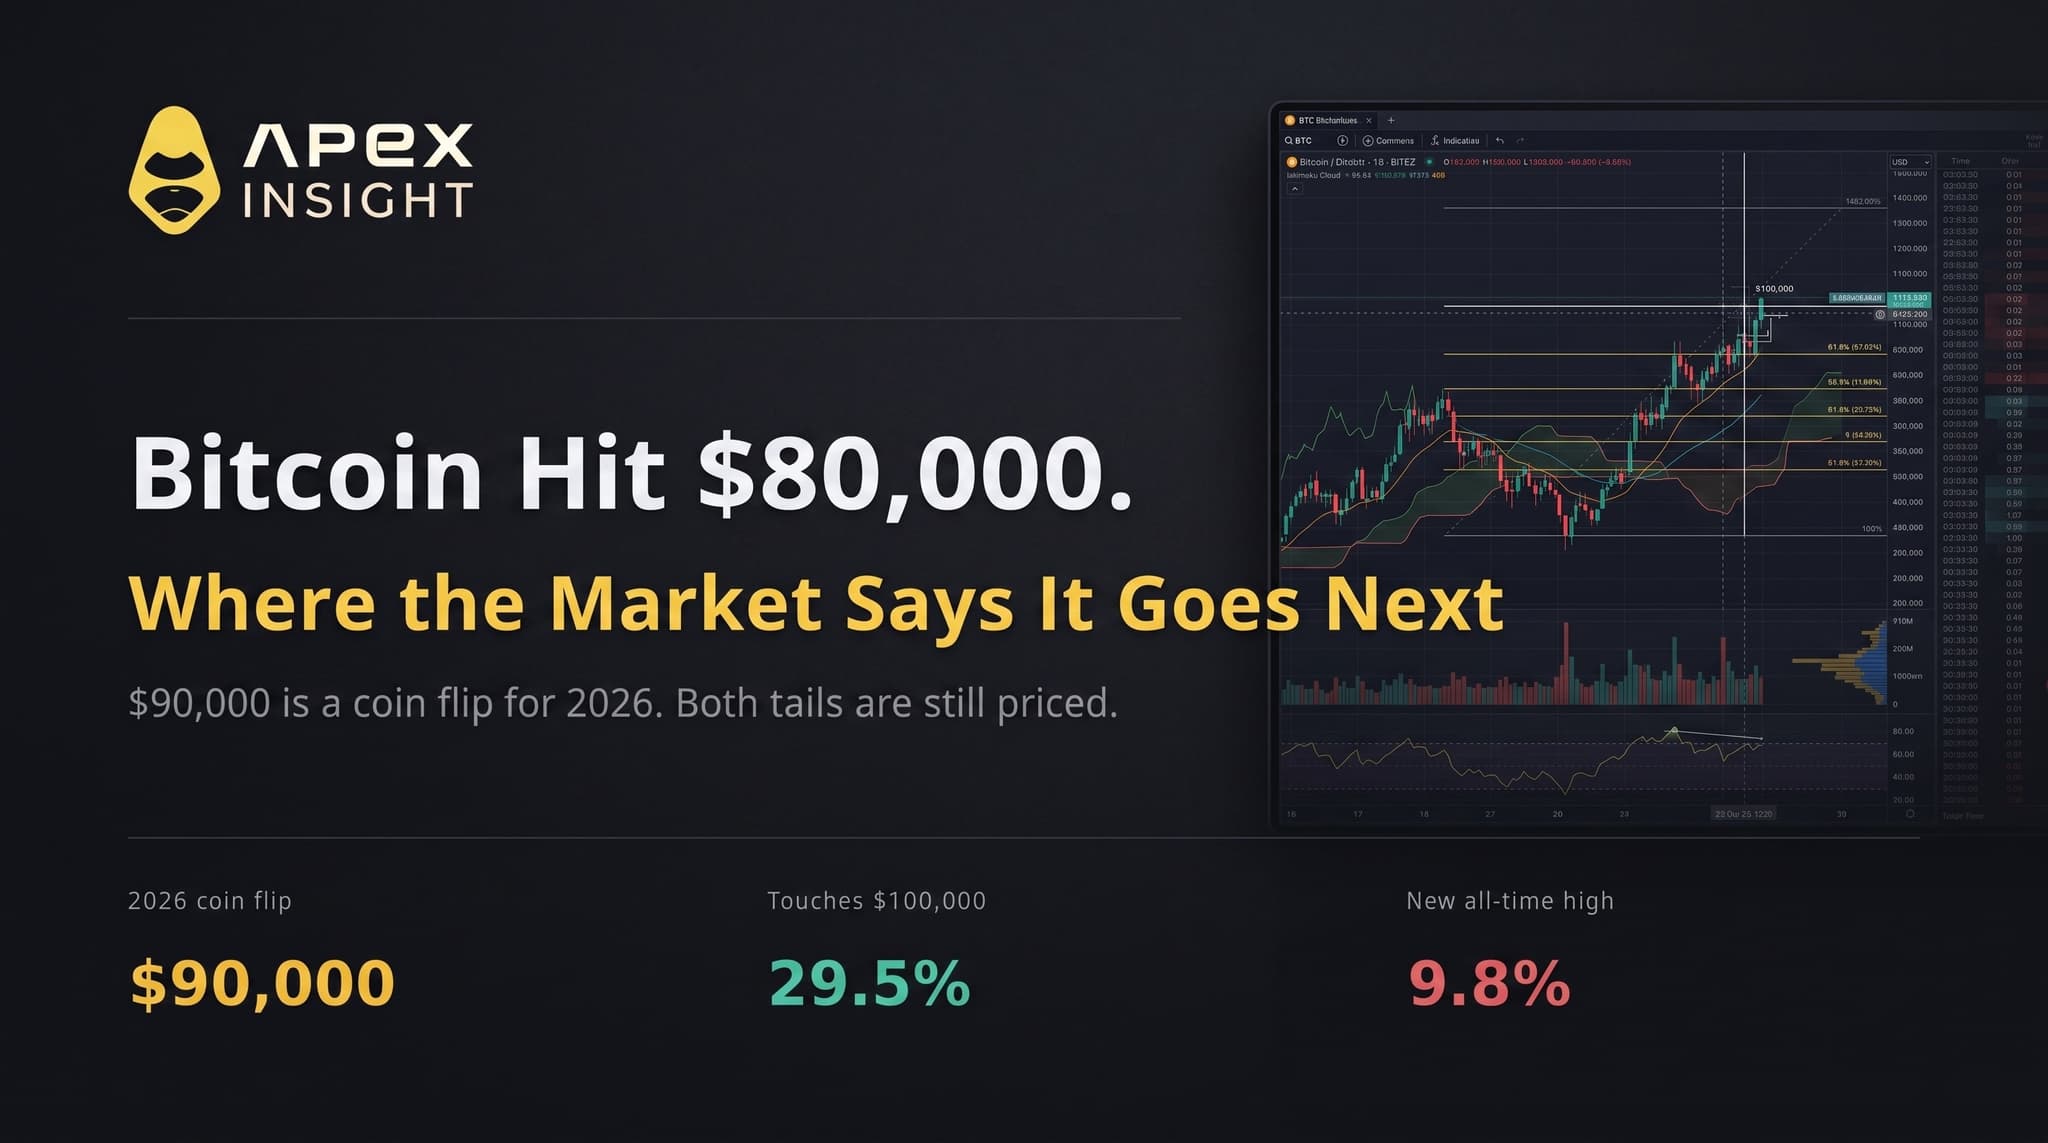
Bitcoin touching $100,000 at any point in 2026 prices at 29.5 percent on $2.95M. That is a 26.8 percent move up from spot.
Bitcoin dipping to $55,000 prices at 22.5 percent, on $5.68M. That is a 30.3 percent move down, and it would be a new low for the year.
Two moves of broadly comparable size in opposite directions, priced within seven points of each other. Whatever narrative you hold about the rest of the year, the board is not leaning hard. It is pricing meaningful probability on both tails after a spot price that has already run 24 percent in a fortnight.
One caution on this book, because it matters for anything you act on. Three separate legs carry the identical question "will Bitcoin dip to $60,000 by December 31, 2026." Two price at 100 percent and one prices at 29.5 percent with $499K behind it. Bitcoin's 2026 low was $58,566 on 1 July, so the correct answer is 100 and the 29.5 is a stale quote that has not been cleaned up. Check the leg, not just the strike.
3. The retrace is still live
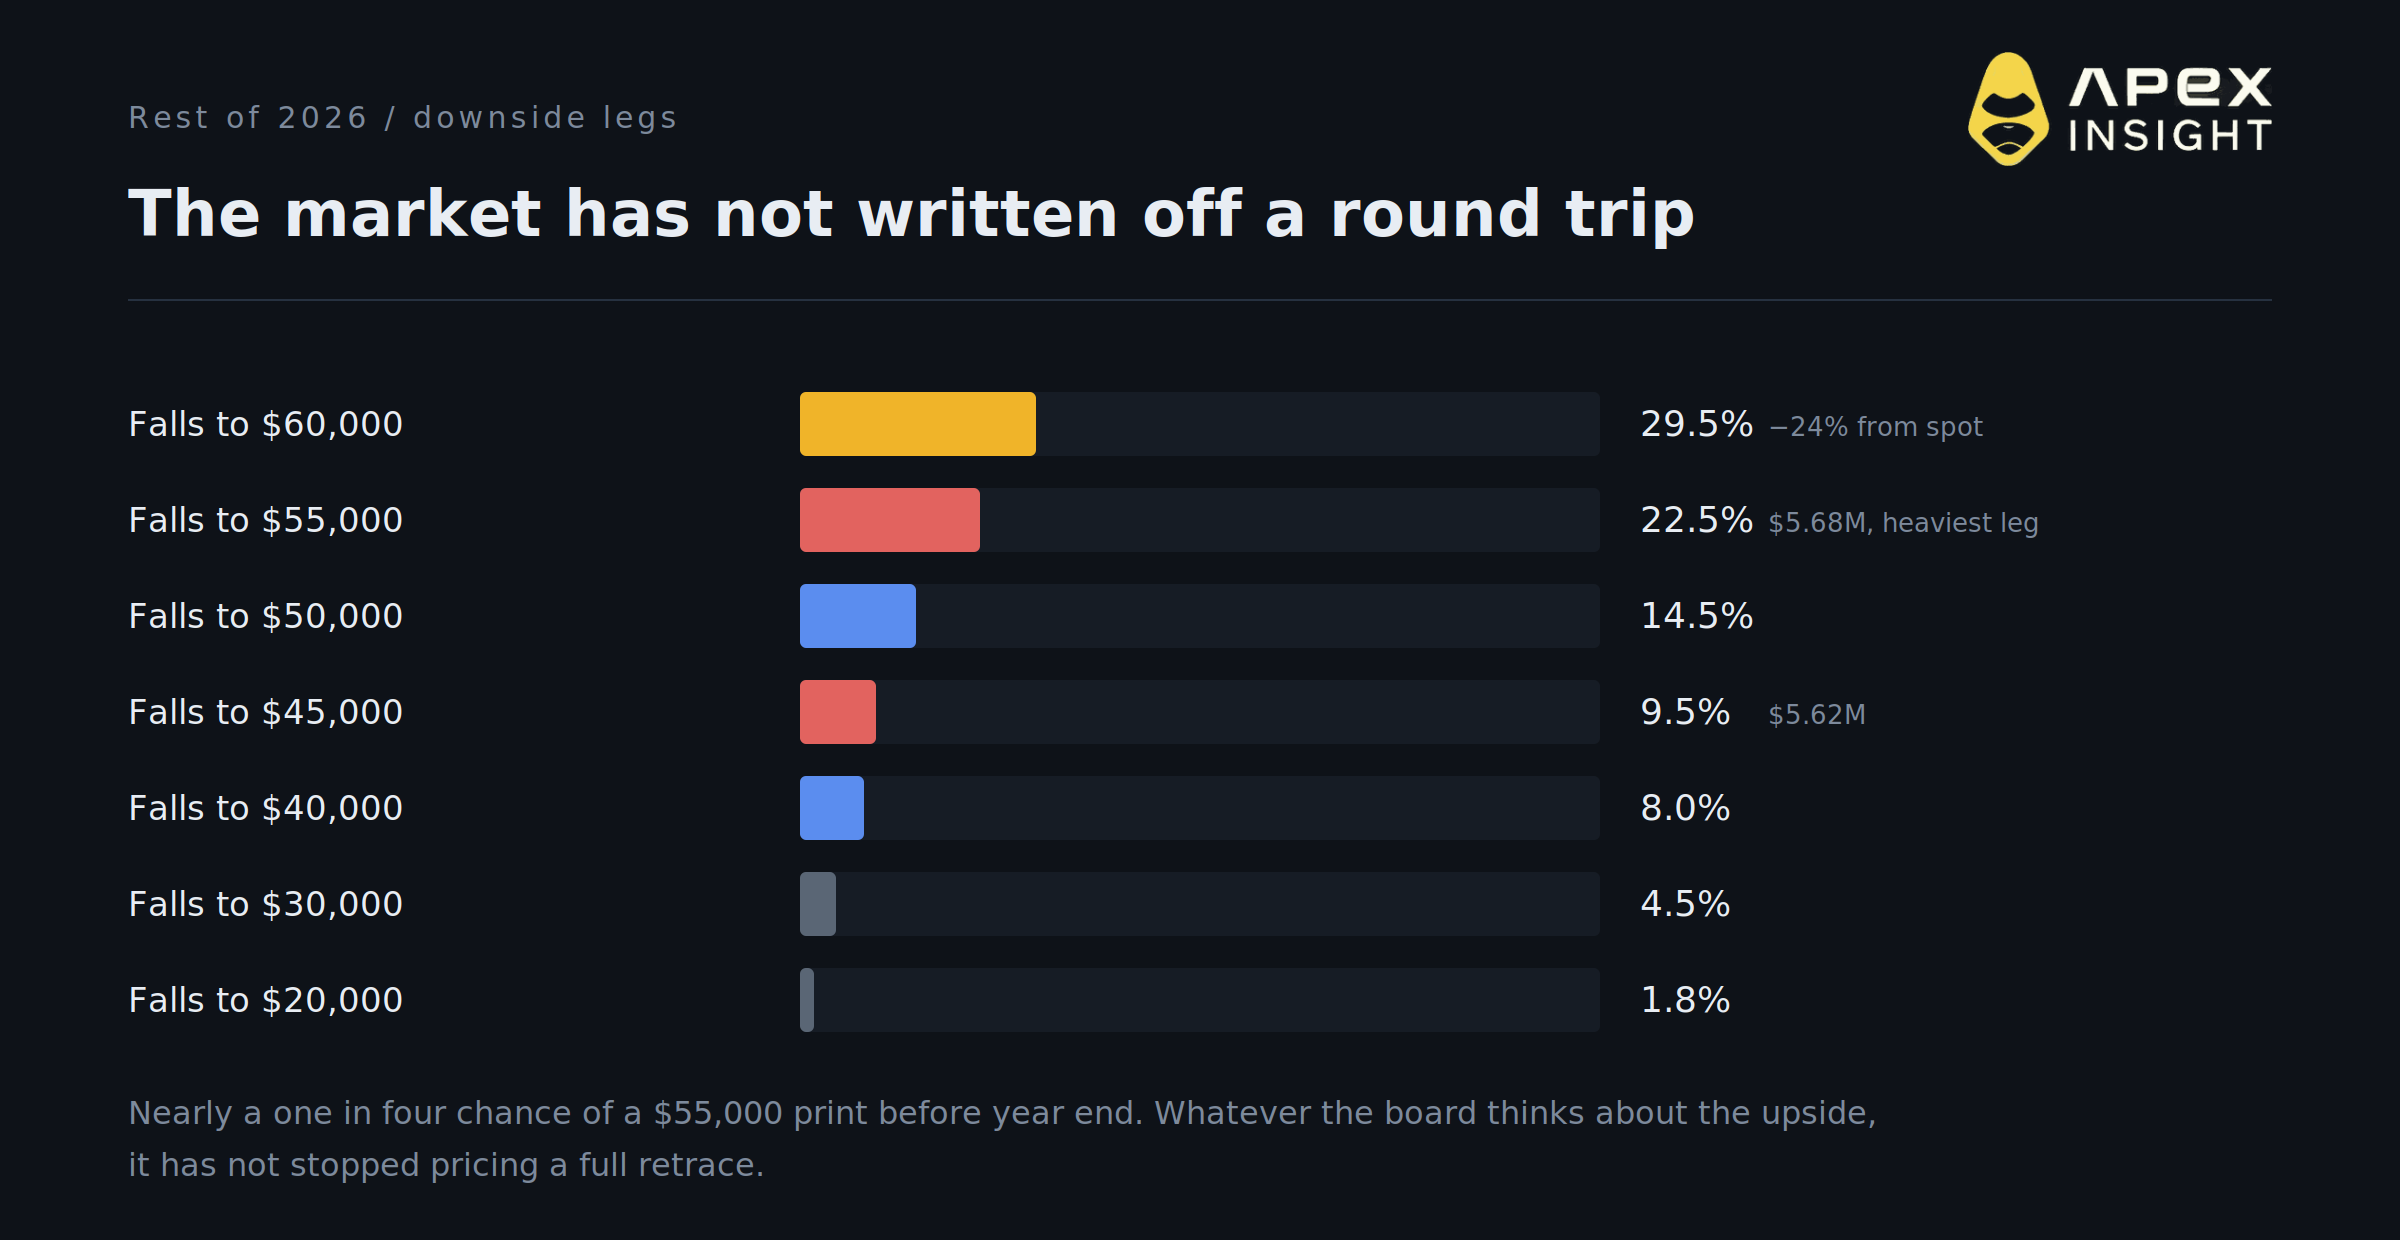
Every downside level above the July low has already printed this year, so those contracts are settled. The live question starts below it: $55,000 prices at 22.5 percent, $50,000 at 14.5 percent, $45,000 at 9.5 percent and $40,000 at 8 percent.
Close to one chance in four that Bitcoin makes a new low before the year is out. That is not a fringe scenario on this board, and it sits alongside a 50.5 percent chance of $90,000 without contradiction, because both are touch contracts and a volatile year can satisfy both.
If you take one structural point from this article, it is that: the ladder is not forecasting a path, it is pricing how far price travels in each direction at some point along the way.
4. The record trade is back on the board
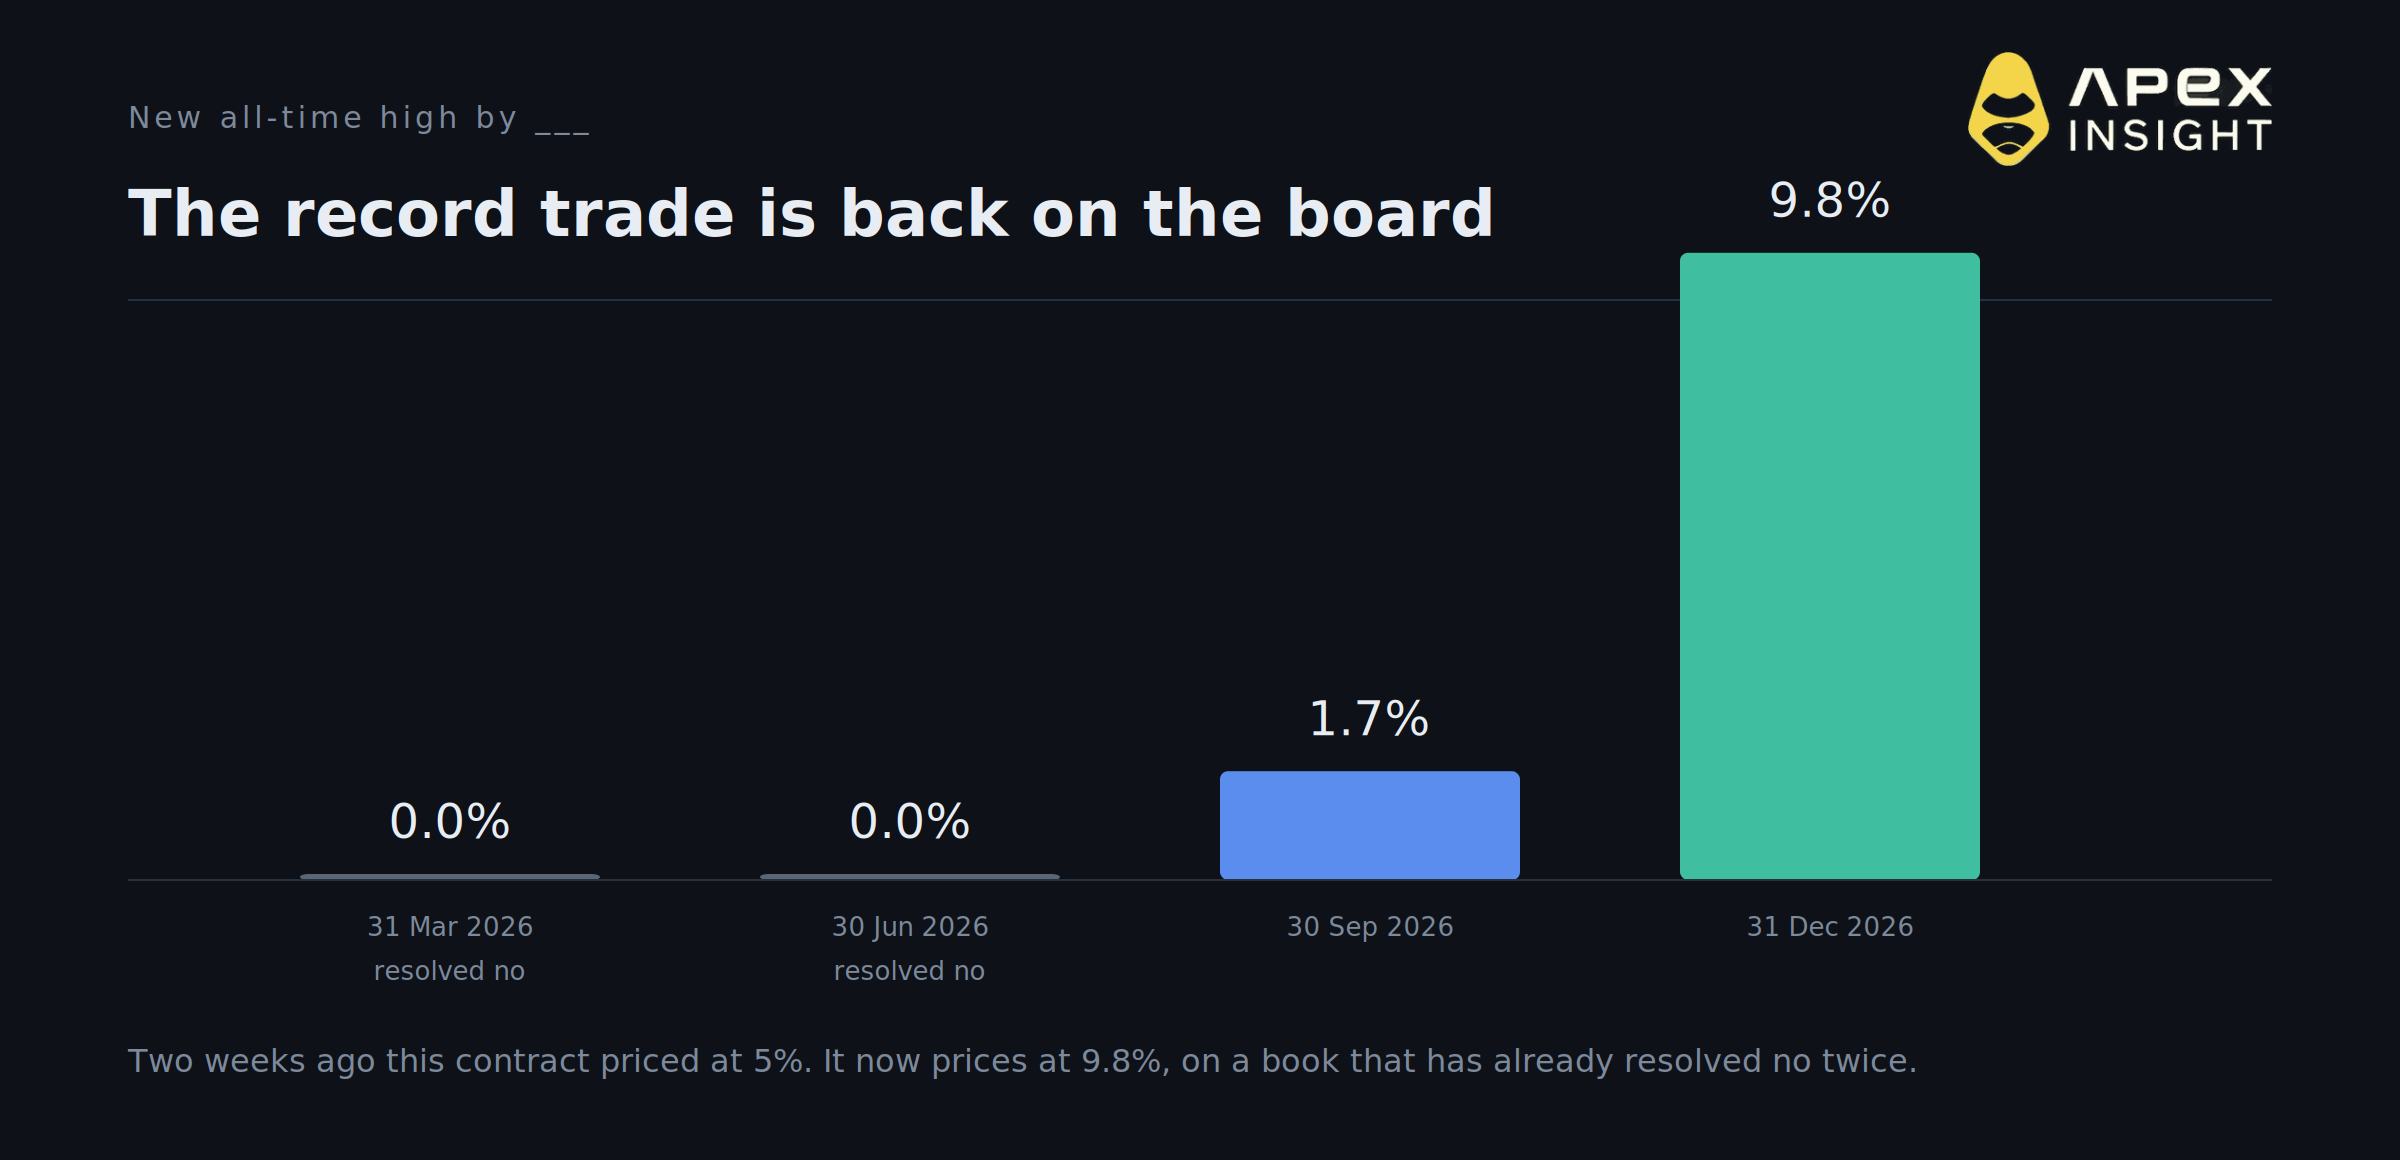
A new all-time high by 31 March resolved no. By 30 June, no. By 30 September it prices at 1.7 percent. By 31 December it prices at 9.8 percent.
Two weeks ago that December contract priced at 5 percent. It has nearly doubled while spot rose 24 percent, which is the market repricing rather than a narrative catching up.
It is still a tail. But a contract that has resolved no twice and is now rising again is a different object from one that has been dead all year, and it is worth watching as the clearest single read on whether the cycle top is genuinely behind us.
5. Four months buys about $11,000 of upside
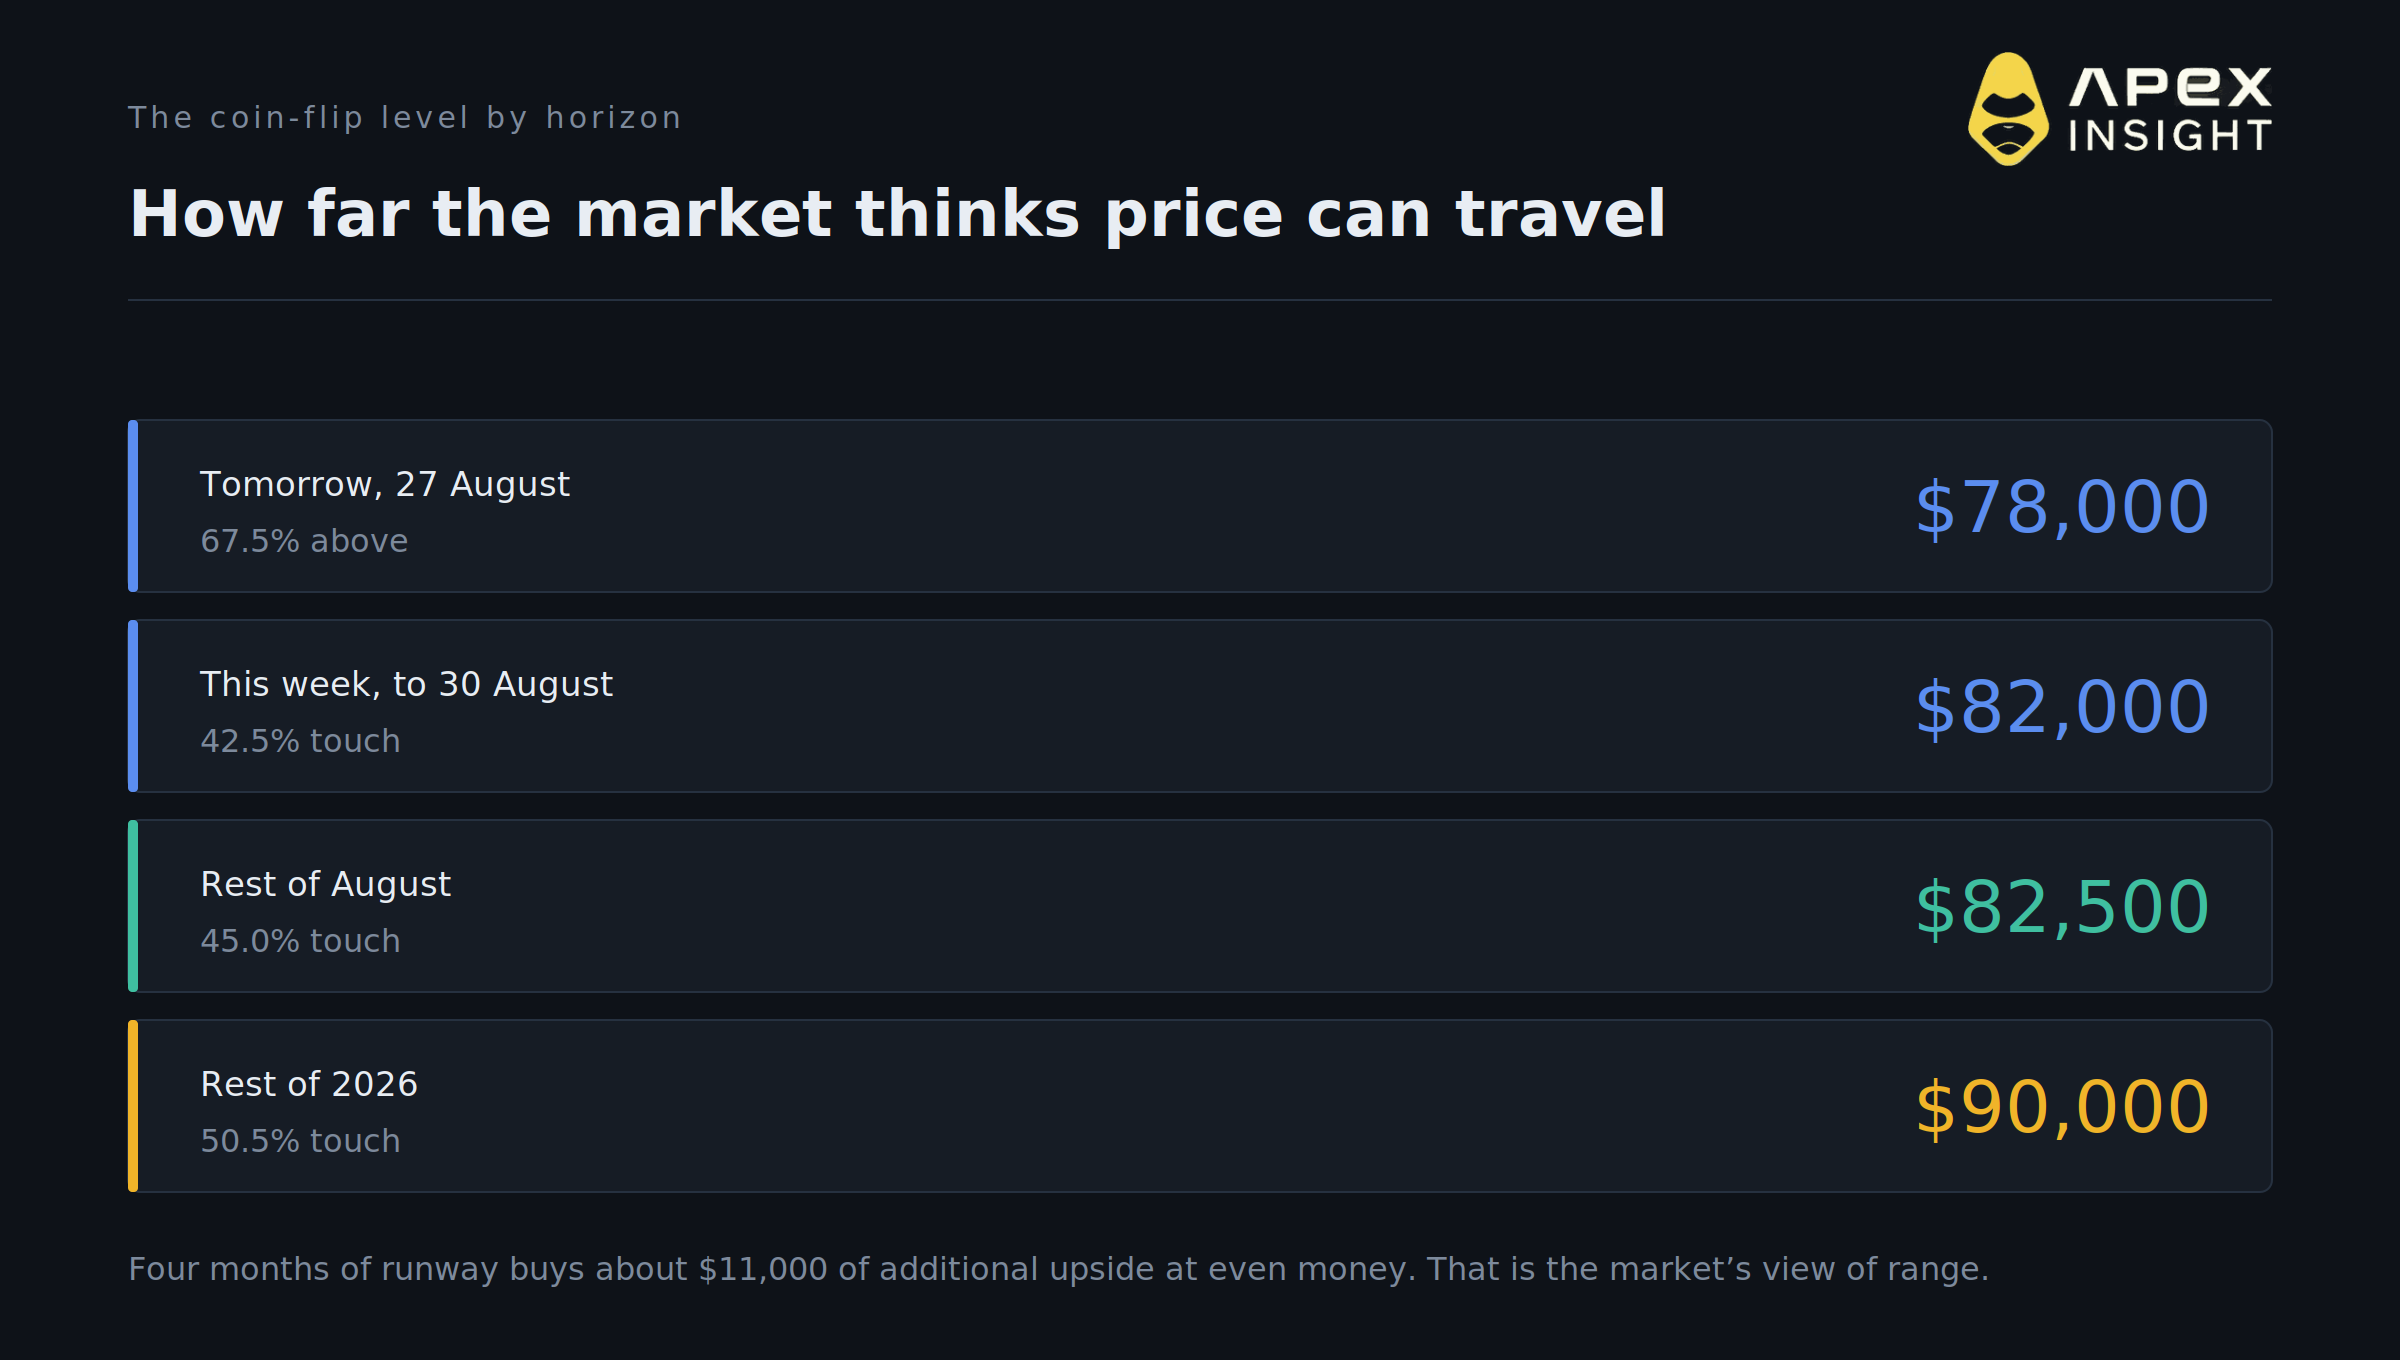
Reading the same question across horizons gives you the market's view of range directly.
For tomorrow's close, above $78,000 prices at 67.5 percent. For this week, touching $82,000 prices at 42.5 percent. For the rest of August, $82,500 at 45 percent. For the rest of 2026, $90,000 at 50.5 percent.
Four months of additional runway buys roughly $11,000 of extra upside at even money. That is a compact statement of how much movement the market expects, and it is the number to check any price target against. A call for $150,000 by December is a call against a 3.9 percent contract on a $59M book.
6. Check whether you are reading a touch or a settle
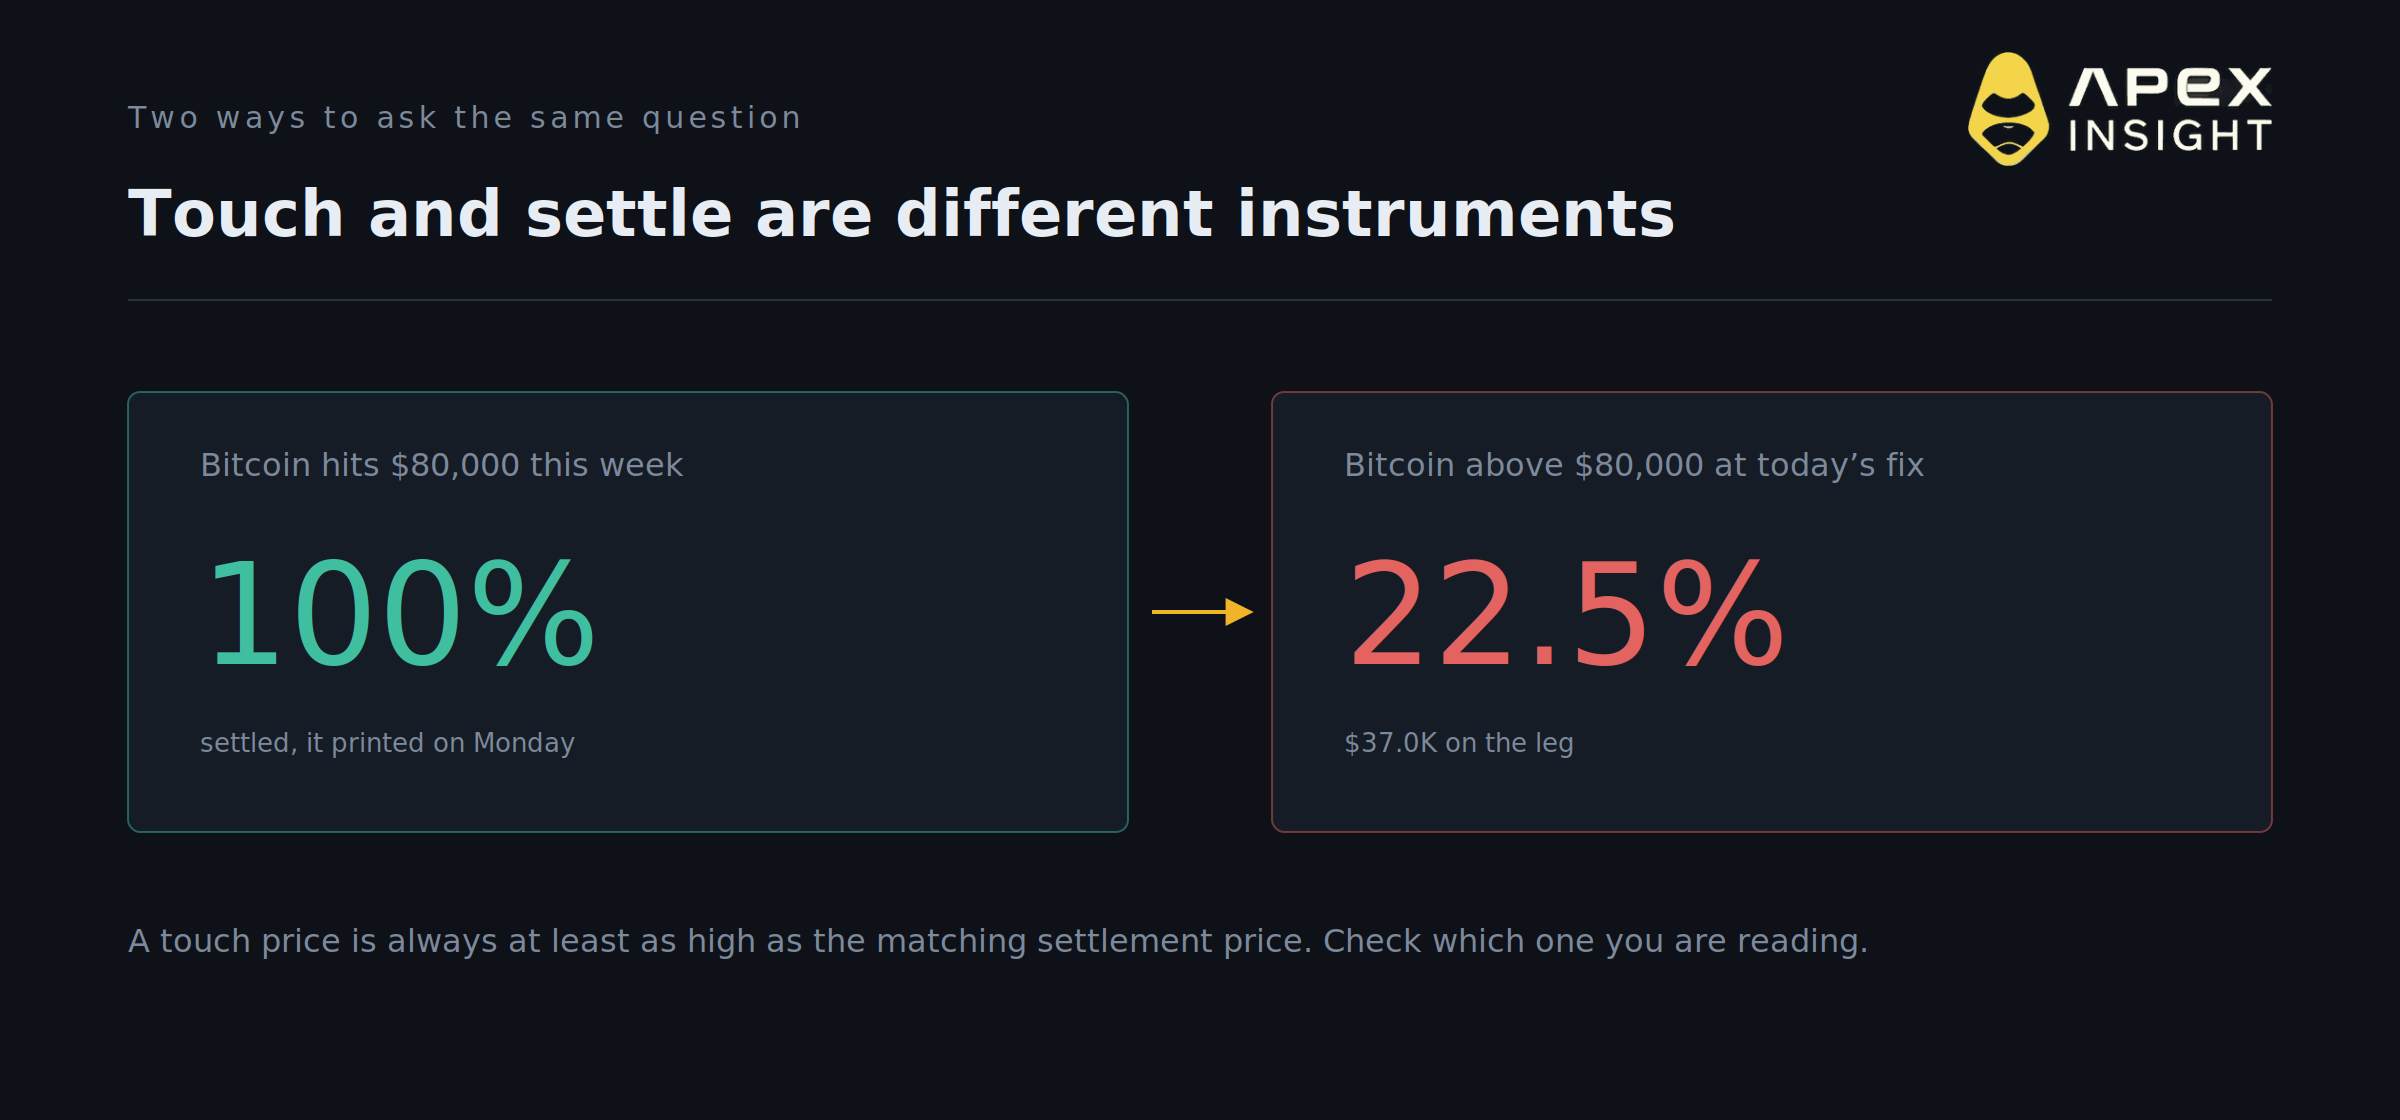
One mechanic will trip you up if you skip it. Touch markets ask whether a level prints at any moment in the window. Settlement markets ask where price sits at one fixed time.
$80,000 this week is settled at 100 percent, because it printed on Monday. $80,000 at today's fix prices at 22.5 percent. Same level, same week, and the gap is the full distance between the two instruments.
Every number in points 1 through 5 above is a touch price. Read them as how far price travels, not where it lands.
7. The $150,000 thesis emptied out
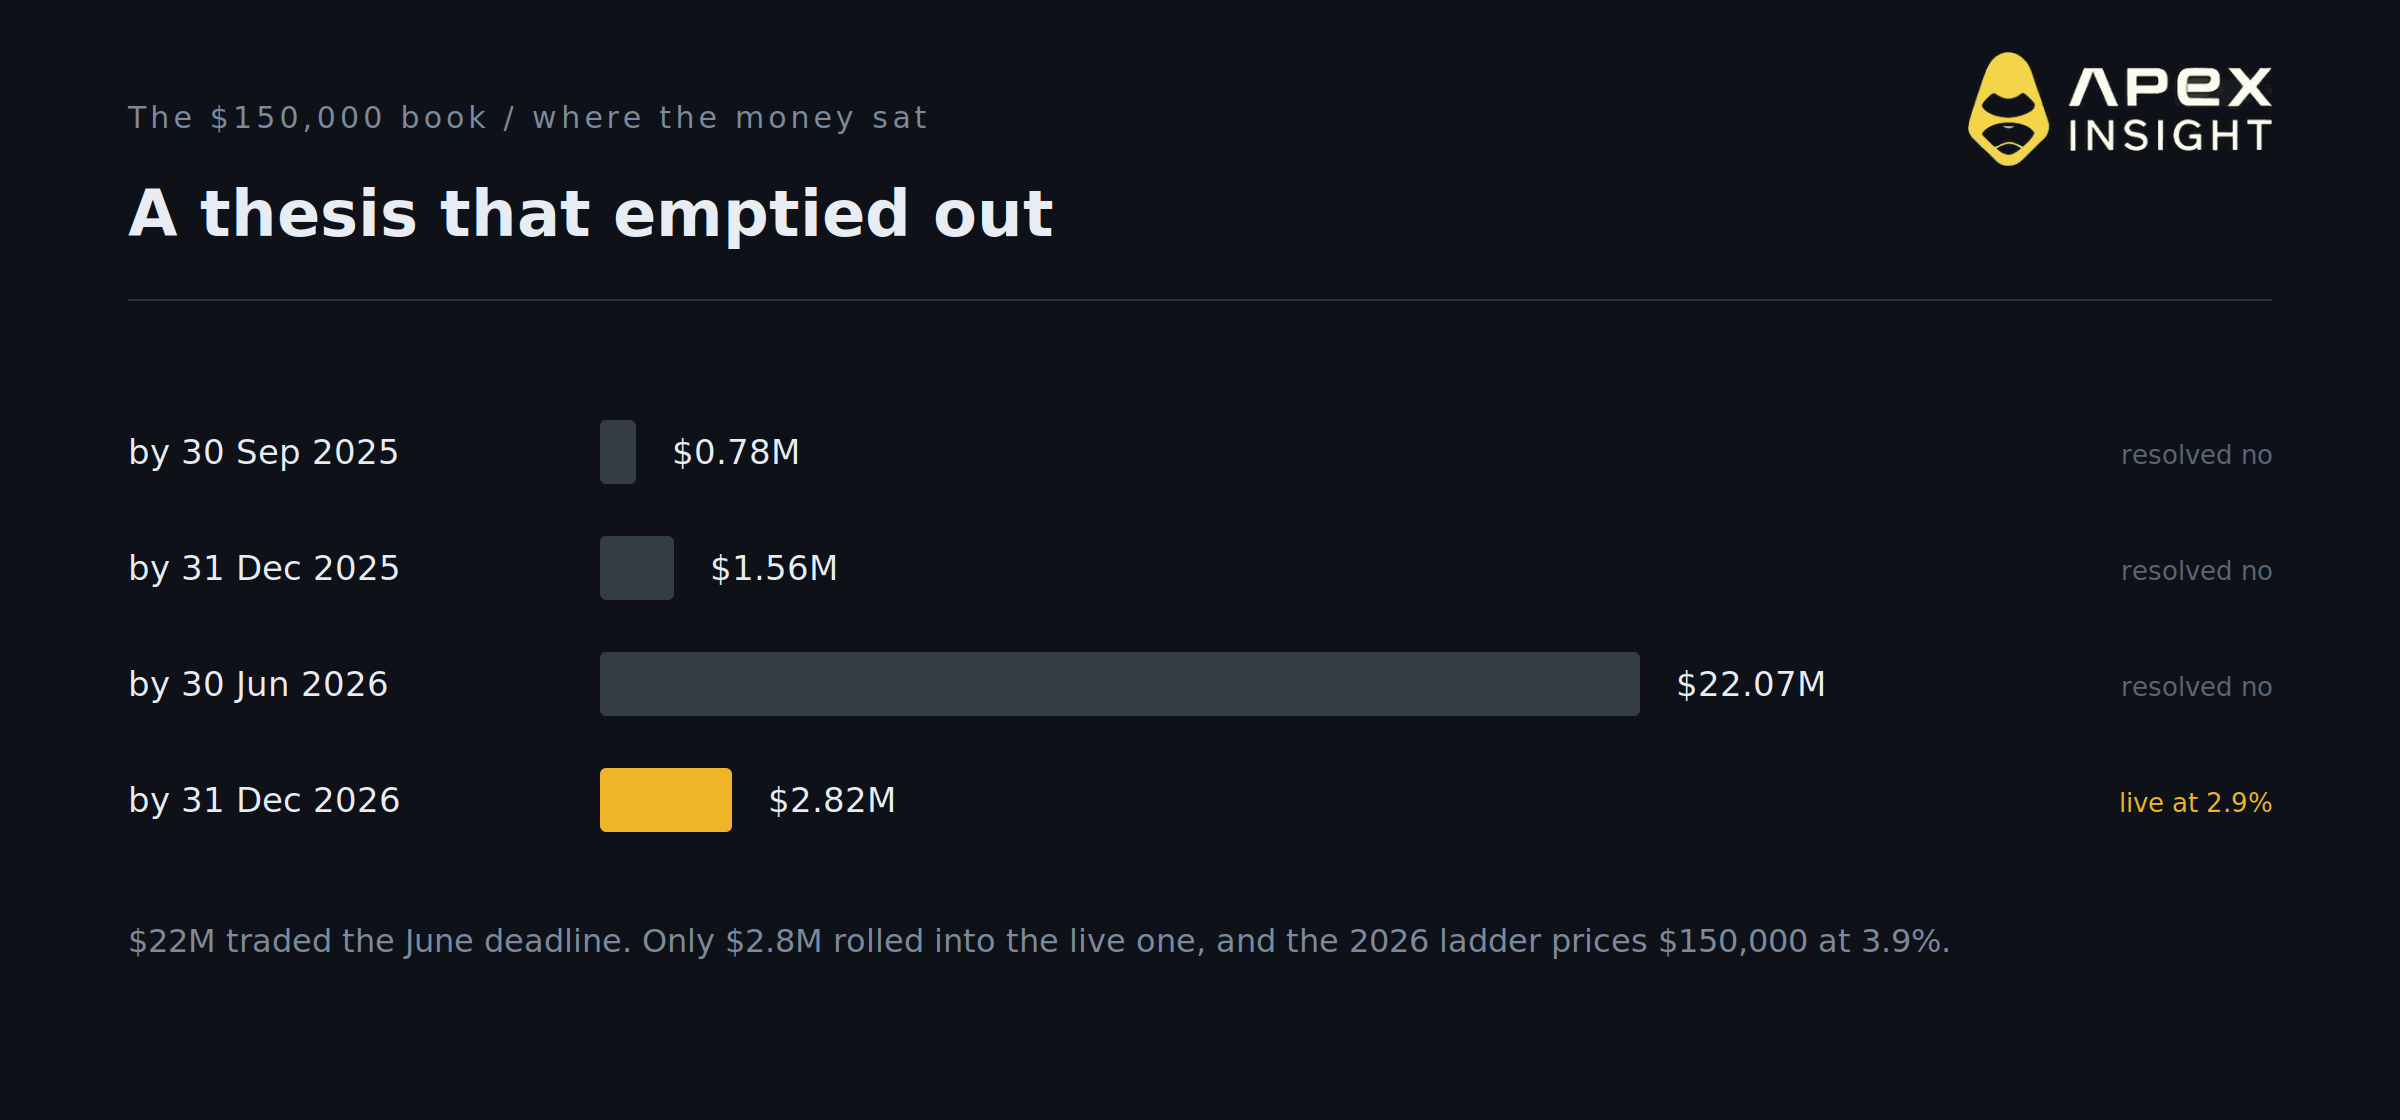
The dedicated $150,000 market carries $27.23M in total. More than $22M of that traded on the June 2026 deadline, which resolved no. The live December leg carries $2.82M and prices at 2.9 percent.
The 2026 ladder prices the same level at 3.9 percent, so the two agree within a point. What the volume distribution adds is the history: this was a heavily traded thesis that lost, and the capital did not roll forward.
A low price on a book people have left is a different signal from a low price on one they are still arguing over. Here you get both readings from the same market.
8. The money is parked at the extremes
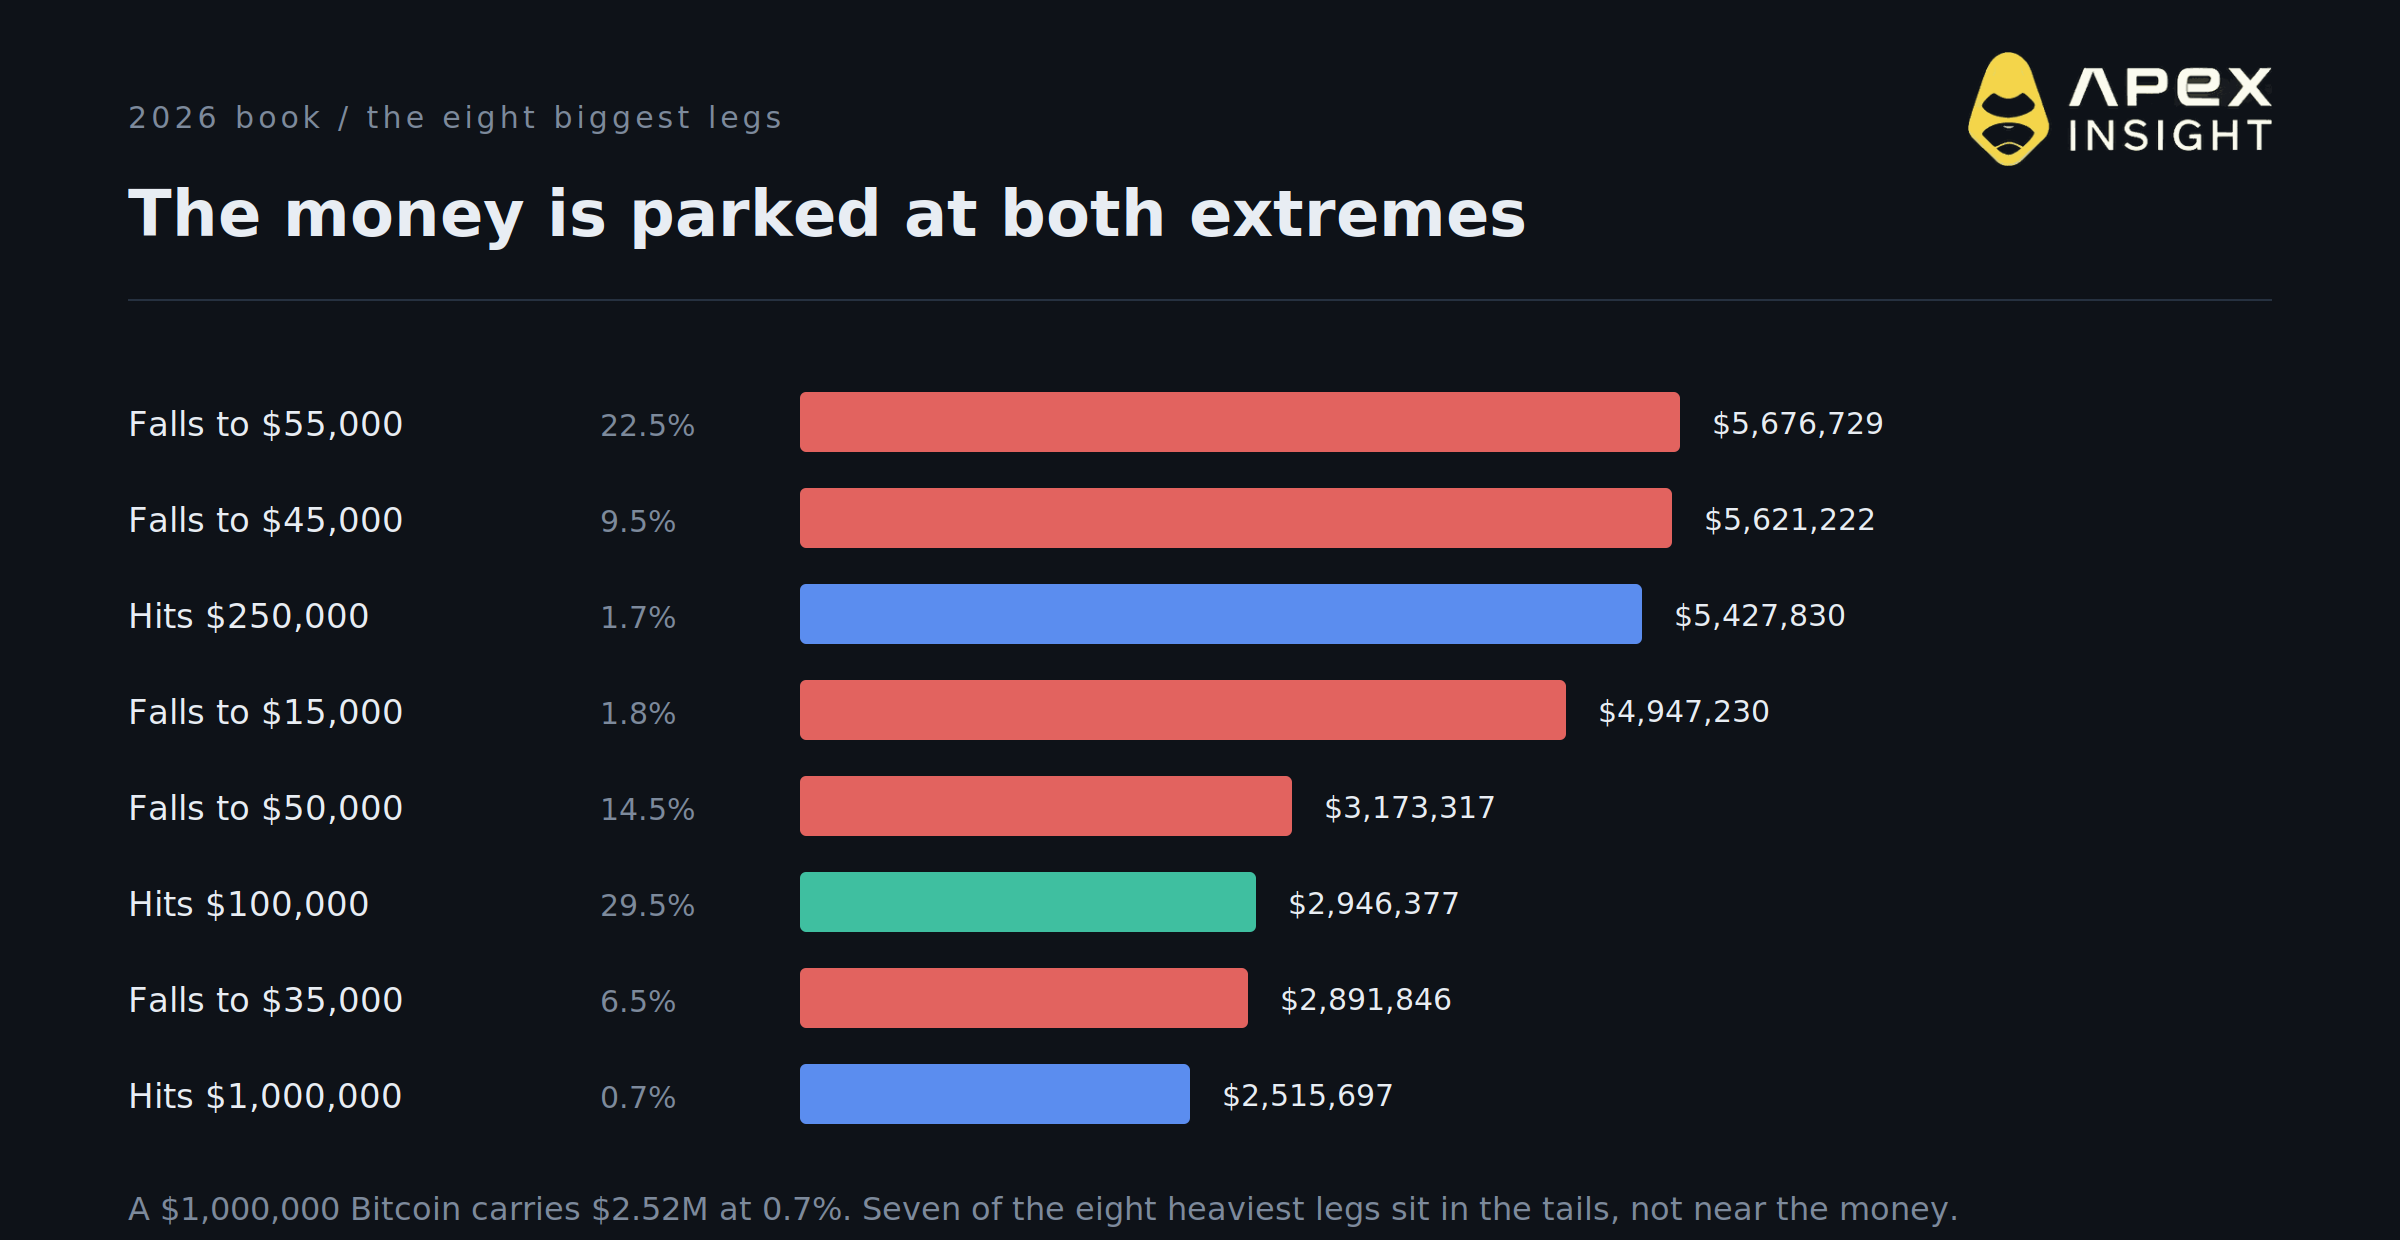
The heaviest leg in the $59.51M book is a fall to $55,000, carrying $5.68M at 22.5 percent. Next is $45,000 at $5.62M, then $250,000 at $5.43M and $15,000 at $4.95M. A $1,000,000 Bitcoin carries $2.52M at 0.7 percent.
Seven of the eight largest positions sit in the tails rather than near the money. Anyone weighting this board by volume to infer where the market expects price to go will land nowhere near $90,000.
Volume marks where the optionality is. Price marks where the expectation is. They are different measurements and they point in different directions here.
9. The ladder sums past 100, and should
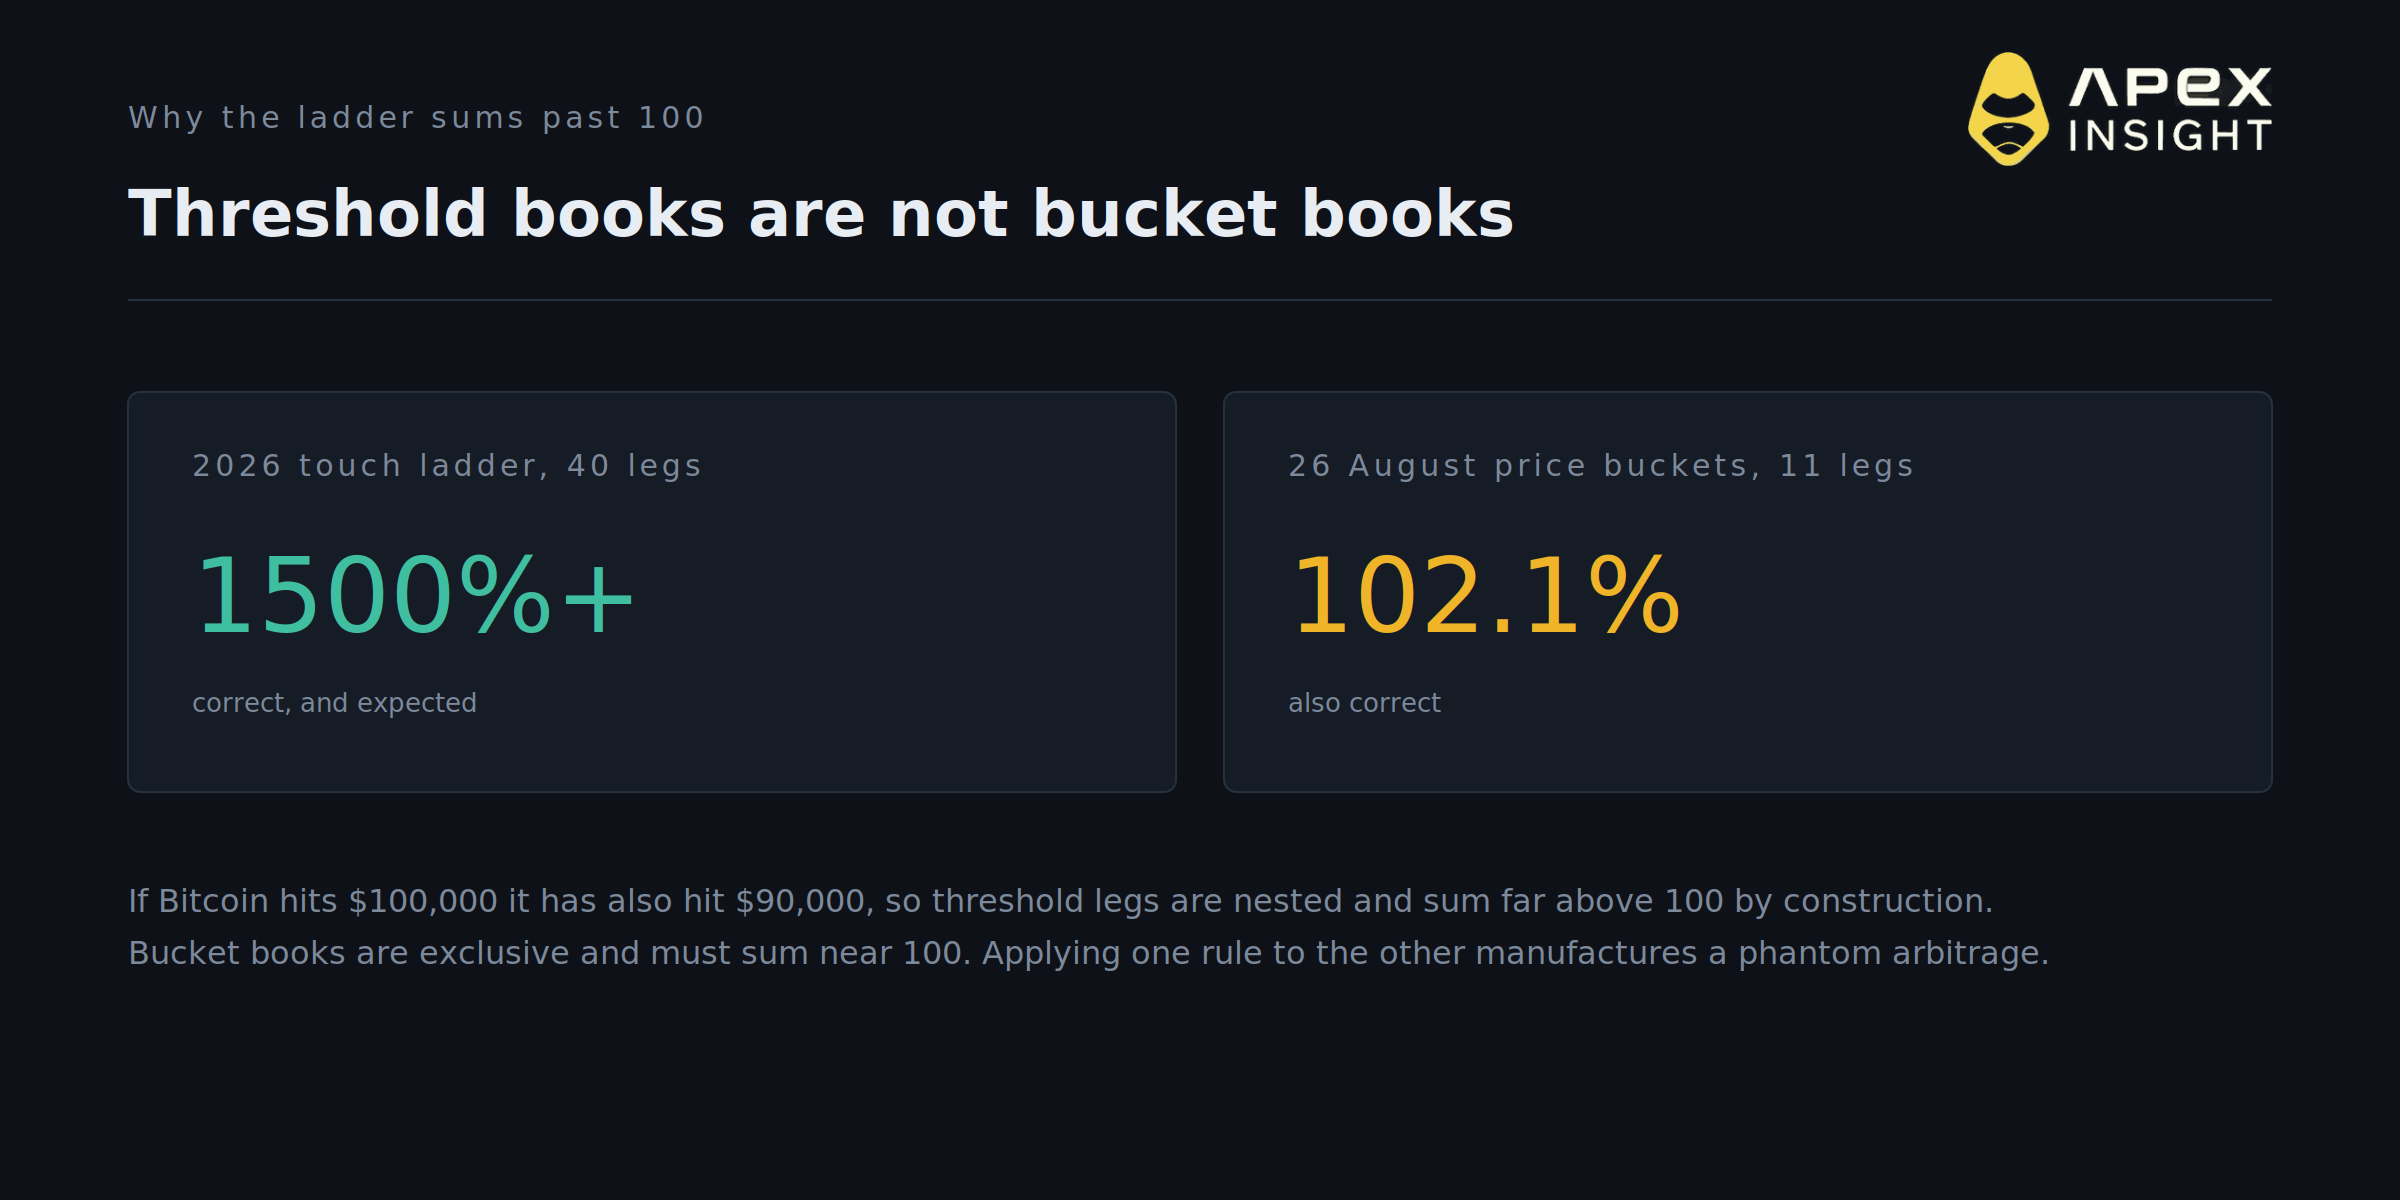
The 2026 ladder has 40 legs and its prices sum well past 1500 percent. That is correct, not an arbitrage.
If Bitcoin hits $100,000 it has necessarily also hit $90,000, so threshold legs are nested by construction. Compare that to a bucketed close market, which splits the outcome into exclusive bands and sums to about 100.
Before treating any overshoot as free money, check whether the outcomes are nested or exclusive.
10. What a ladder does that a perp cannot
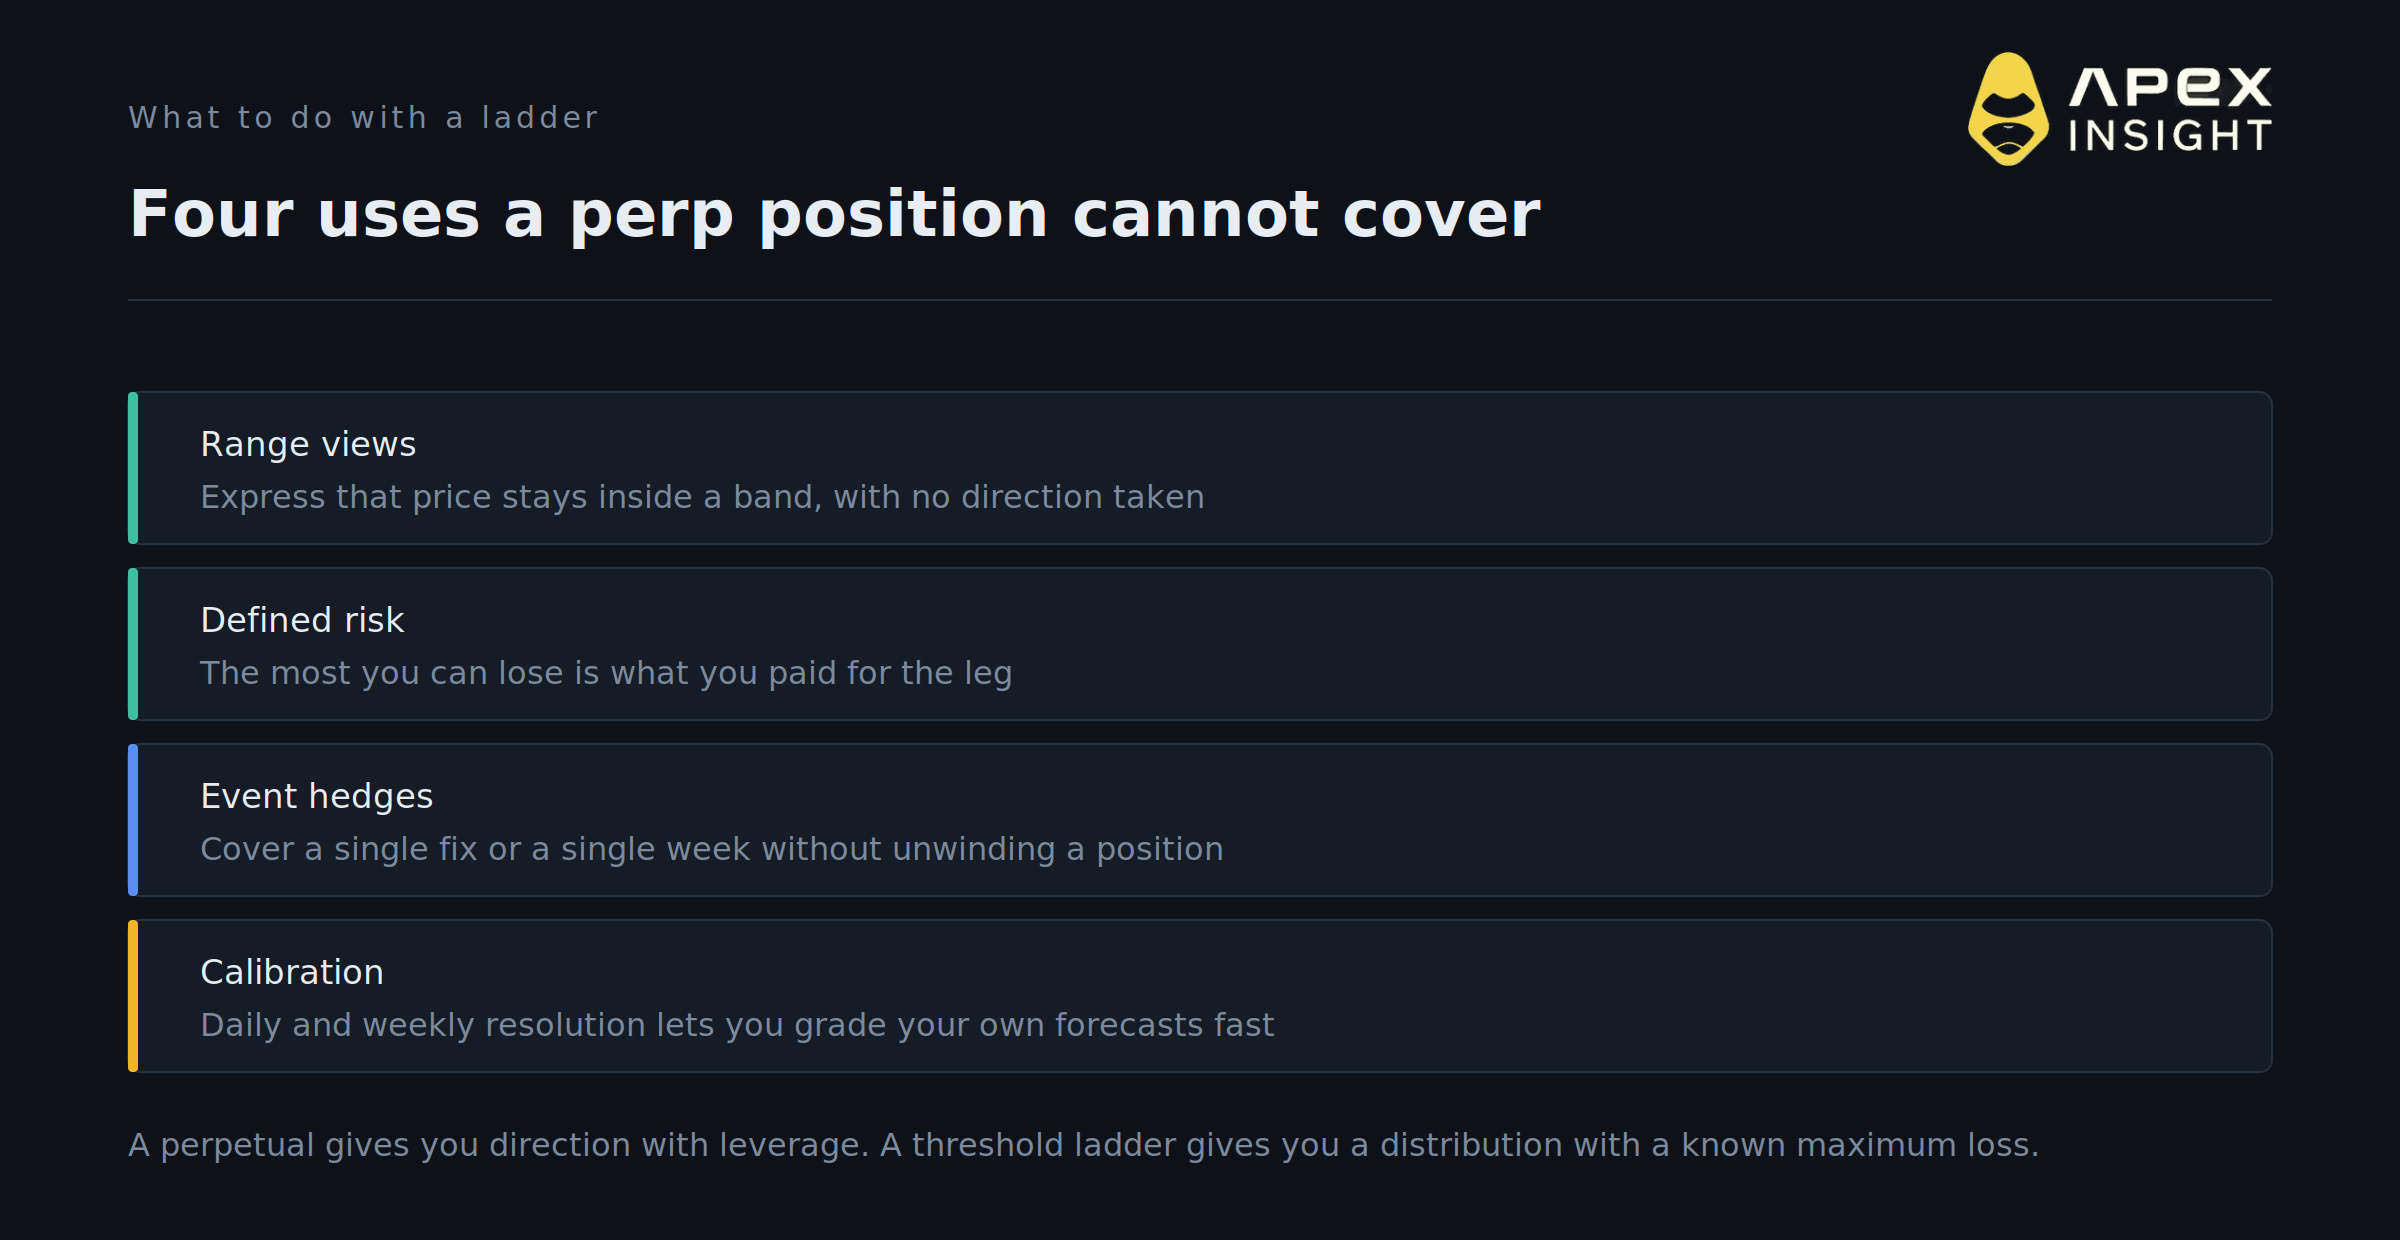
Four things stand out. You can express a range view without taking a direction. Your maximum loss is what you paid for the leg, with no liquidation. You can hedge a single week or a single fix without unwinding a larger position. And because the short-dated books resolve daily and weekly, you can grade your own forecasting inside a week.
A perpetual gives you direction with leverage. A ladder gives you a distribution with a known maximum loss. Most people trading crypto have only ever had the first.
11. The chart levels and the market agree on one number
Prediction market prices and chart levels are usually discussed in separate rooms. Putting them on the same axis is more useful than either alone.
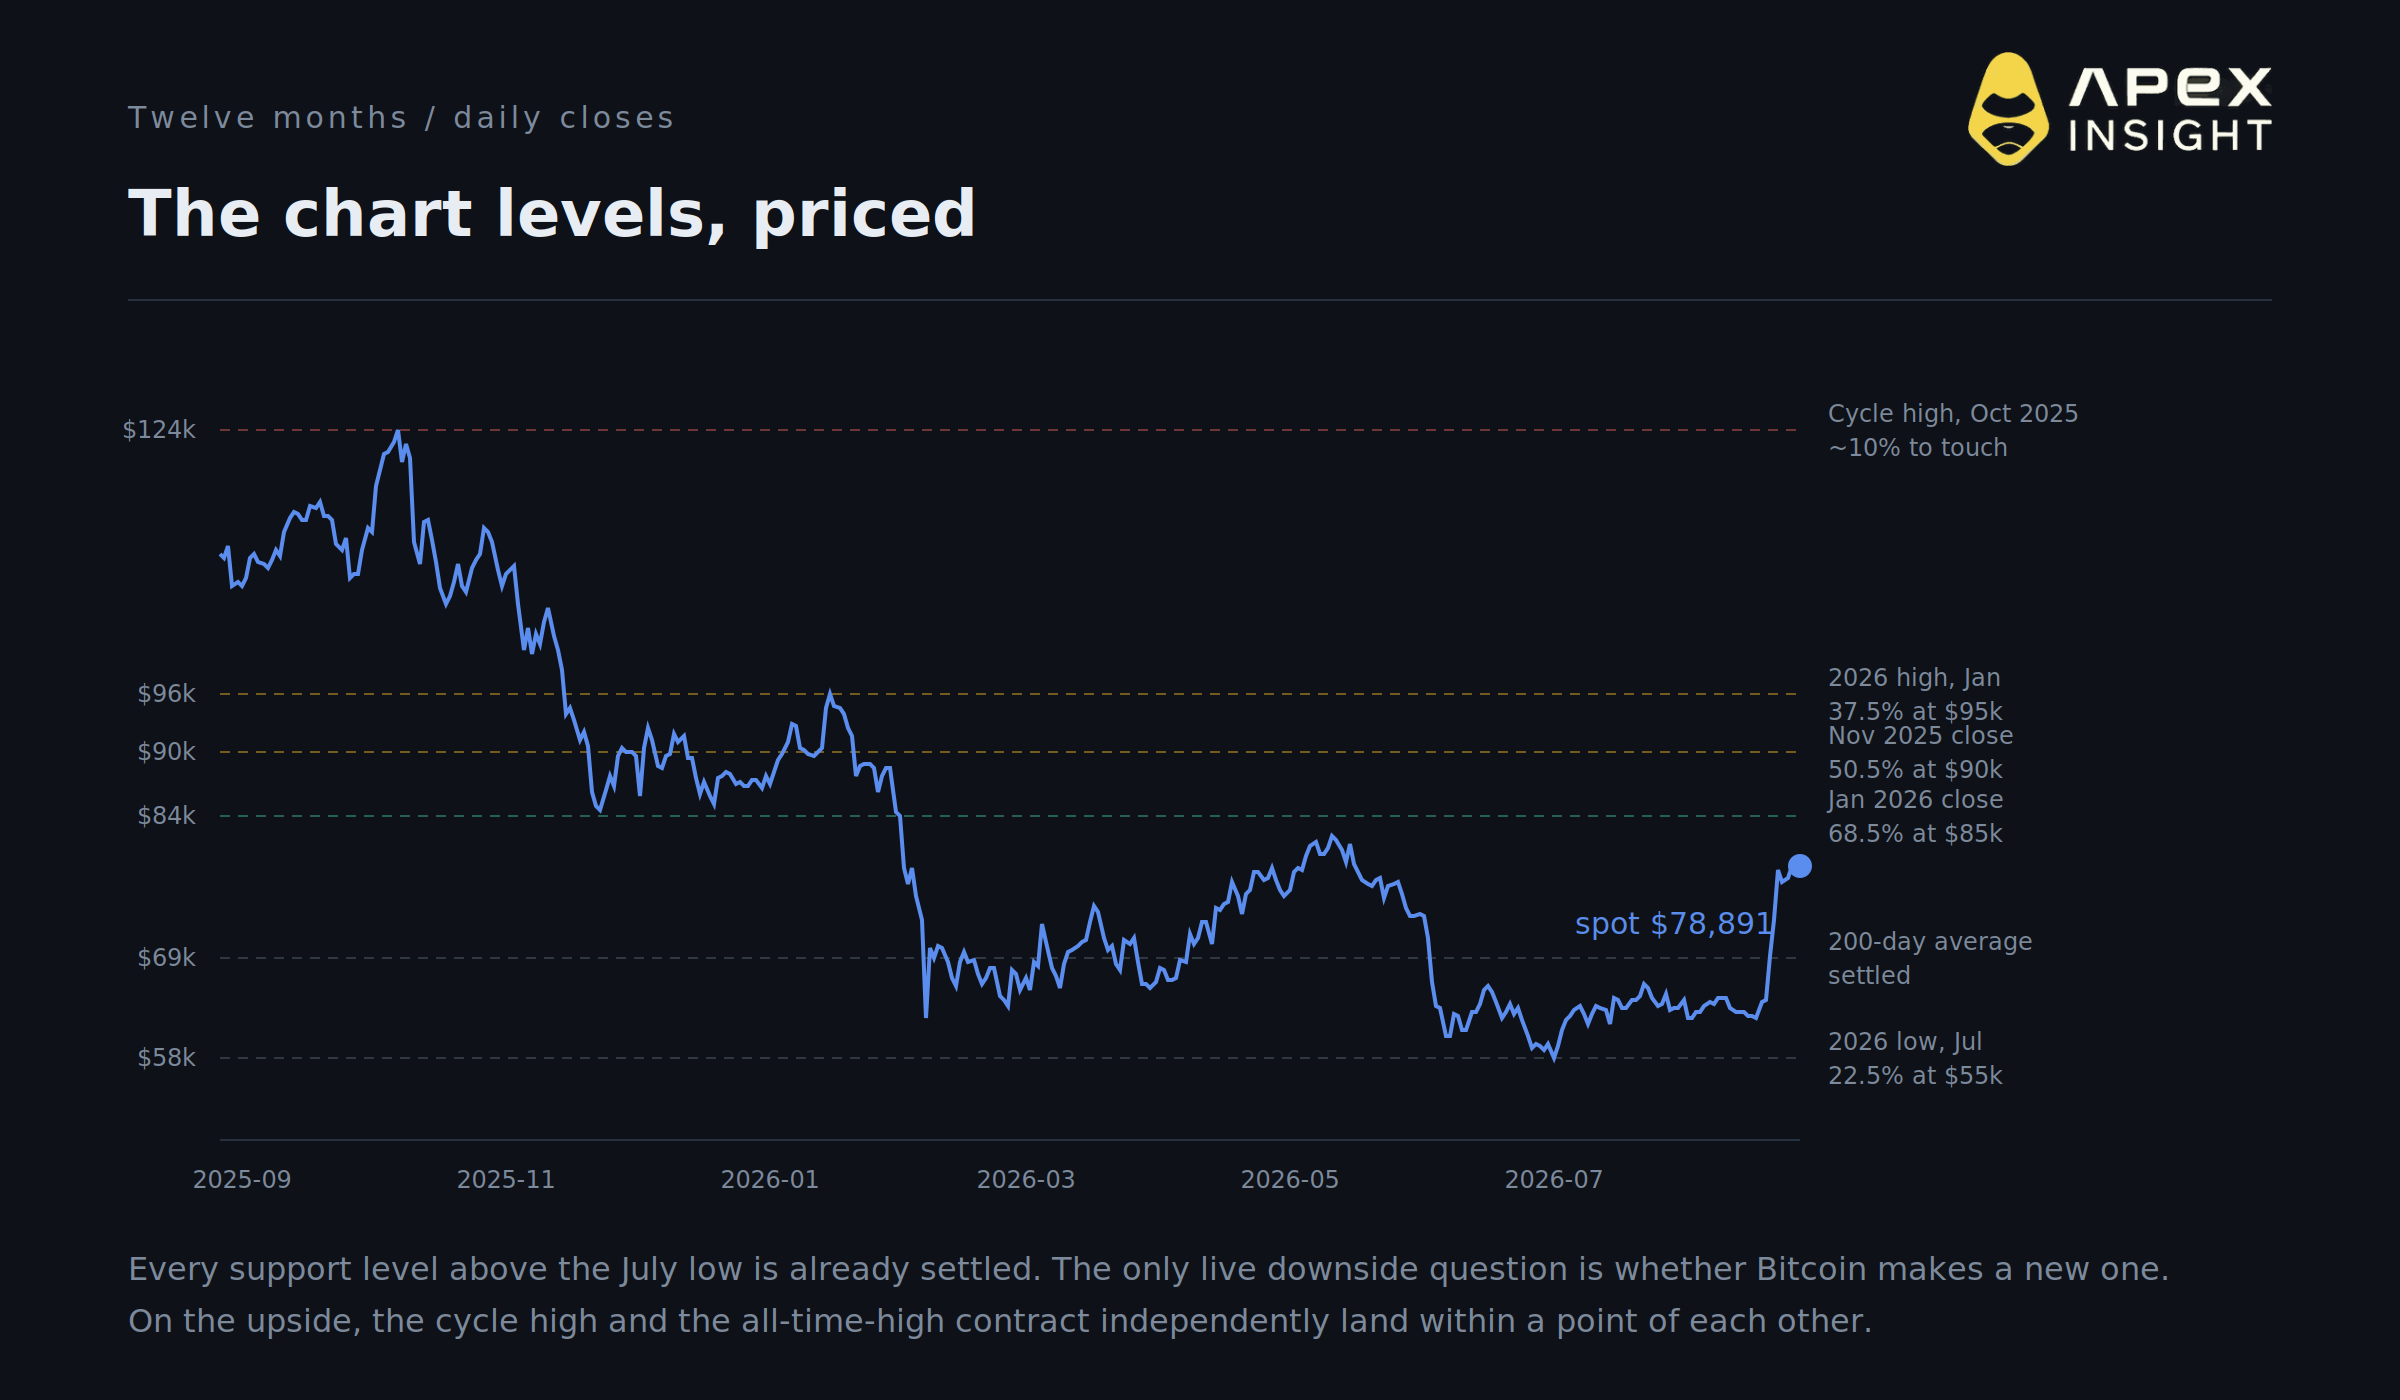
Spot sits at $78,891, a three-month high, and roughly 14 percent above the 200-day average of $69,157. The levels a chartist would mark, and what the board prices for each:
On the upside, the January 2026 monthly close at $84,092 lines up with $85,000 at 68.5 percent. The November 2025 close at $90,832 lines up with $90,000 at 50.5 percent. The 2026 high of $96,899, set on 15 January, lines up with $95,000 at 37.5 percent. The cycle high of $124,740 from 7 October 2025 sits between $120,000 at 12 percent and $130,000 at 7.7 percent, so roughly 10 percent.
That last one is the cross-check worth having. The dedicated all-time-high contract prices 9.8 percent for 31 December. Two independently traded books, one a price ladder and one a binary, land within a point of each other on the same level. When unrelated markets agree like that, the number is more trustworthy than either book alone.
On the downside the picture is different, and it is a genuinely useful thing that the chart alone will not tell you. The 200-day average at $69,157, the July monthly close at $64,777 and the 2026 low of $58,566 have all already printed this year, so every contract at those levels is settled. There is no live market for a retest of support, because support has already been tested. The only open downside question is whether Bitcoin makes a new low, and that starts at $55,000.
Two caveats. Technical levels are a convention rather than a law, and reasonable chartists will mark different ones. And the levels above are derived from daily closes, so intraday wicks sit outside them. Use them as a frame for reading the ladder, not as a substitute for it.
What this adds up to
The market's central case for the rest of 2026 is $90,000, with six figures at just under one in three and a retrace to $60,000 priced identically. The record high has come back onto the board at 9.8 percent after resolving no twice. Nothing in the shape of the curve suggests the market expects a regime change, and nothing in the downside legs suggests it has stopped respecting one.
Four habits make the board readable. Check touch against settle before quoting any number. Read the shape of the ladder before the level, because the decay rate says more than any single strike. Ignore volume as a proxy for expectation, since the heaviest legs here are consistently the ones furthest from the money. And check the individual leg, because this book currently carries three contracts asking the identical question at three different prices.
Where to watch it
Every market in this article is live on ApeX Omni, where Polymarket's order books are integrated directly: the same liquidity and the same settlement source, minus the KYC. The board carries the daily, weekly, monthly and annual ladders side by side with the volume behind each leg visible, which is what makes it possible to read a term structure straight off the screen and see which theses have been abandoned.
We appreciate your continued support.
Published by ApeX. For informational and educational purposes only. Not investment advice, and not a forecast or endorsement of any outcome. Trading involves risk, including total loss.