





Note: All market prices are as of 24 August 2026. The weekly post-count books resolve within days of publication, so those figures will be settled by the time you read them. The structural points survive; the numbers will not.
1. Six books, five million dollars, one person
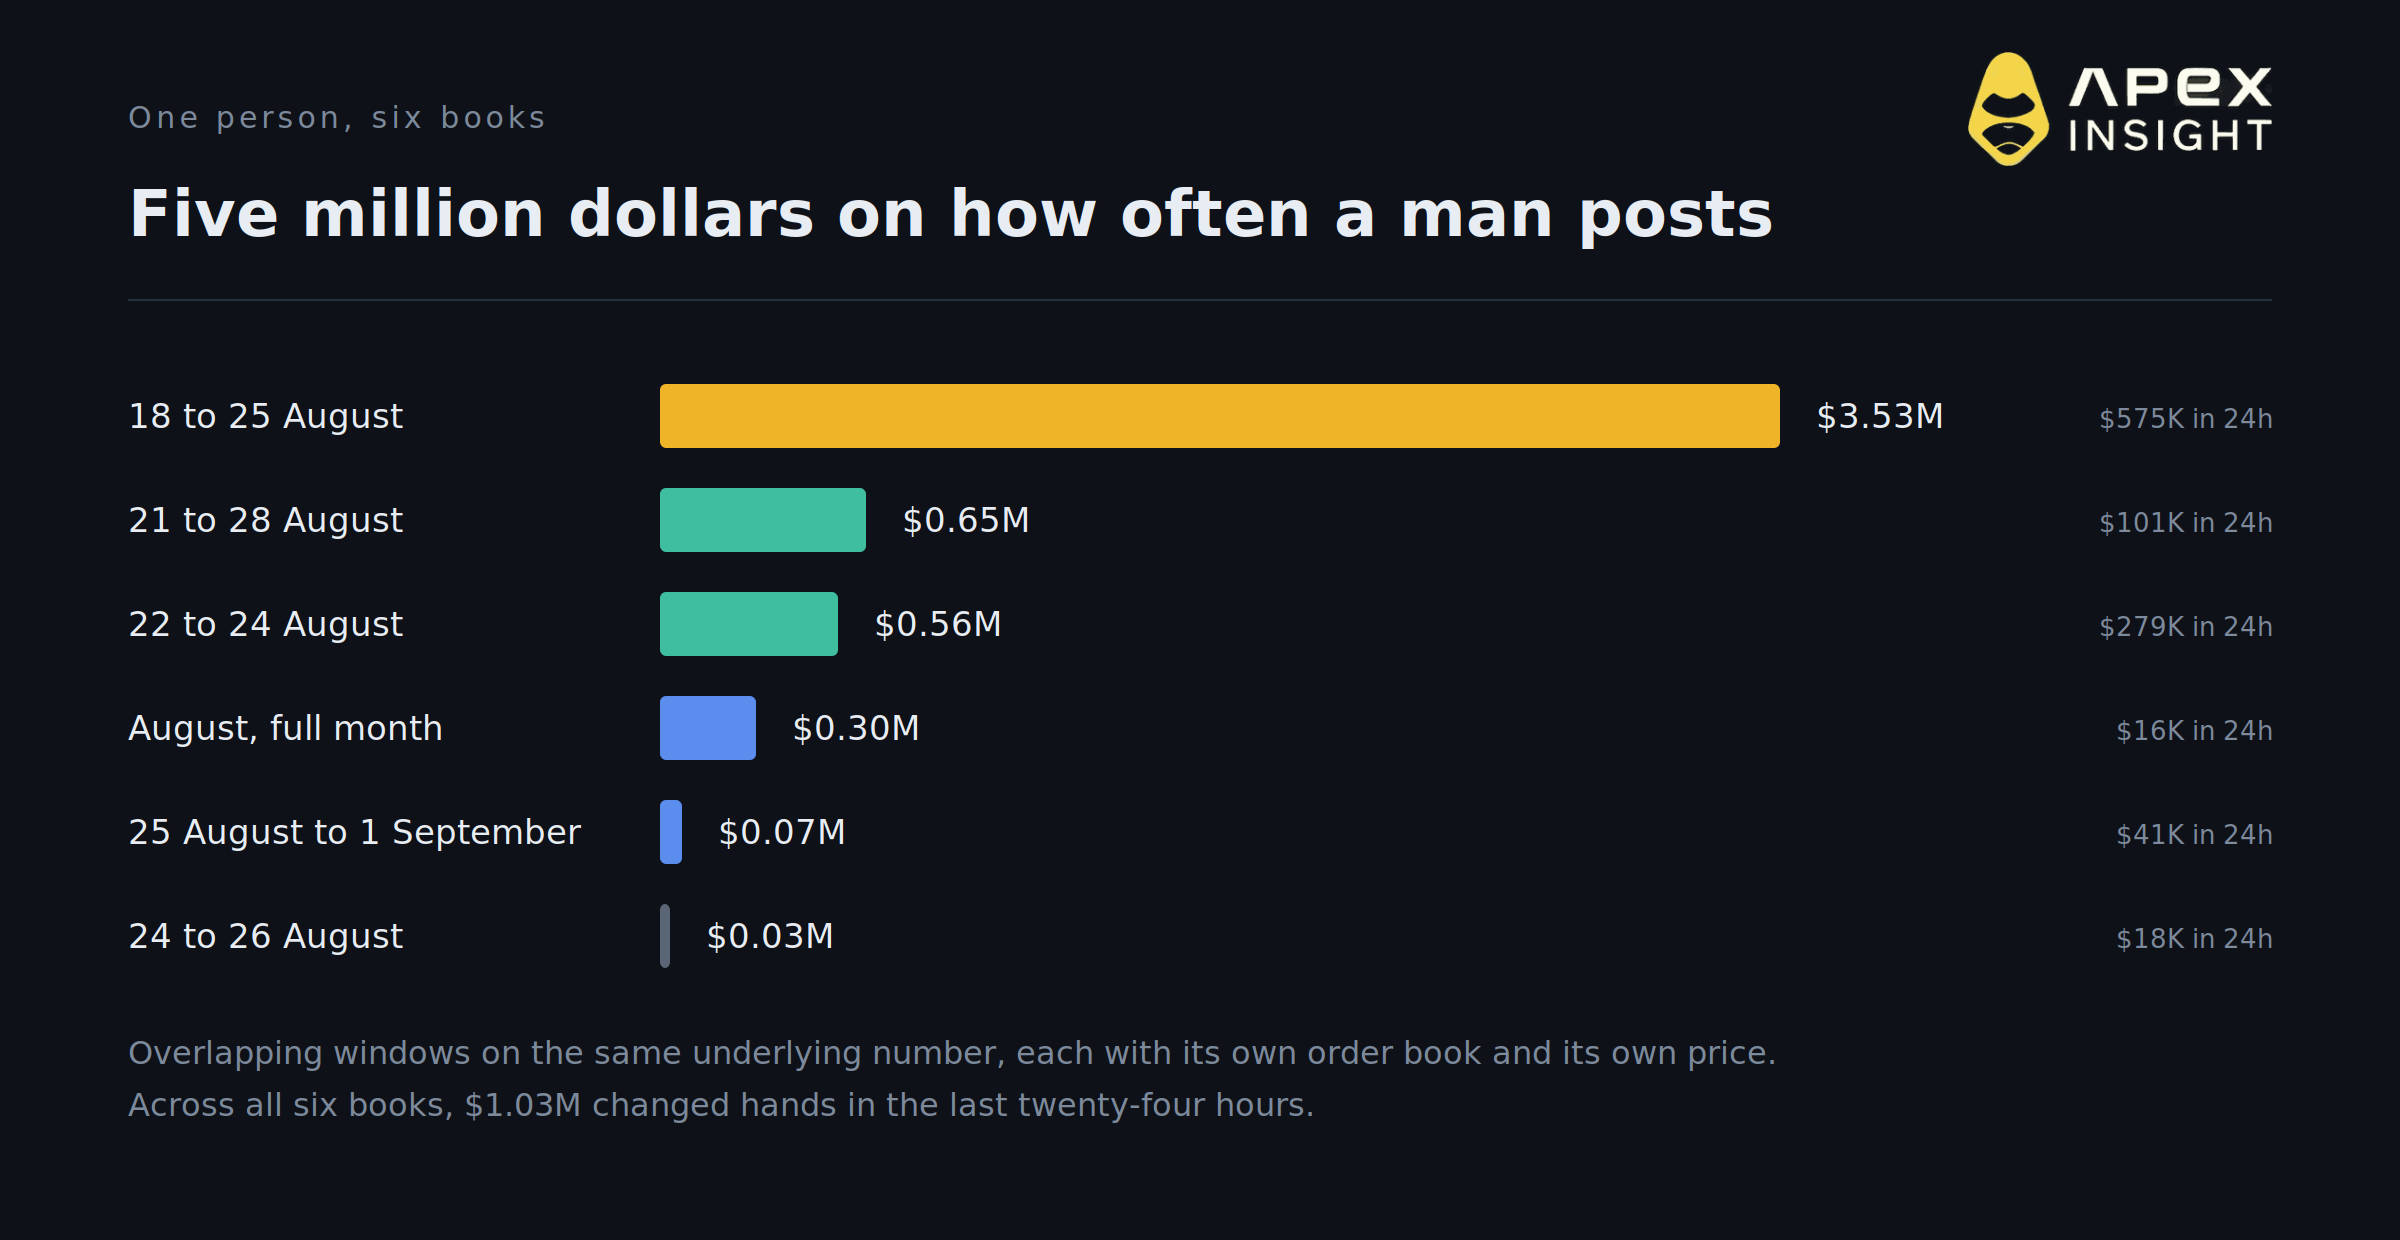
The 18 to 25 August window carries $3.53M, with $575K traded in the last day alone. The 21 to 28 August window carries $655K and the three-day 22 to 24 August book $560K. The full-month August book carries $300K, the 25 August to 1 September window $70K, and a three-day 24 to 26 August book another $28K.
These are overlapping windows on the same underlying variable, each with its own order book and its own price. That overlap is what makes them interesting rather than redundant.
2. The resolution is an integer, not a claim
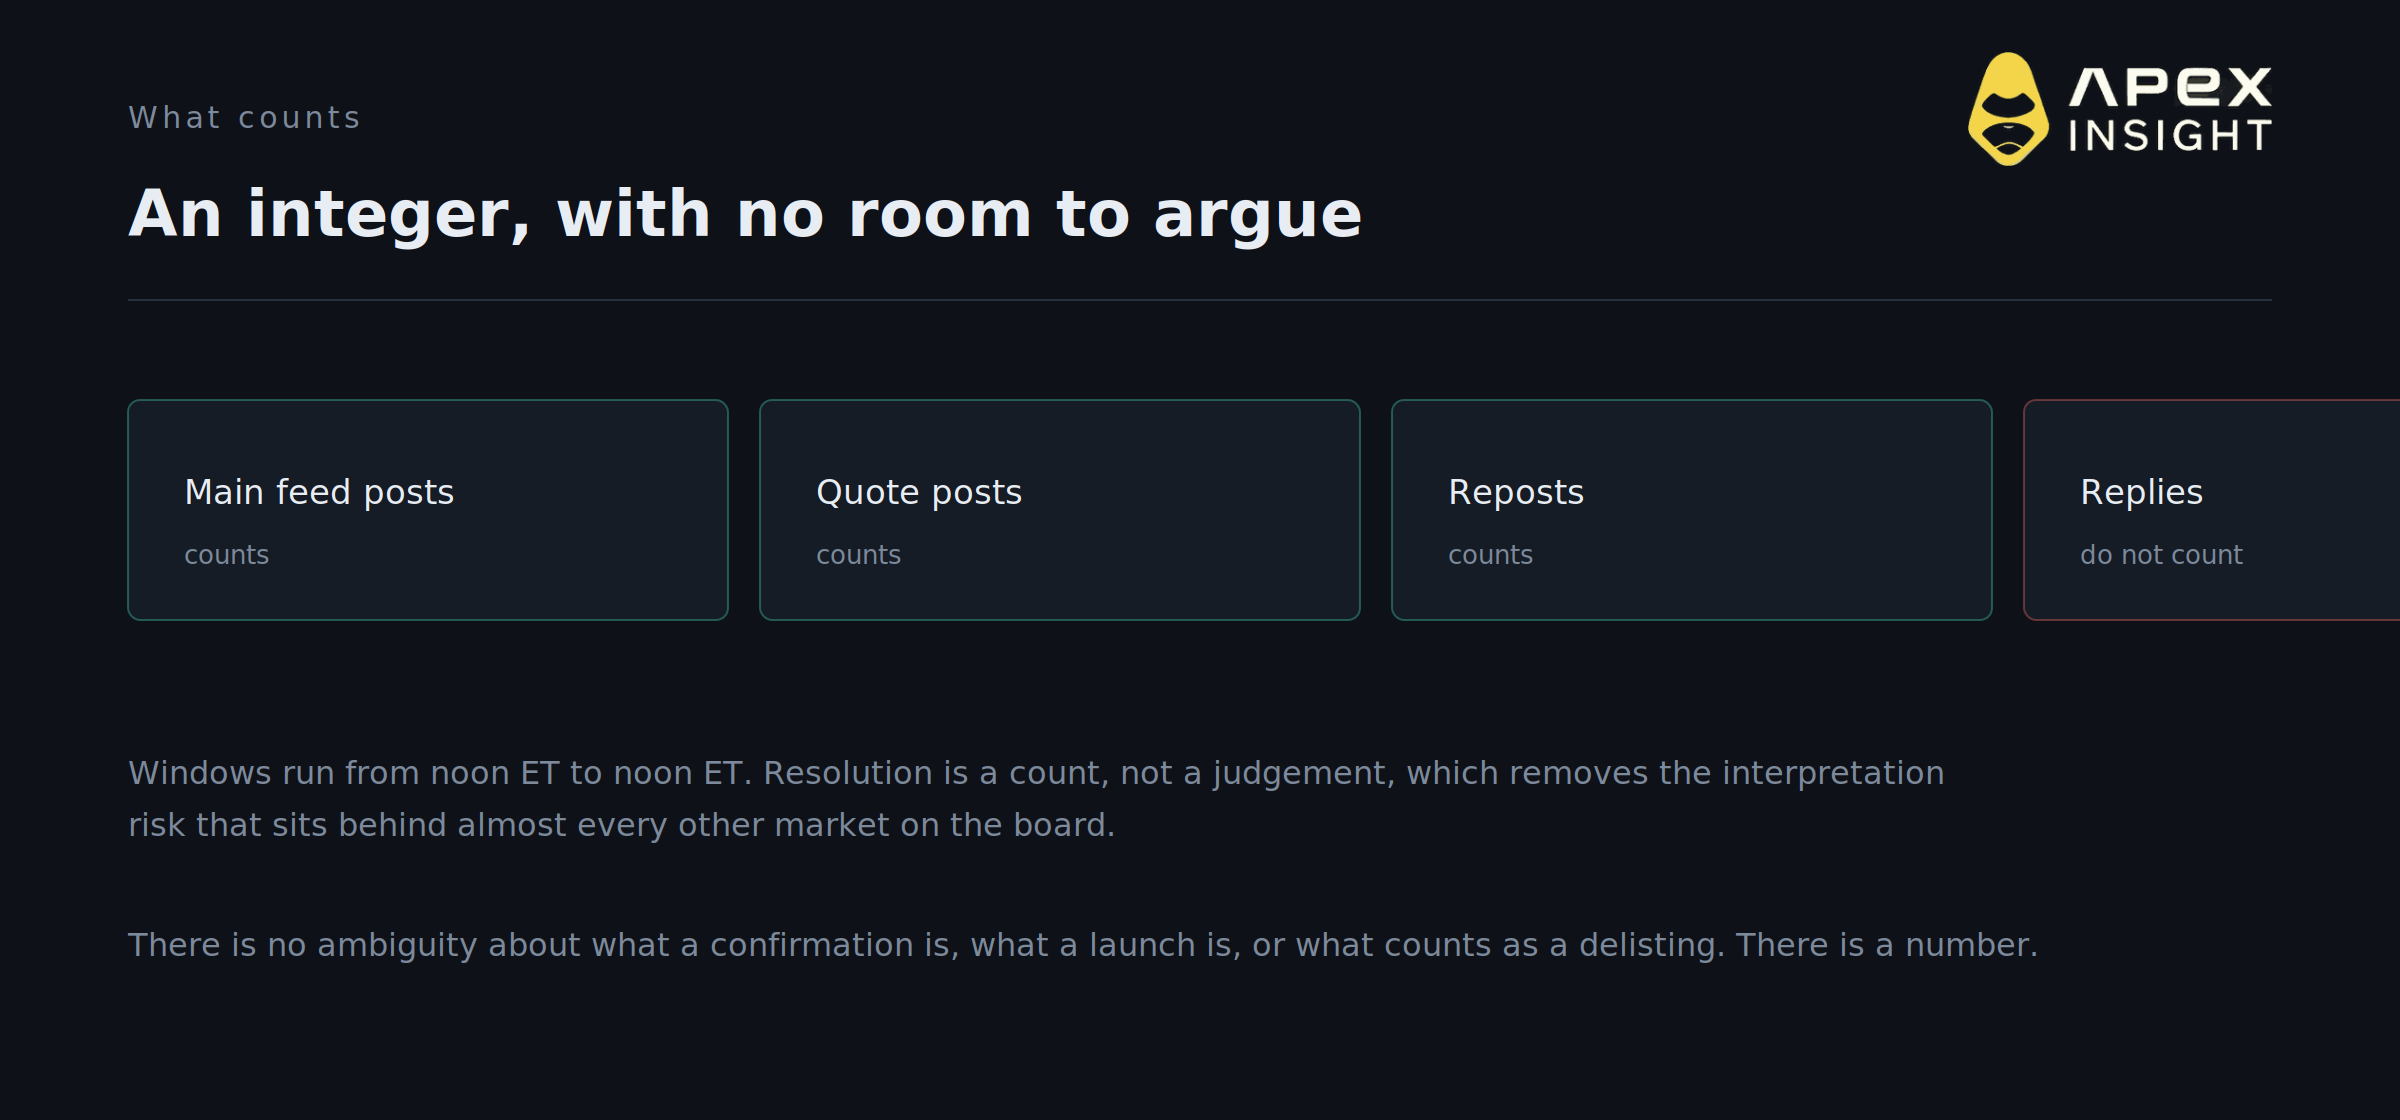
Main feed posts, quote posts and reposts count. Replies do not. Windows run noon ET to noon ET.
Every other market in this series resolves on a claim about the world, and most of the analytical work goes into what would actually satisfy it. Whether a document release counts as confirmation. Whether an airdrop counts as a launch. Whether a committee vote counts as passage.
Here there is nothing to argue about. Someone counts, and the number is the number. That removes interpretation risk entirely and leaves only the forecasting problem, which is rarer than it sounds.
3. Variance collapses as the window runs down
This is the most instructive picture on the board, and you can only see it because three windows are live at different ages simultaneously.
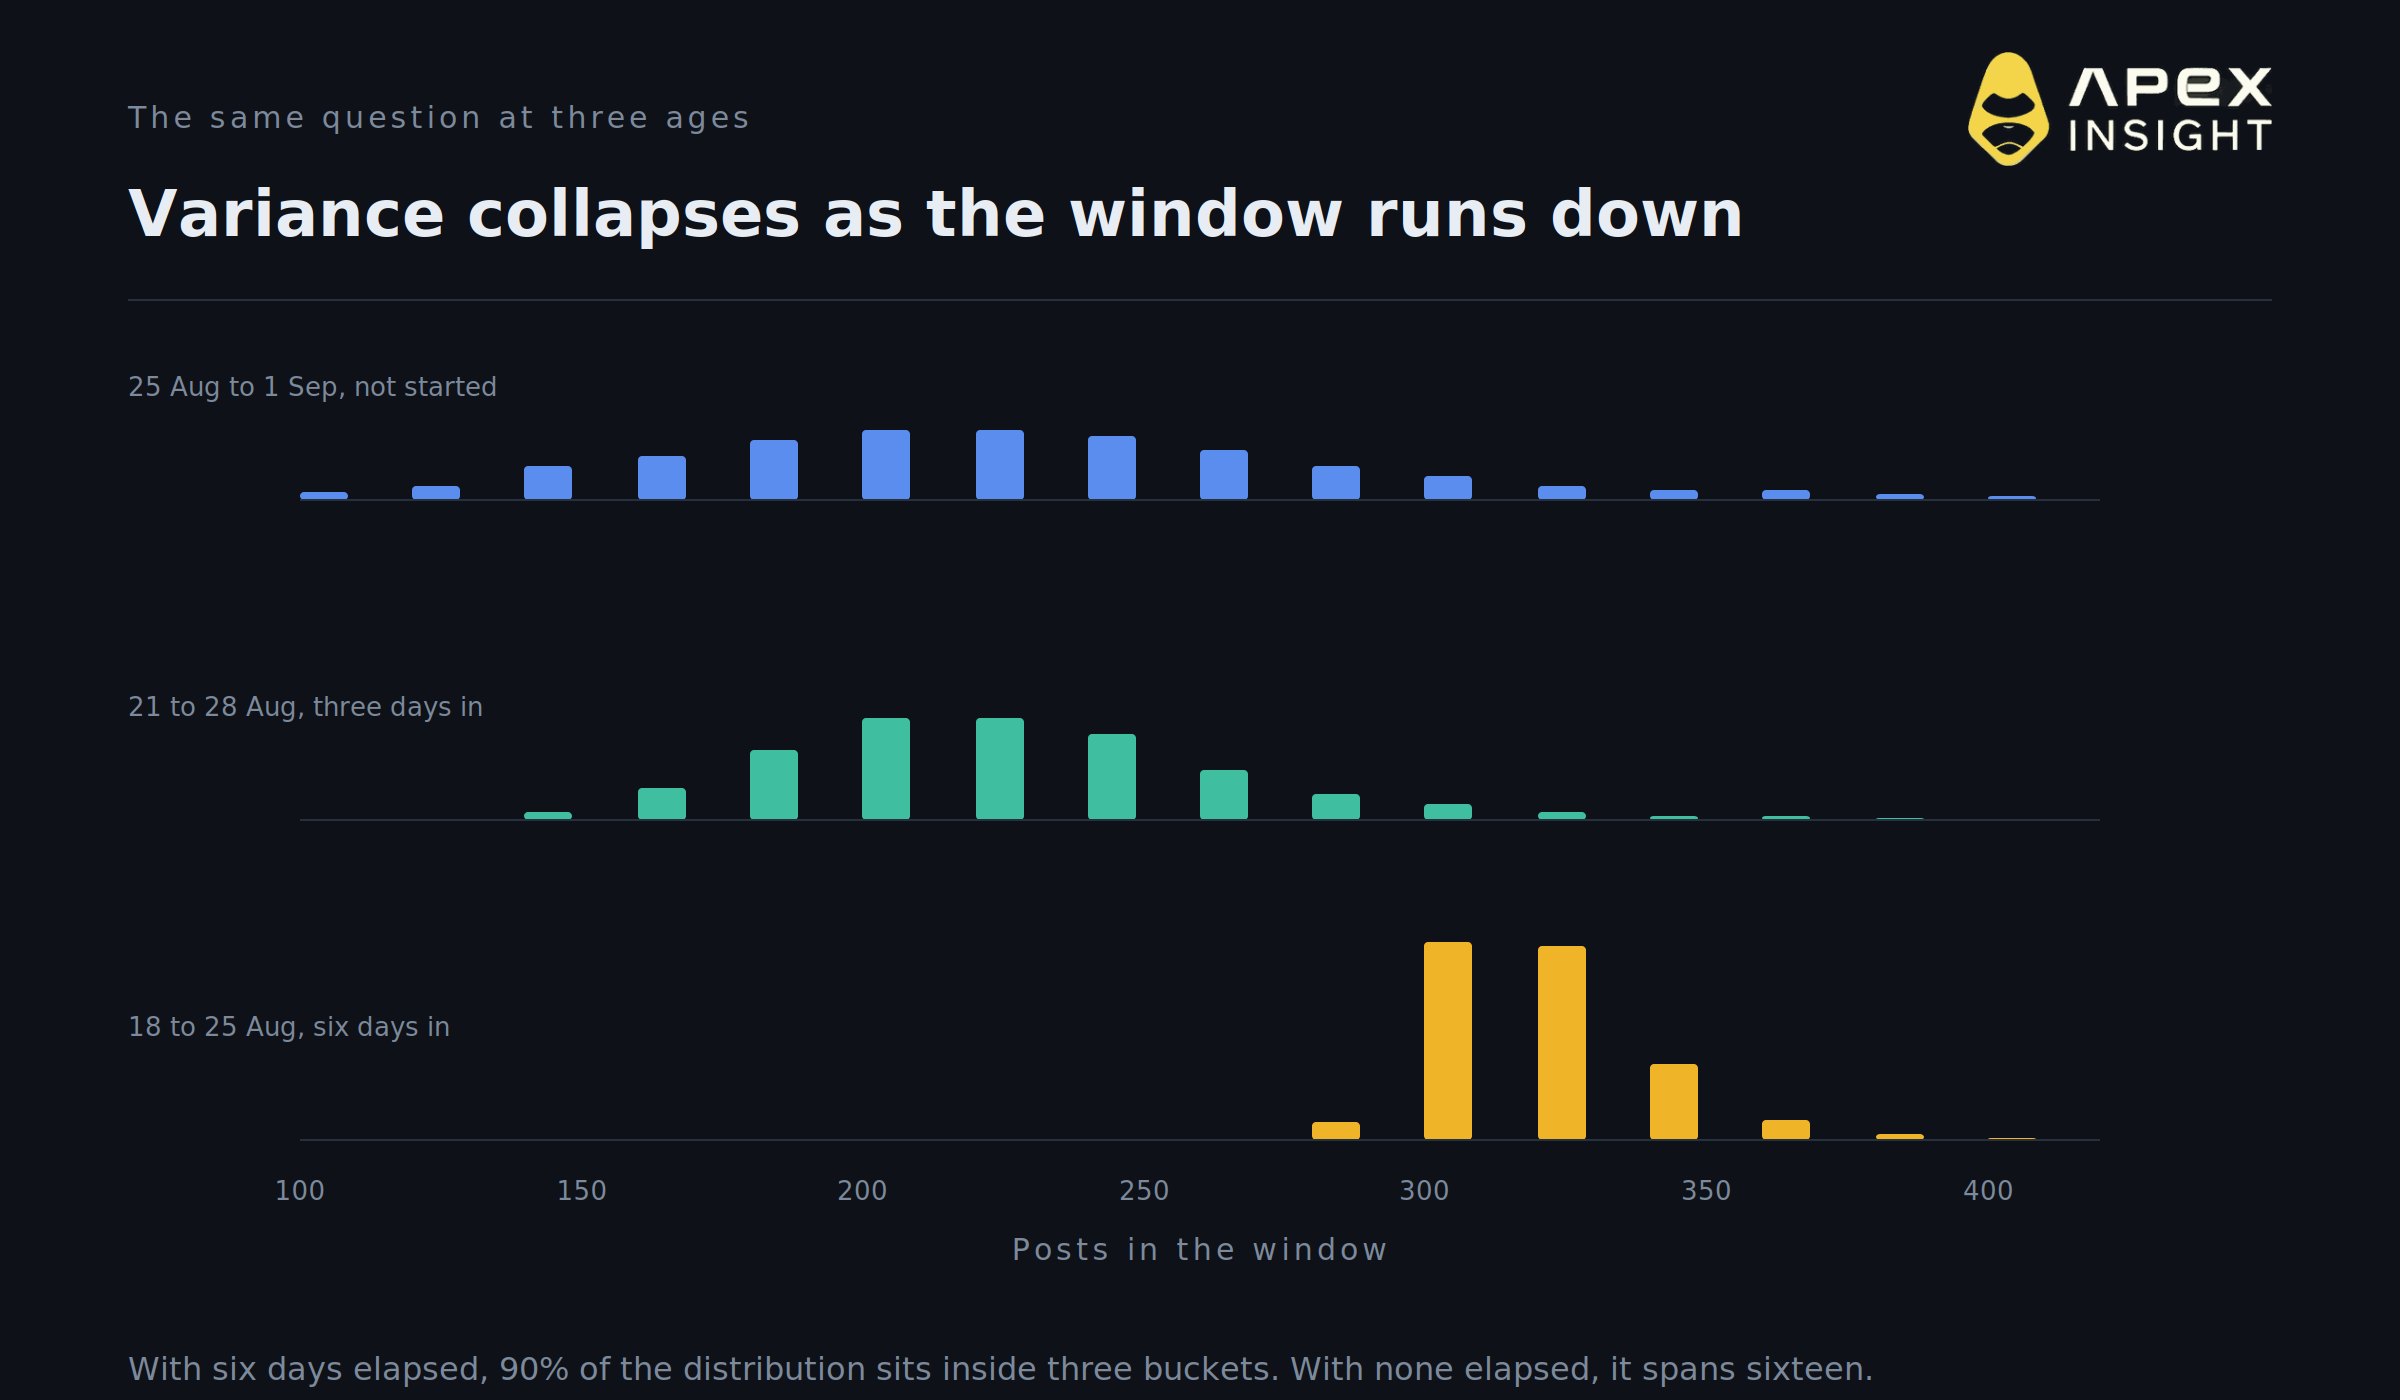
The 25 August to 1 September window has not started. Its distribution spans sixteen buckets, peaking at 200 to 239 with only 13.5 percent in each of two adjacent buckets.
The 21 to 28 August window is three days in. It has tightened, peaking at the same 200 to 239 region but at 19.5 percent, with the tails visibly thinner.
The 18 to 25 August window is six days in, with one day left to run. It peaks at 300 to 319 with 38.1 percent, and 90 percent of the distribution now sits inside three buckets.
One caveat on reading across them: the near-resolved window is centred much higher than the two that follow it. That is not only variance collapsing, it is the market pricing the current week as unusually active and expecting a return toward a lower baseline.
Same question, same person, three different amounts of information. The shape of that collapse is what every probability forecast does as its resolution date approaches, and it is almost never observable this cleanly.
4. This week implies about 44 posts a day
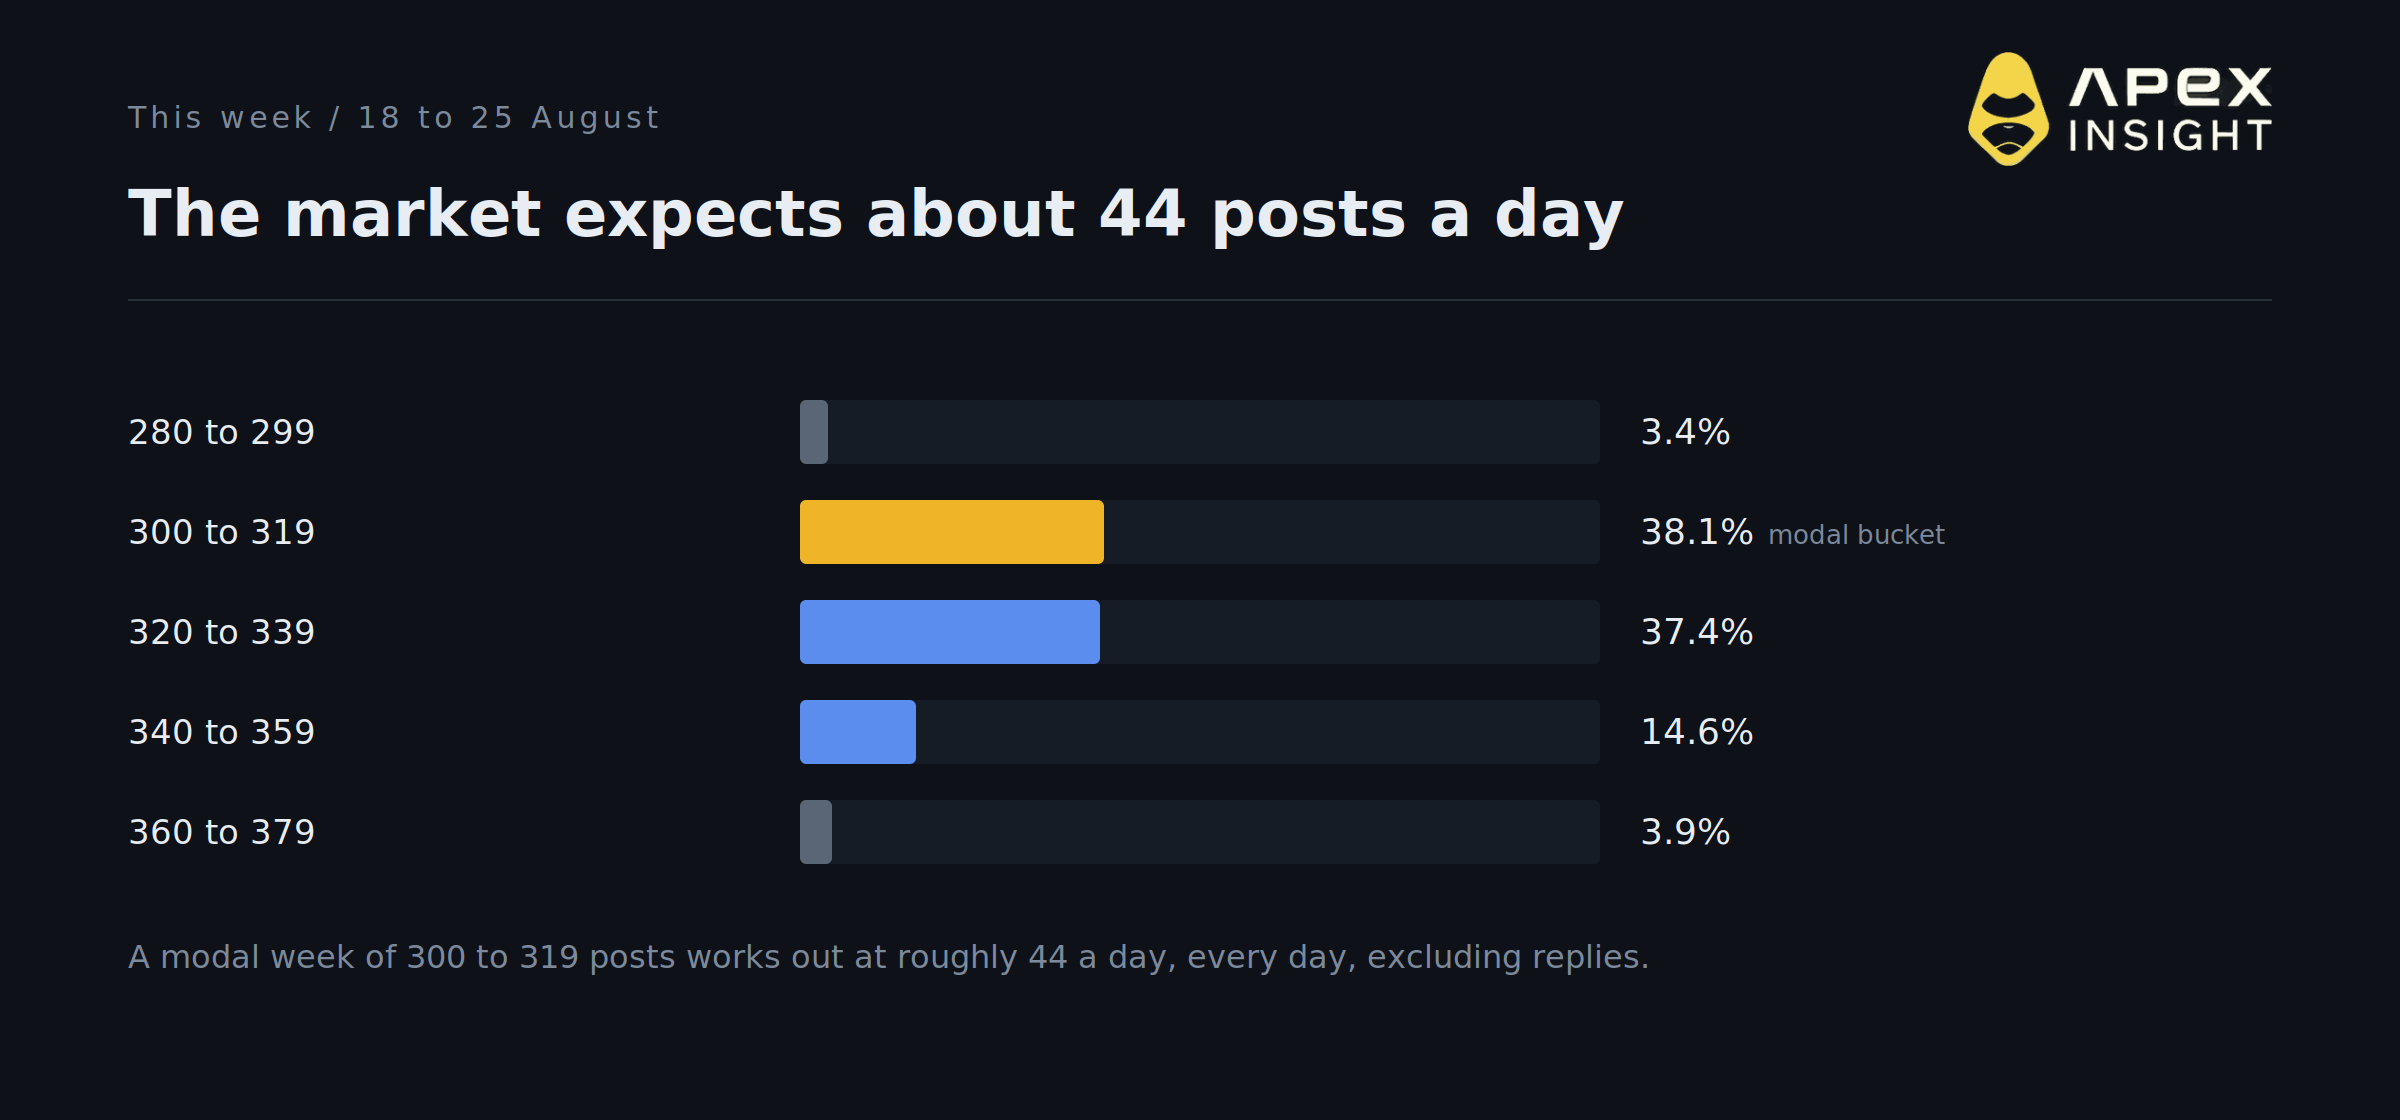
The modal bucket for 18 to 25 August is 300 to 319 at 38.1 percent, with 320 to 339 at 37.4 percent and 340 to 359 at 14.6 percent.
A week of roughly 310 posts is about 44 a day, every day, and that excludes replies. Whatever else you think about the man, the market's central estimate of his output is a specific and fairly extraordinary number.
5. The month book is priced at a finer resolution than most markets offer
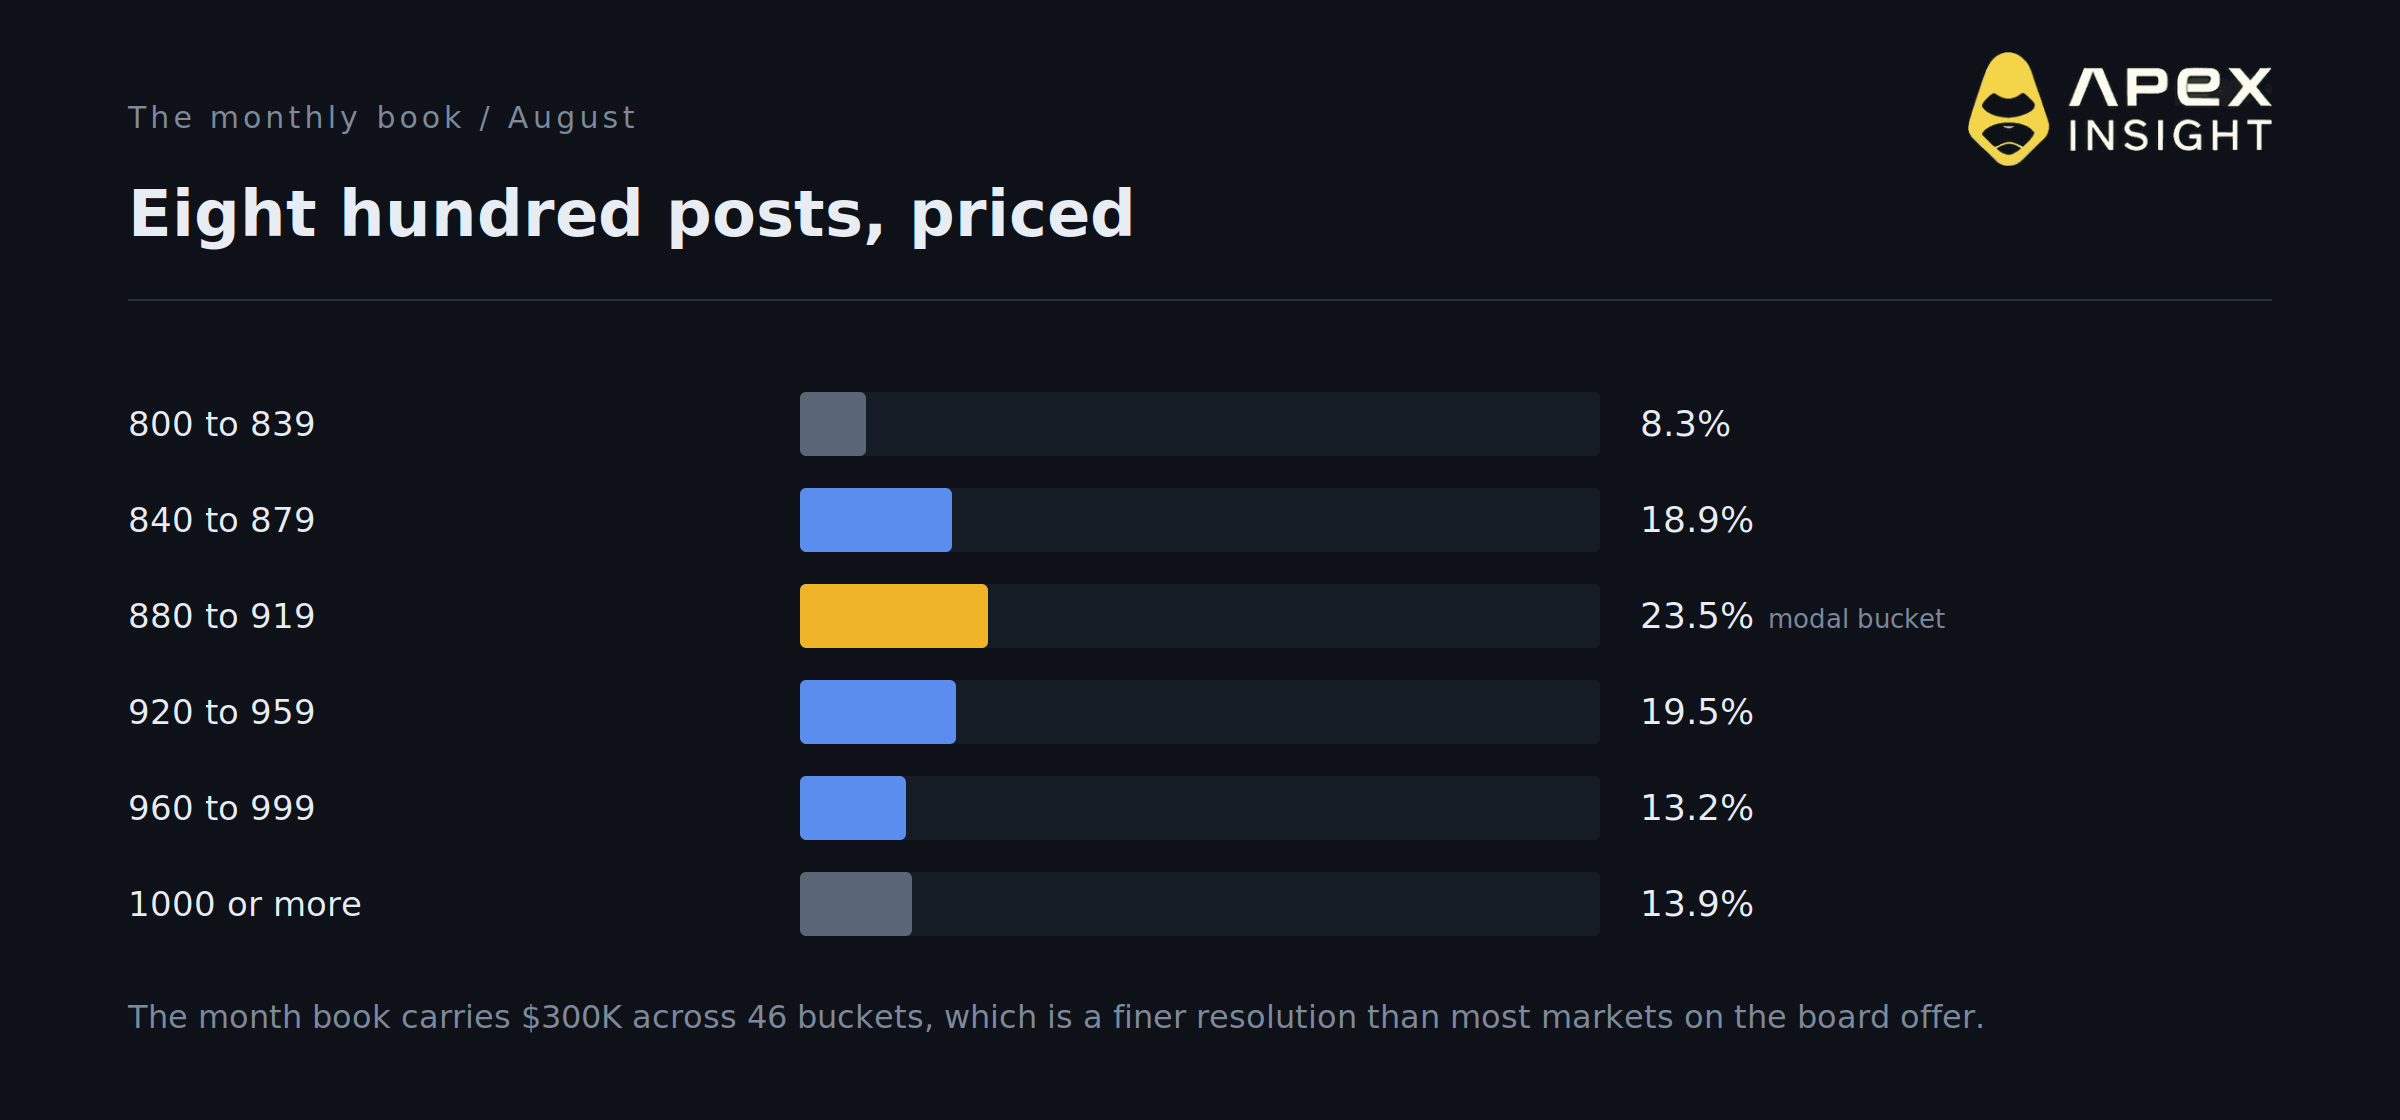
The full-month August book splits into 46 buckets. The modal outcome is 880 to 919 at 23.5 percent, with 920 to 959 at 19.5 percent and 840 to 879 at 18.9 percent.
That implies roughly 900 posts across August, or about 29 a day, well below the 44 the current week implies. The two are consistent: most of the month is already banked at a slower pace, and the market is pricing this week as the outlier.
Forty-six buckets on $300K is a finer grid than almost anything else on the board, and it is the only market in this series that gives you a full continuous distribution rather than a handful of thresholds.
6. Volume records where the market has been, not where it is
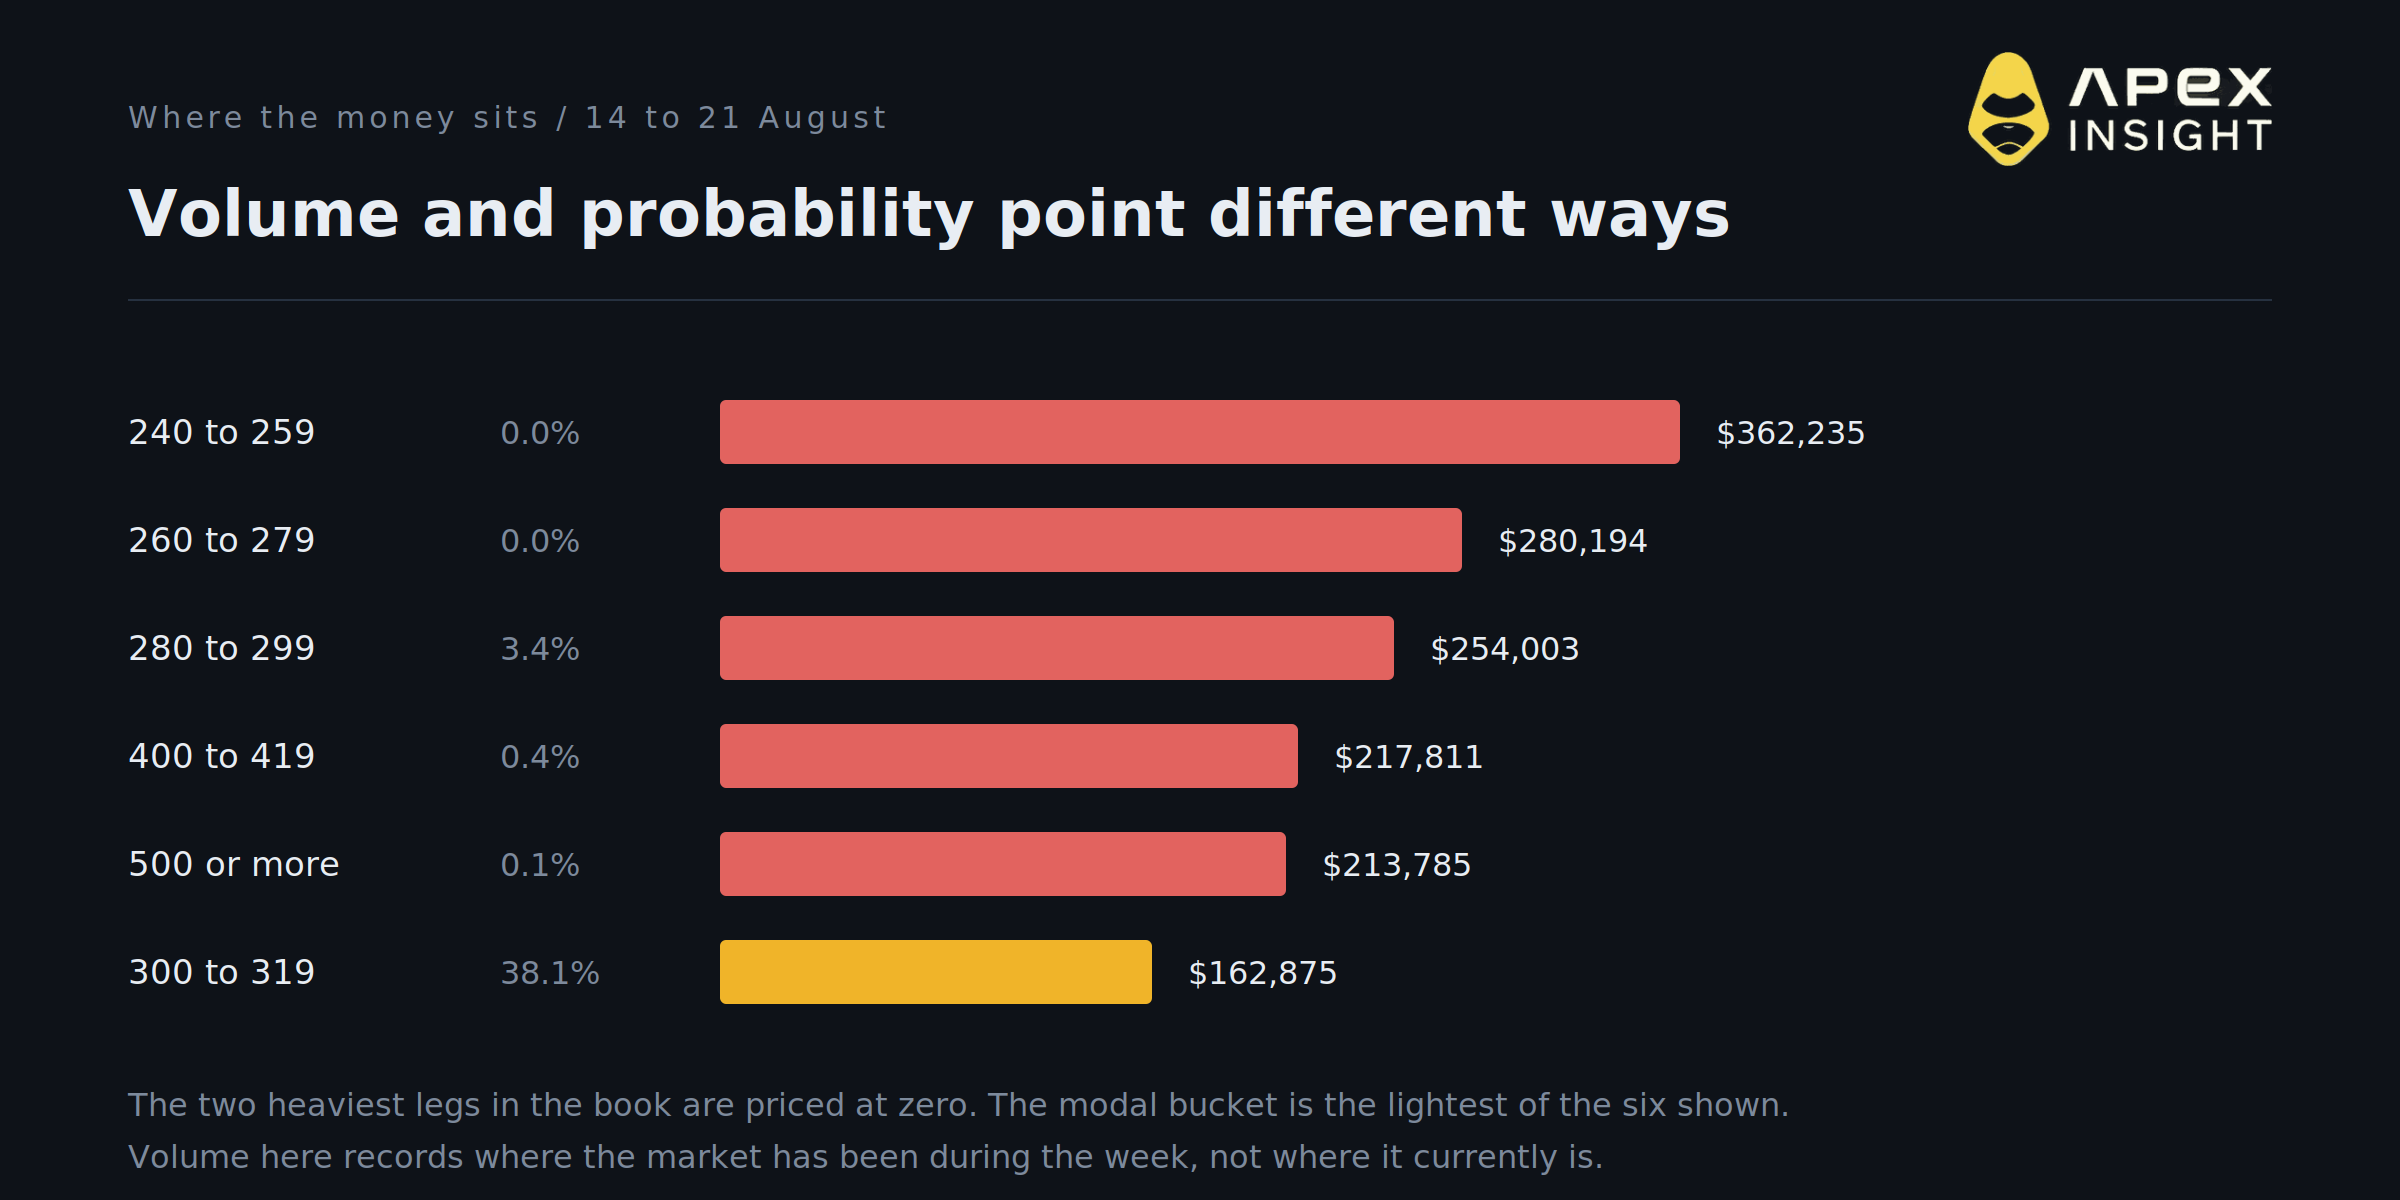
The heaviest single leg in the current week's book is 240 to 259, carrying $362.2K. It prices at zero. The second heaviest, 260 to 279 at $280.2K, also prices at zero.
Meanwhile the modal bucket at 38.1 percent carries $162.9K, less than half the volume of a leg that can no longer happen.
This is the clearest illustration in the series of a point that recurs everywhere: traded volume is a historical record of where the price has travelled, not a measure of current conviction. Early in the week those buckets were live, and the money that traded through them stays on the ledger after the probability has left.
7. The buckets sum above 100, and that is the spread
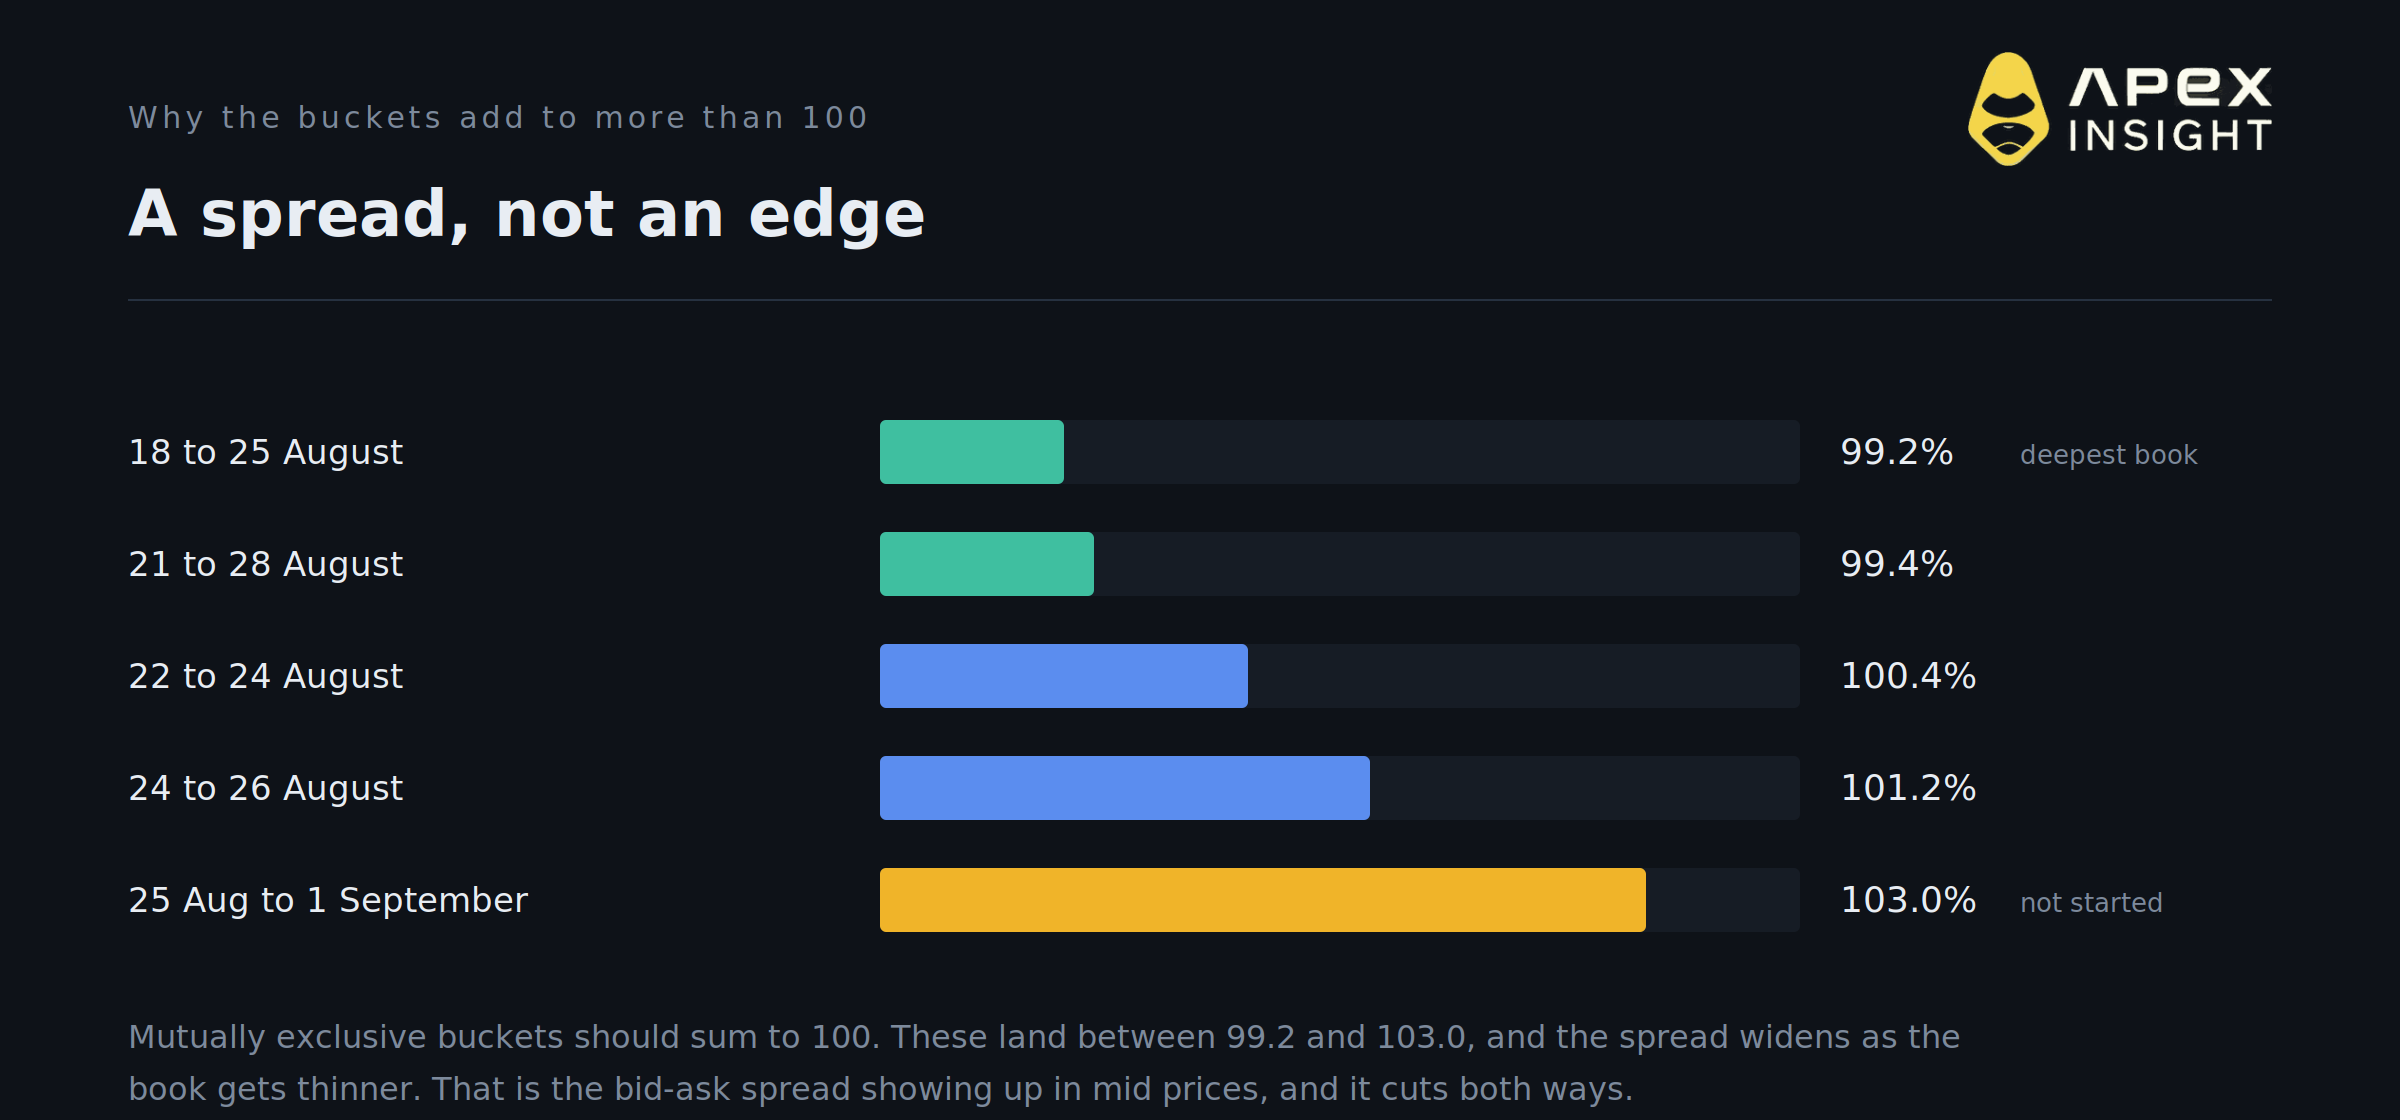
Mutually exclusive buckets should sum to 100. The deepest book, 18 to 25 August, sums to 99.2. The 21 to 28 August book sums to 99.4, the three-day books to 100.4 and 101.2, and the not-yet-started 25 August to 1 September book to 103.0.
The deviation widens as the book gets thinner and it cuts both ways, which tells you what it is: the bid-ask spread showing up in mid prices. It is not an arbitrage and it is not an error.
Worth internalising, because the next point looks superficially identical and is not.
8. Two books genuinely do not add up
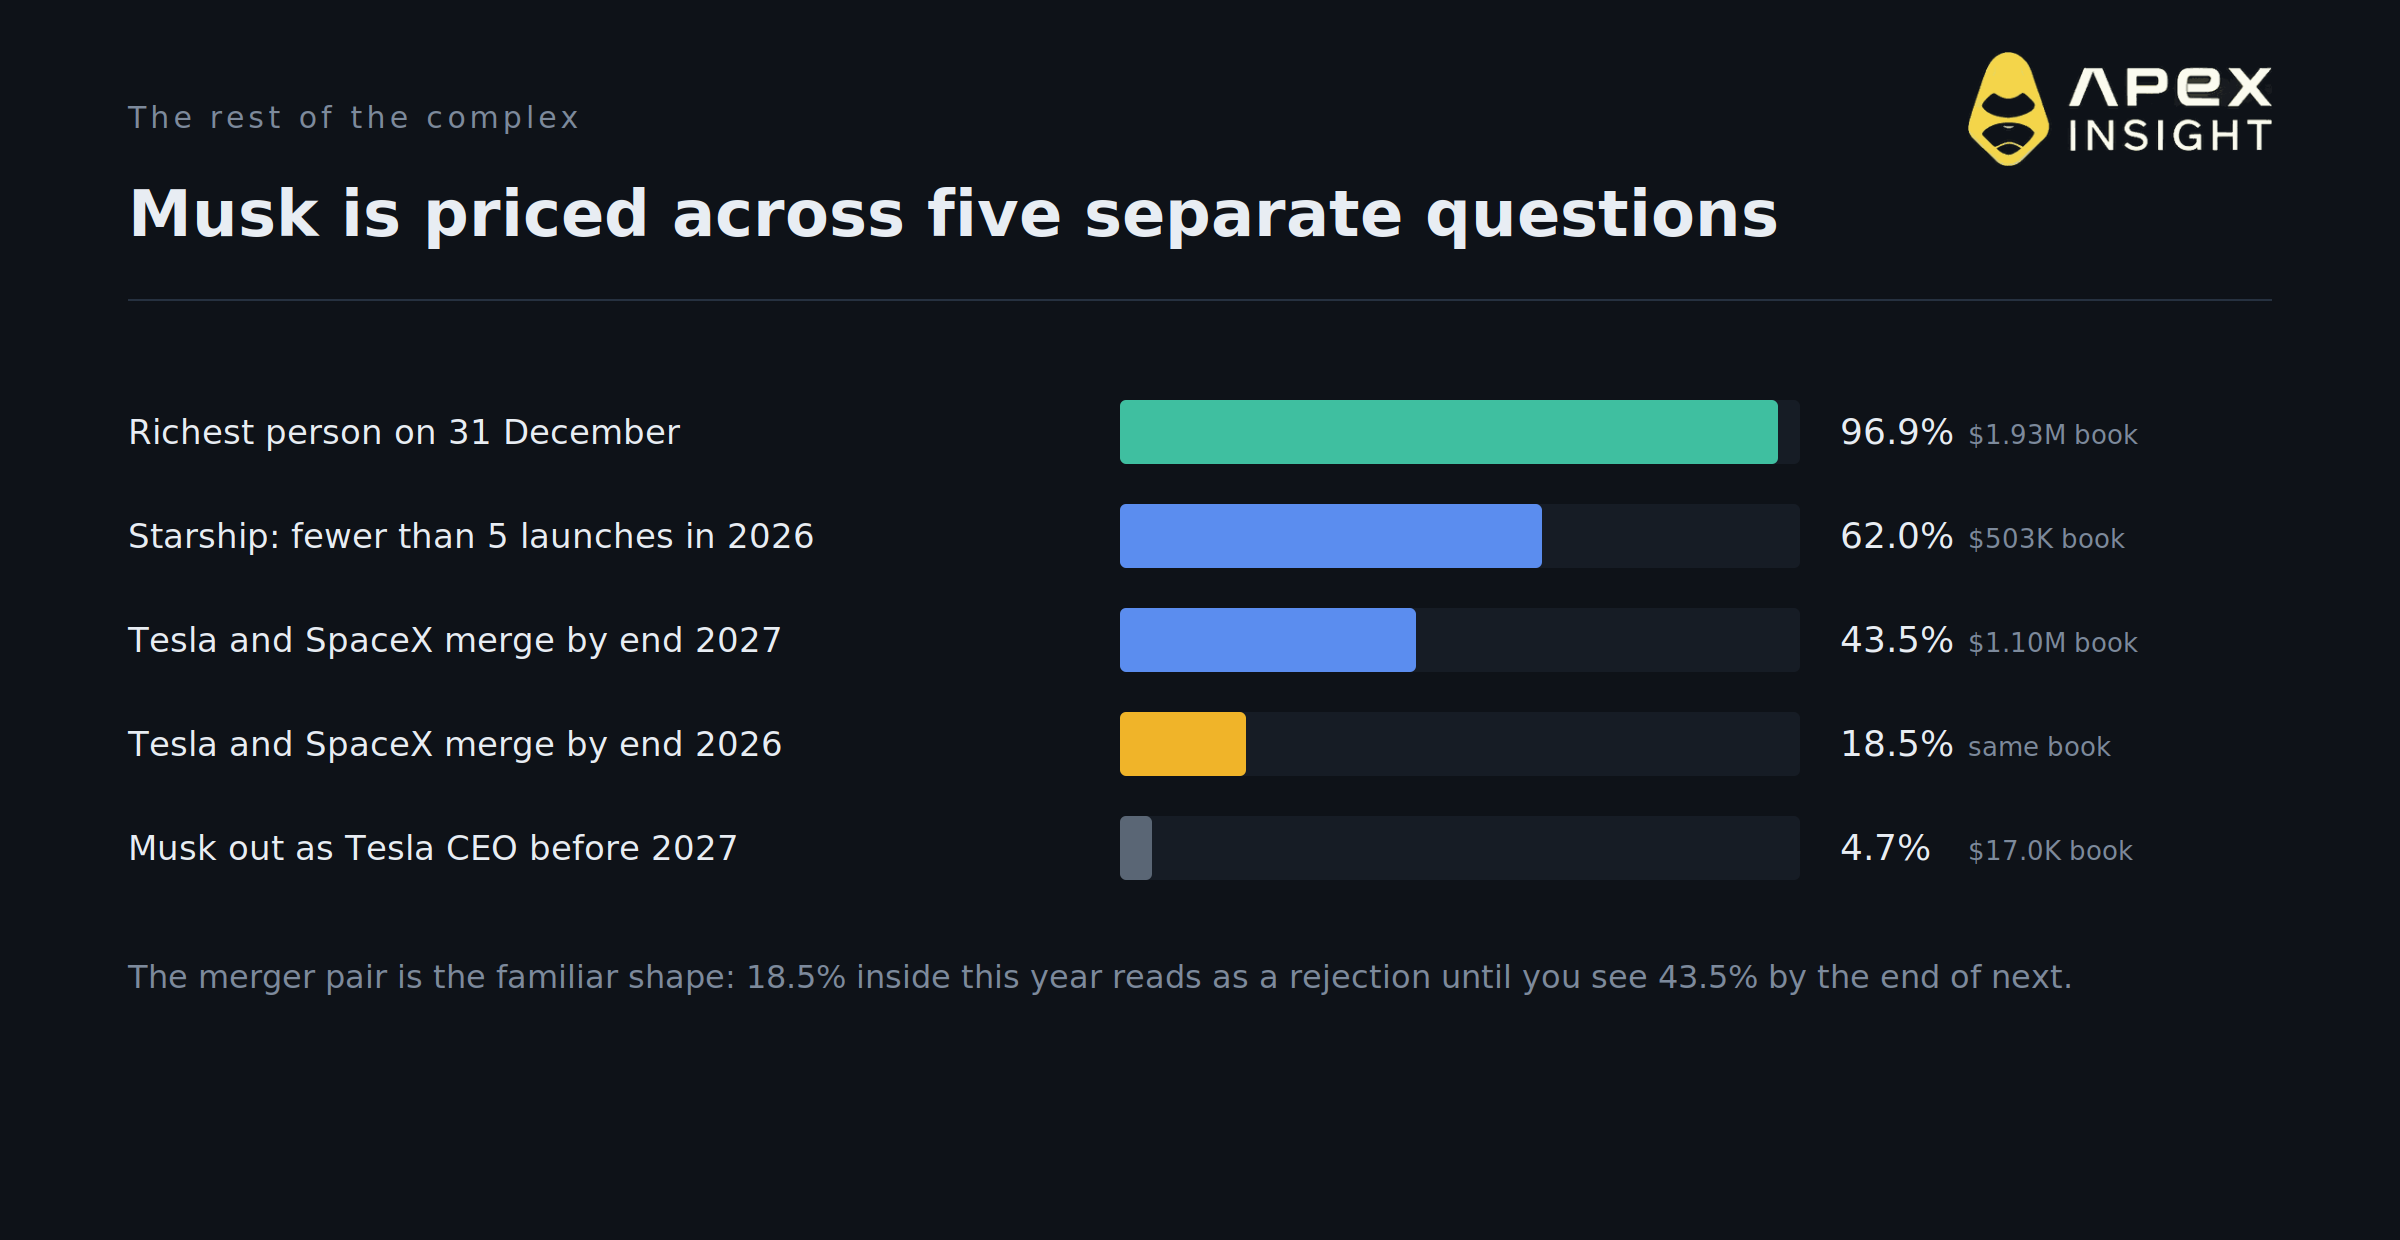
The October post-count book has the same 46-bucket structure as the August one and sums to 260.5 percent. The second-richest-person book, where exactly one of ten named people can win, sums to 249.2 percent.
Both are built identically to books that price correctly. The difference is volume: the October book carries $1,600 in total and most of its buckets have never traded at all, so every one still sits at its opening quote with nothing arbitraging it back toward 100.
The habit worth taking from points 7 and 8 together: when a set of exclusive outcomes overshoots, check the volume on each leg before deciding whether you have found an edge or an empty book.
9. The rest of the complex prices the same way
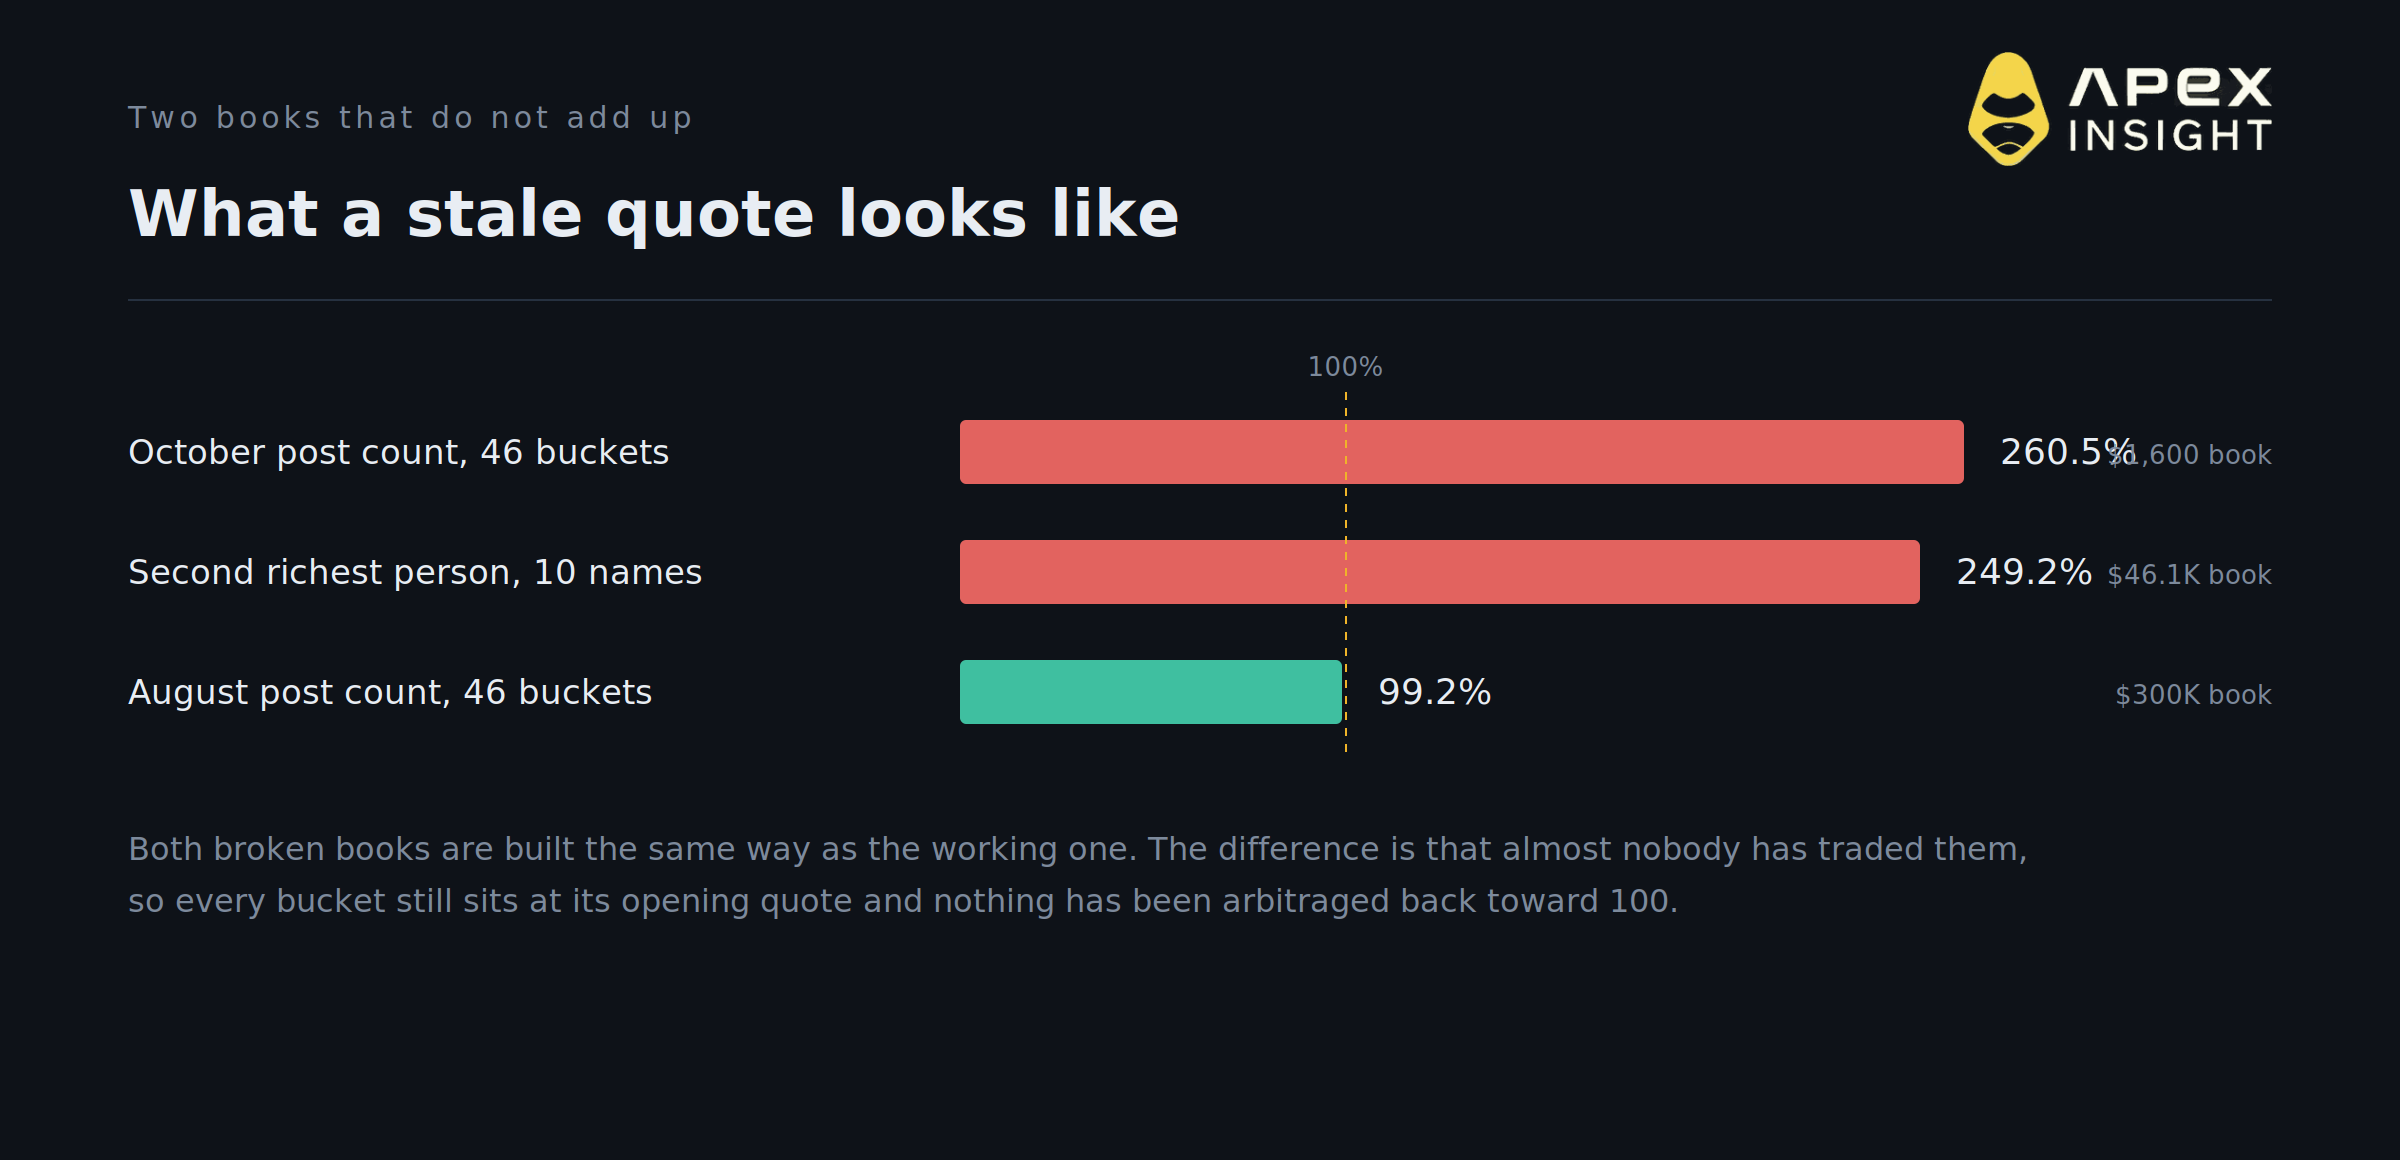
Musk being the richest person on 31 December prices at 96.9 percent on a $1.93M book. Starship reaching fewer than five launches in 2026 prices at 62 percent, with five or six at 29.5 percent. Musk being out as Tesla CEO before 2027 prices at 4.7 percent.
The Tesla and SpaceX merger book is the familiar shape. By 30 September 2026 it prices at 6.2 percent, by 31 December 2026 at 18.5 percent, by 30 June 2027 at 32.5 percent and by 31 December 2027 at 43.5 percent.
Read alone, the 18.5 percent looks like a rejection. Read across the expiries it is a schedule, exactly as with the Base token and the CLARITY Act. That pattern has now appeared in four separate articles in this series on four unrelated subjects, which is a reasonable argument for it being the default reading rather than a special case.
10. Why these are the best calibration test available

Four things make these books unusual. There is no interpretation risk, because the outcome is a count. There is high frequency, because a new window opens every few days. There are overlapping windows, so the same variable is priced at several ages at once. And depth sits on the near expiry rather than the far one, which is the same pattern as everywhere else.
Put together, that makes them the only place on the board where you can actually check whether prices are well calibrated. A market that says 38.1 percent should be right about 38.1 percent of the time, and with a new resolution every few days you accumulate a sample fast enough to test it.
Everything else on the board resolves too slowly or too rarely to grade. These resolve on Fridays.
What this adds up to
The Musk post-count books look like the least serious markets available and are among the most useful. They demonstrate variance collapse in a way no slow-resolving market can, they separate spread from mispricing cleanly, and they show why volume is a poor proxy for conviction.
The wider complex repeats the lessons of the rest of this series. The merger ladder is a schedule rather than a rejection. The October and second-richest books show what an untraded quote looks like next to a normal spread. And the heaviest legs in the busiest book are priced near zero.
If you want to know whether you are any good at reading probabilities, these are the markets that will tell you within a week rather than within a year.
Where to watch it
Every market in this article is live on ApeX Omni, where Polymarket's order books are integrated directly: the same liquidity and the same settlement source, minus the KYC. The board shows the full bucket distribution and the volume behind each one, which is what makes it possible to watch a distribution tighten in real time rather than only seeing the headline number.
We appreciate your continued support.
Published by ApeX. For informational and educational purposes only. Not investment advice, and not a forecast or endorsement of any outcome. Trading involves risk, including total loss.