




Oil has been at war for most of 2026, and the market has spent those months arguing about one number: how much of the price is fear rather than barrels.
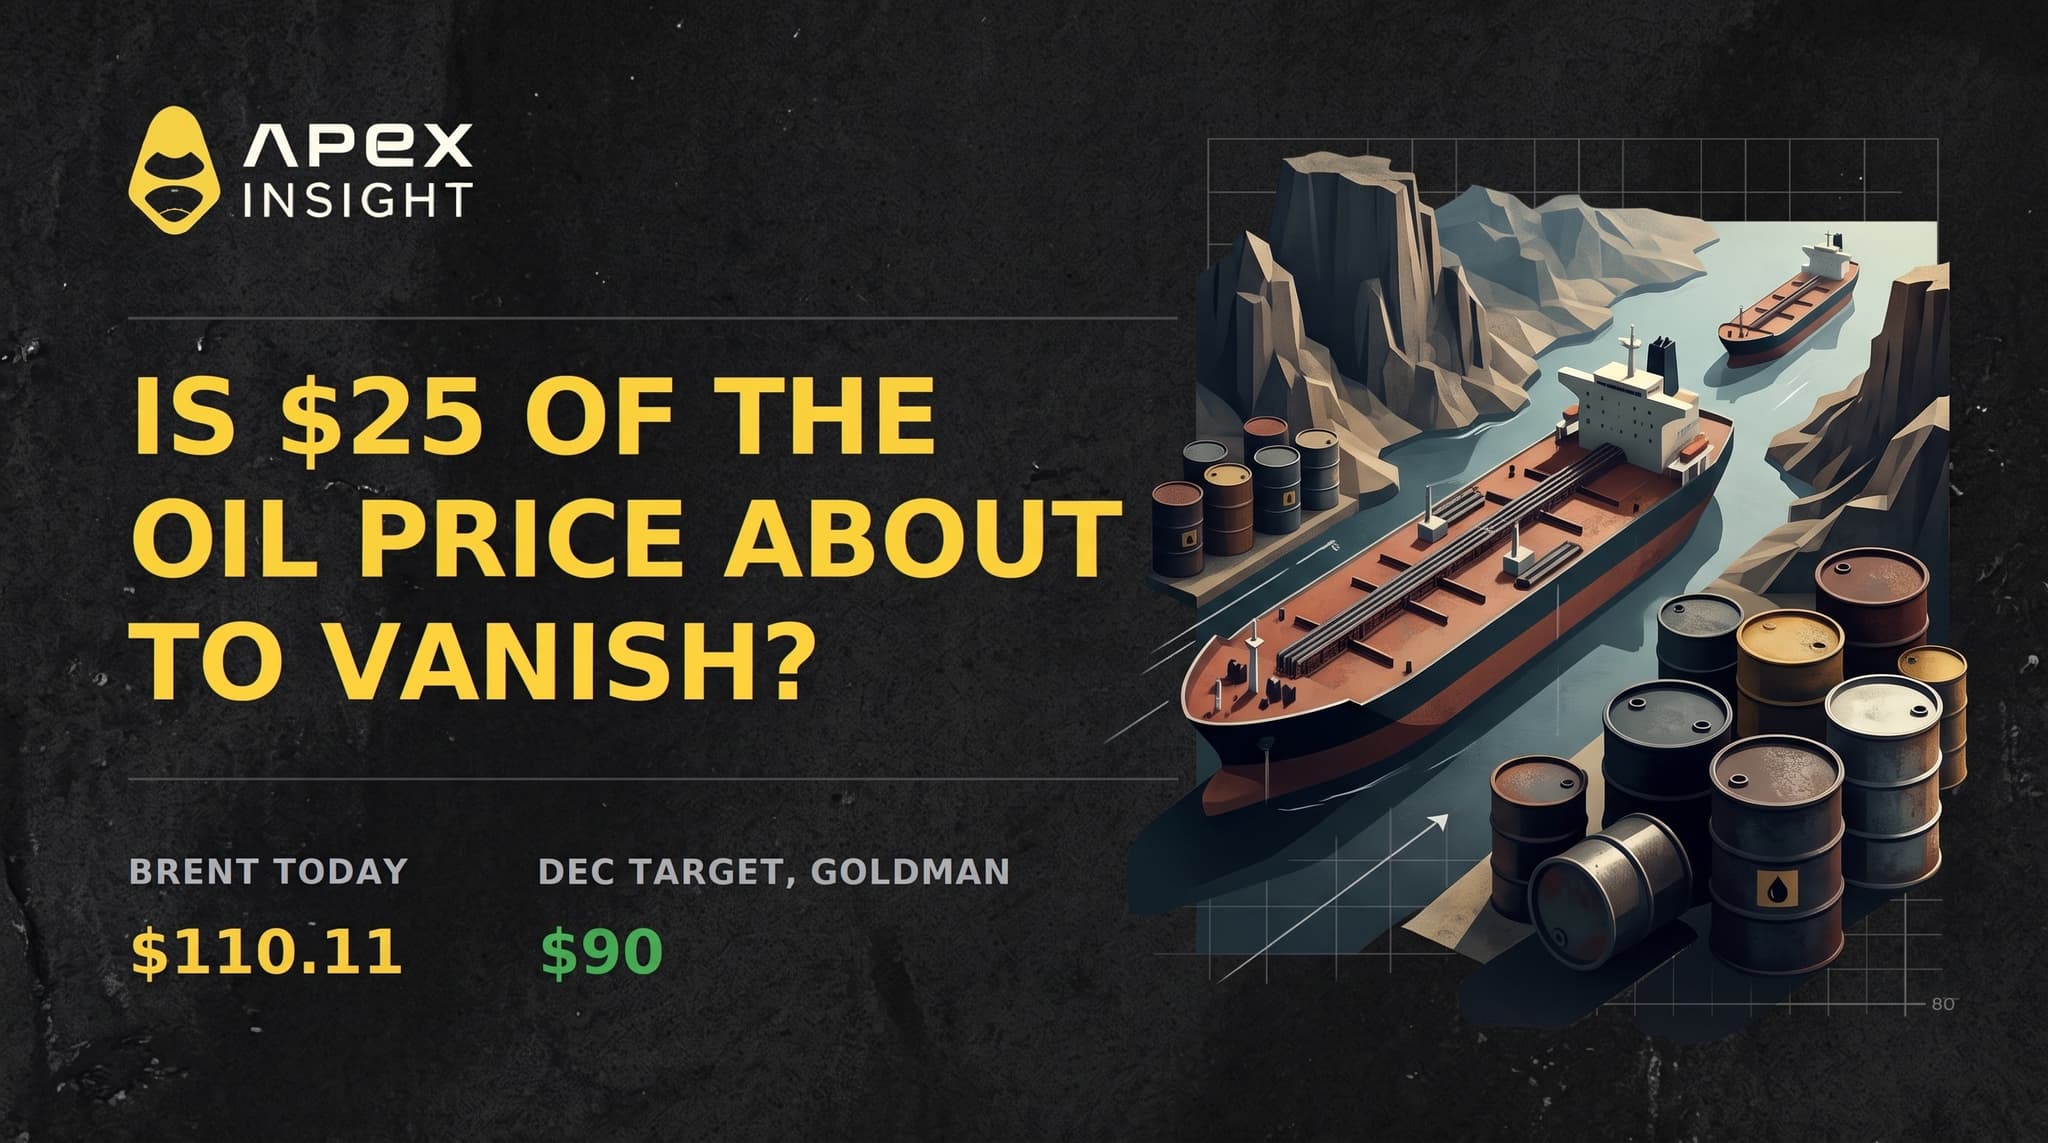
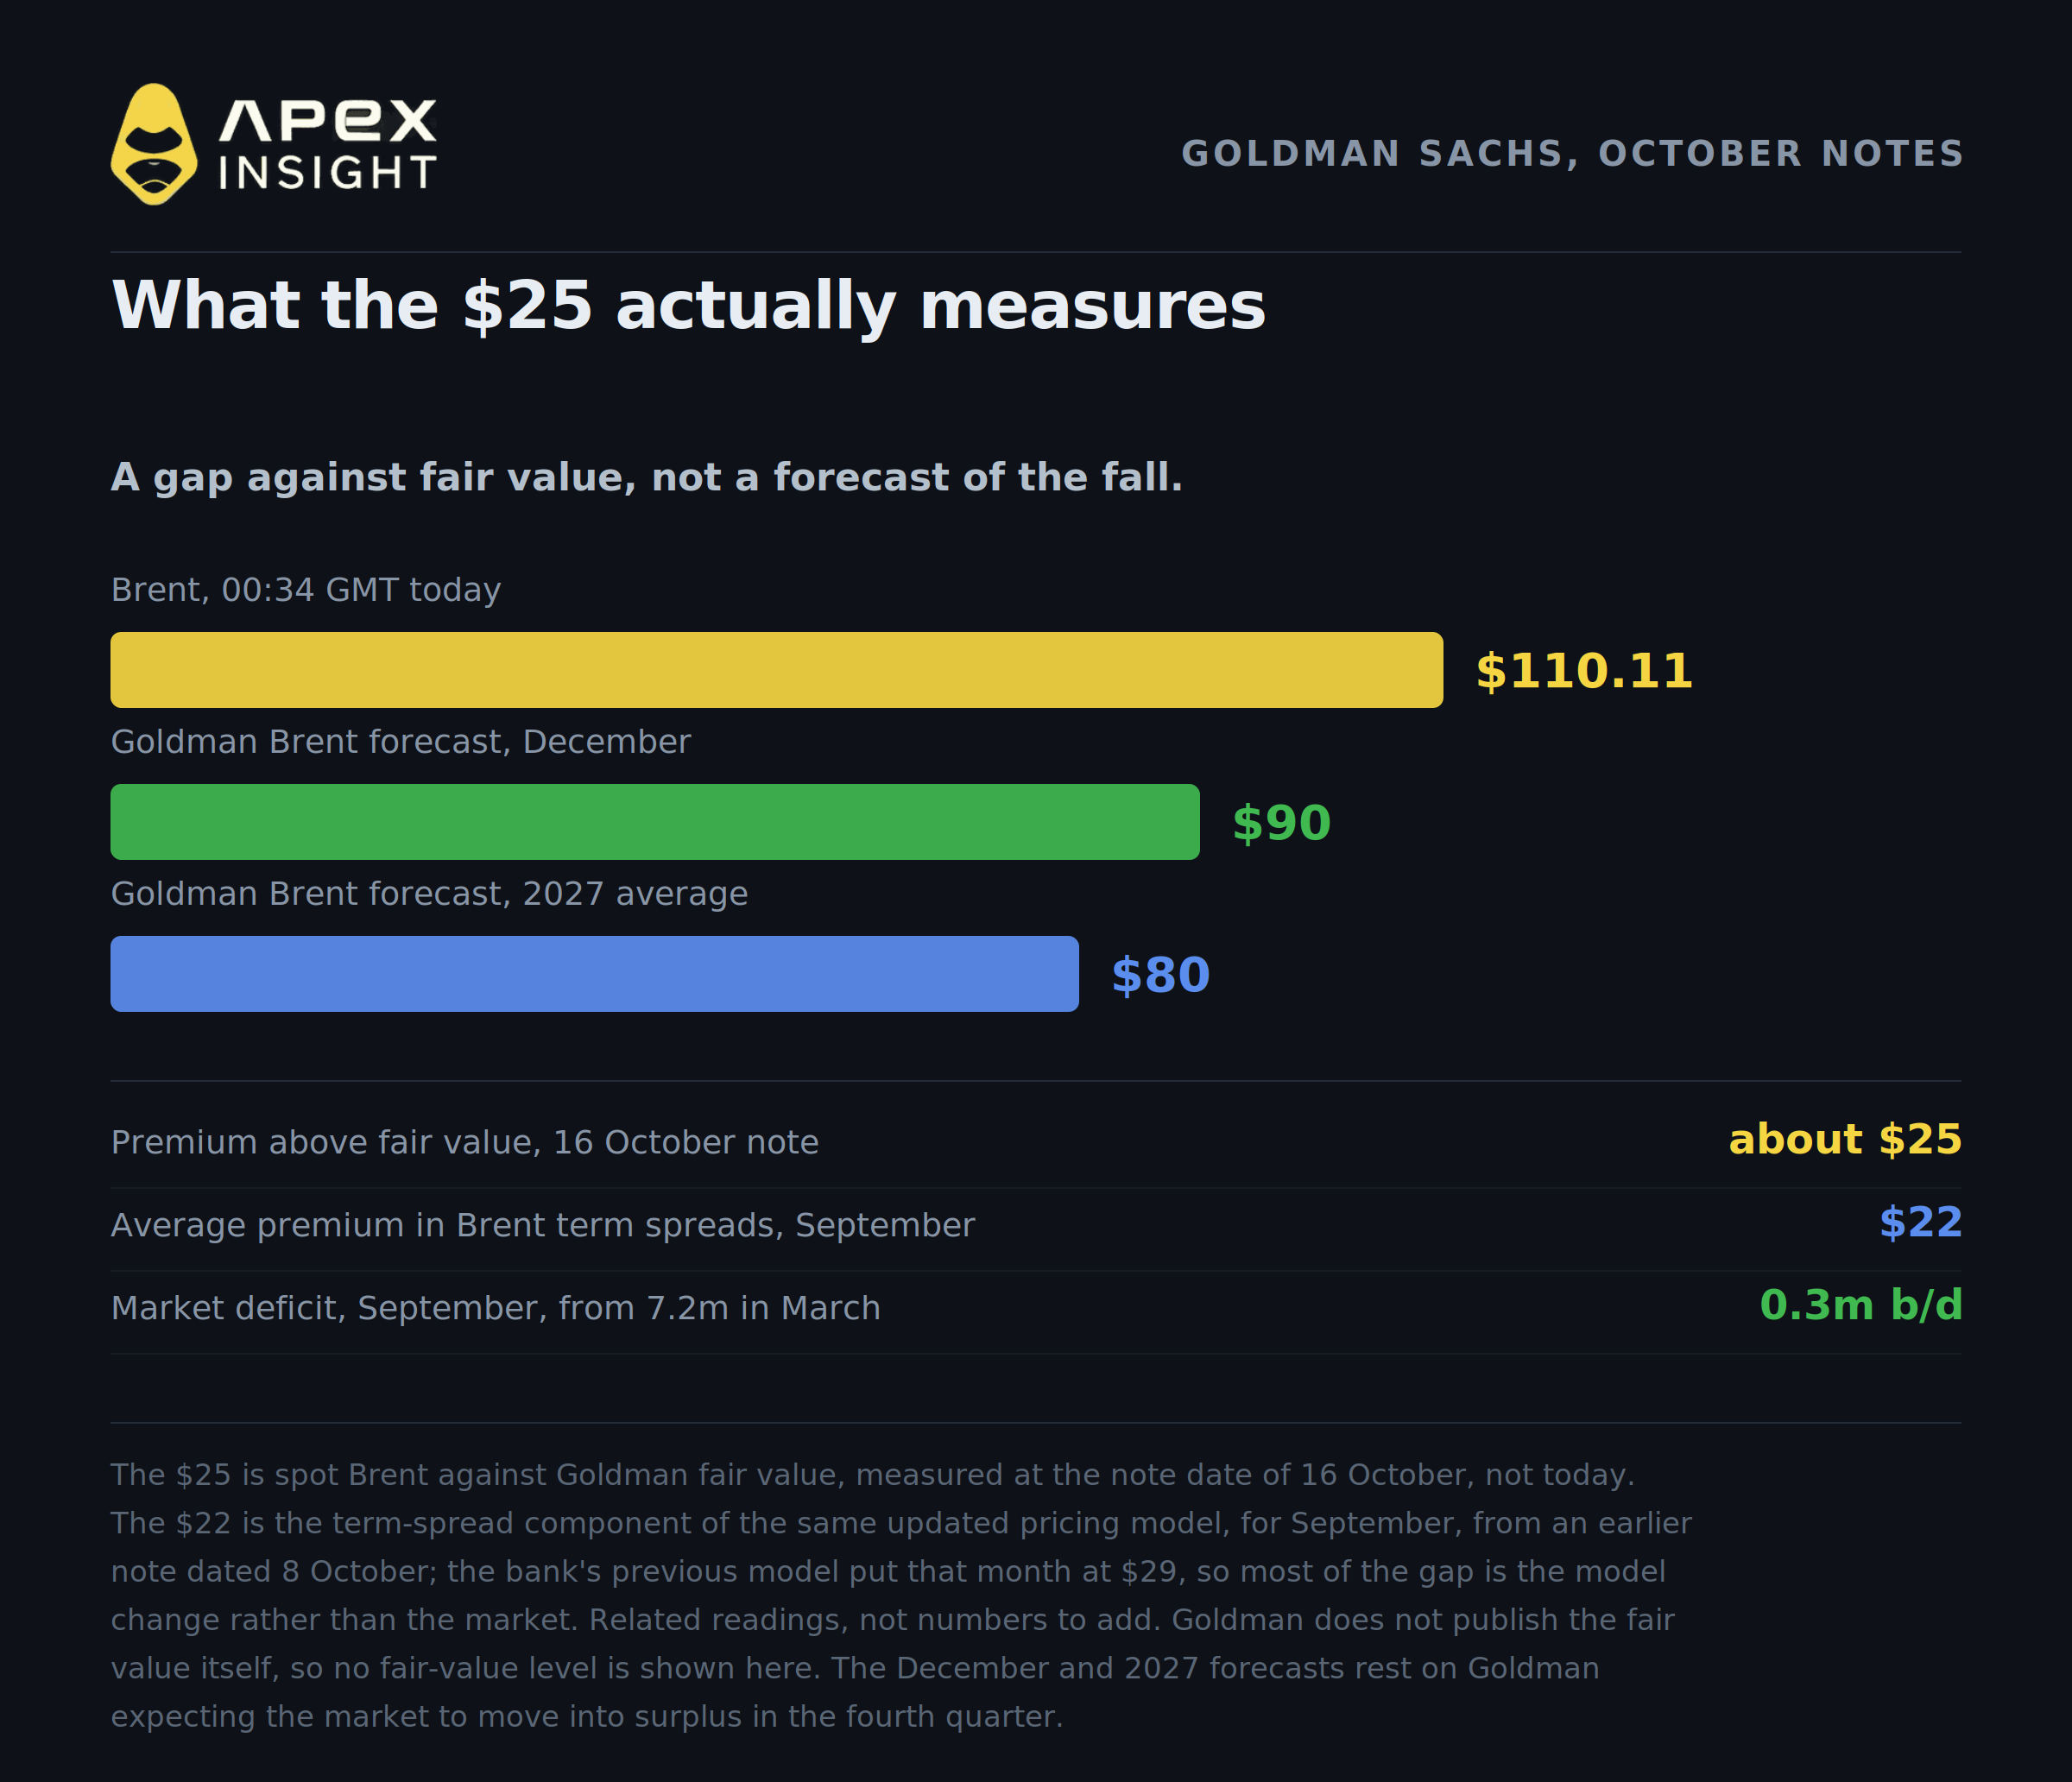
Last week a bank finally published a figure. In a note dated 16 October, Goldman Sachs estimated that spot Brent was carrying a risk premium of nearly $25 a barrel above its estimate of fair value. The same note raised Goldman's December Brent forecast to $90, from $85, and put 2027 at $80.
Brent was at $110.11 and WTI at $98.12 at 00:34 GMT this morning, and Brent kept climbing through the session, passing $112 by mid-morning after further attacks in Saudi Arabia. If Goldman is right, close to a quarter of the barrel you are looking at is priced on things that have not happened yet.
Here are five things to understand before deciding whether that premium survives the winter.
1. The $25 is a gap, not a forecast, and there is a second number people keep confusing with it
Goldman's $25 is the distance between the spot Brent price and the bank's own model of fair value. It is a measure of disagreement, not a prediction that $25 is about to disappear.
The research is led by Daan Struyven, co-head of global commodities research at Goldman Sachs, and the reasoning is that the premium reflects the risk of further supply curtailment and inventory draws if the war escalates from here. It is insurance against a worse future, priced into today's barrel.
There is a second Goldman figure in circulation and it is not the same thing. An earlier note, dated 8 October, put the average risk premium embedded in Brent futures term spreads during September at $22 a barrel, the second-highest monthly level on record behind April of this year. That figure comes from the term-spread component of Goldman's updated pricing model, not from a separate school of thought, and the bank's previous model put the same month at $29. So it is a different slice of the same framework, measured over a different period, and the gap between $29 and $22 is mostly the model change rather than the market. Treat the two figures as related readings, not as numbers to add together.
What makes the $25 interesting is the forecast sitting beside it. December is under six weeks away and Goldman has Brent at $90. That is the bank telling you it expects most of this premium to drain, and soon.
The reason it gives is a balance that is closing. Goldman has the market deficit narrowing to 0.3 million barrels a day in September, from 7.2 million in March, and expects the market to move into surplus in the fourth quarter and stay there through 2027. That projected surplus is the main driver of both the $90 and the $80. Hold on to it, because the IEA does not agree, and that disagreement is the whole trade.
2. The shortage is healing, but it has not healed
This is the part that should unsettle anyone who is long oil purely because of Hormuz, and it is also the part most commentary gets wrong in both directions.
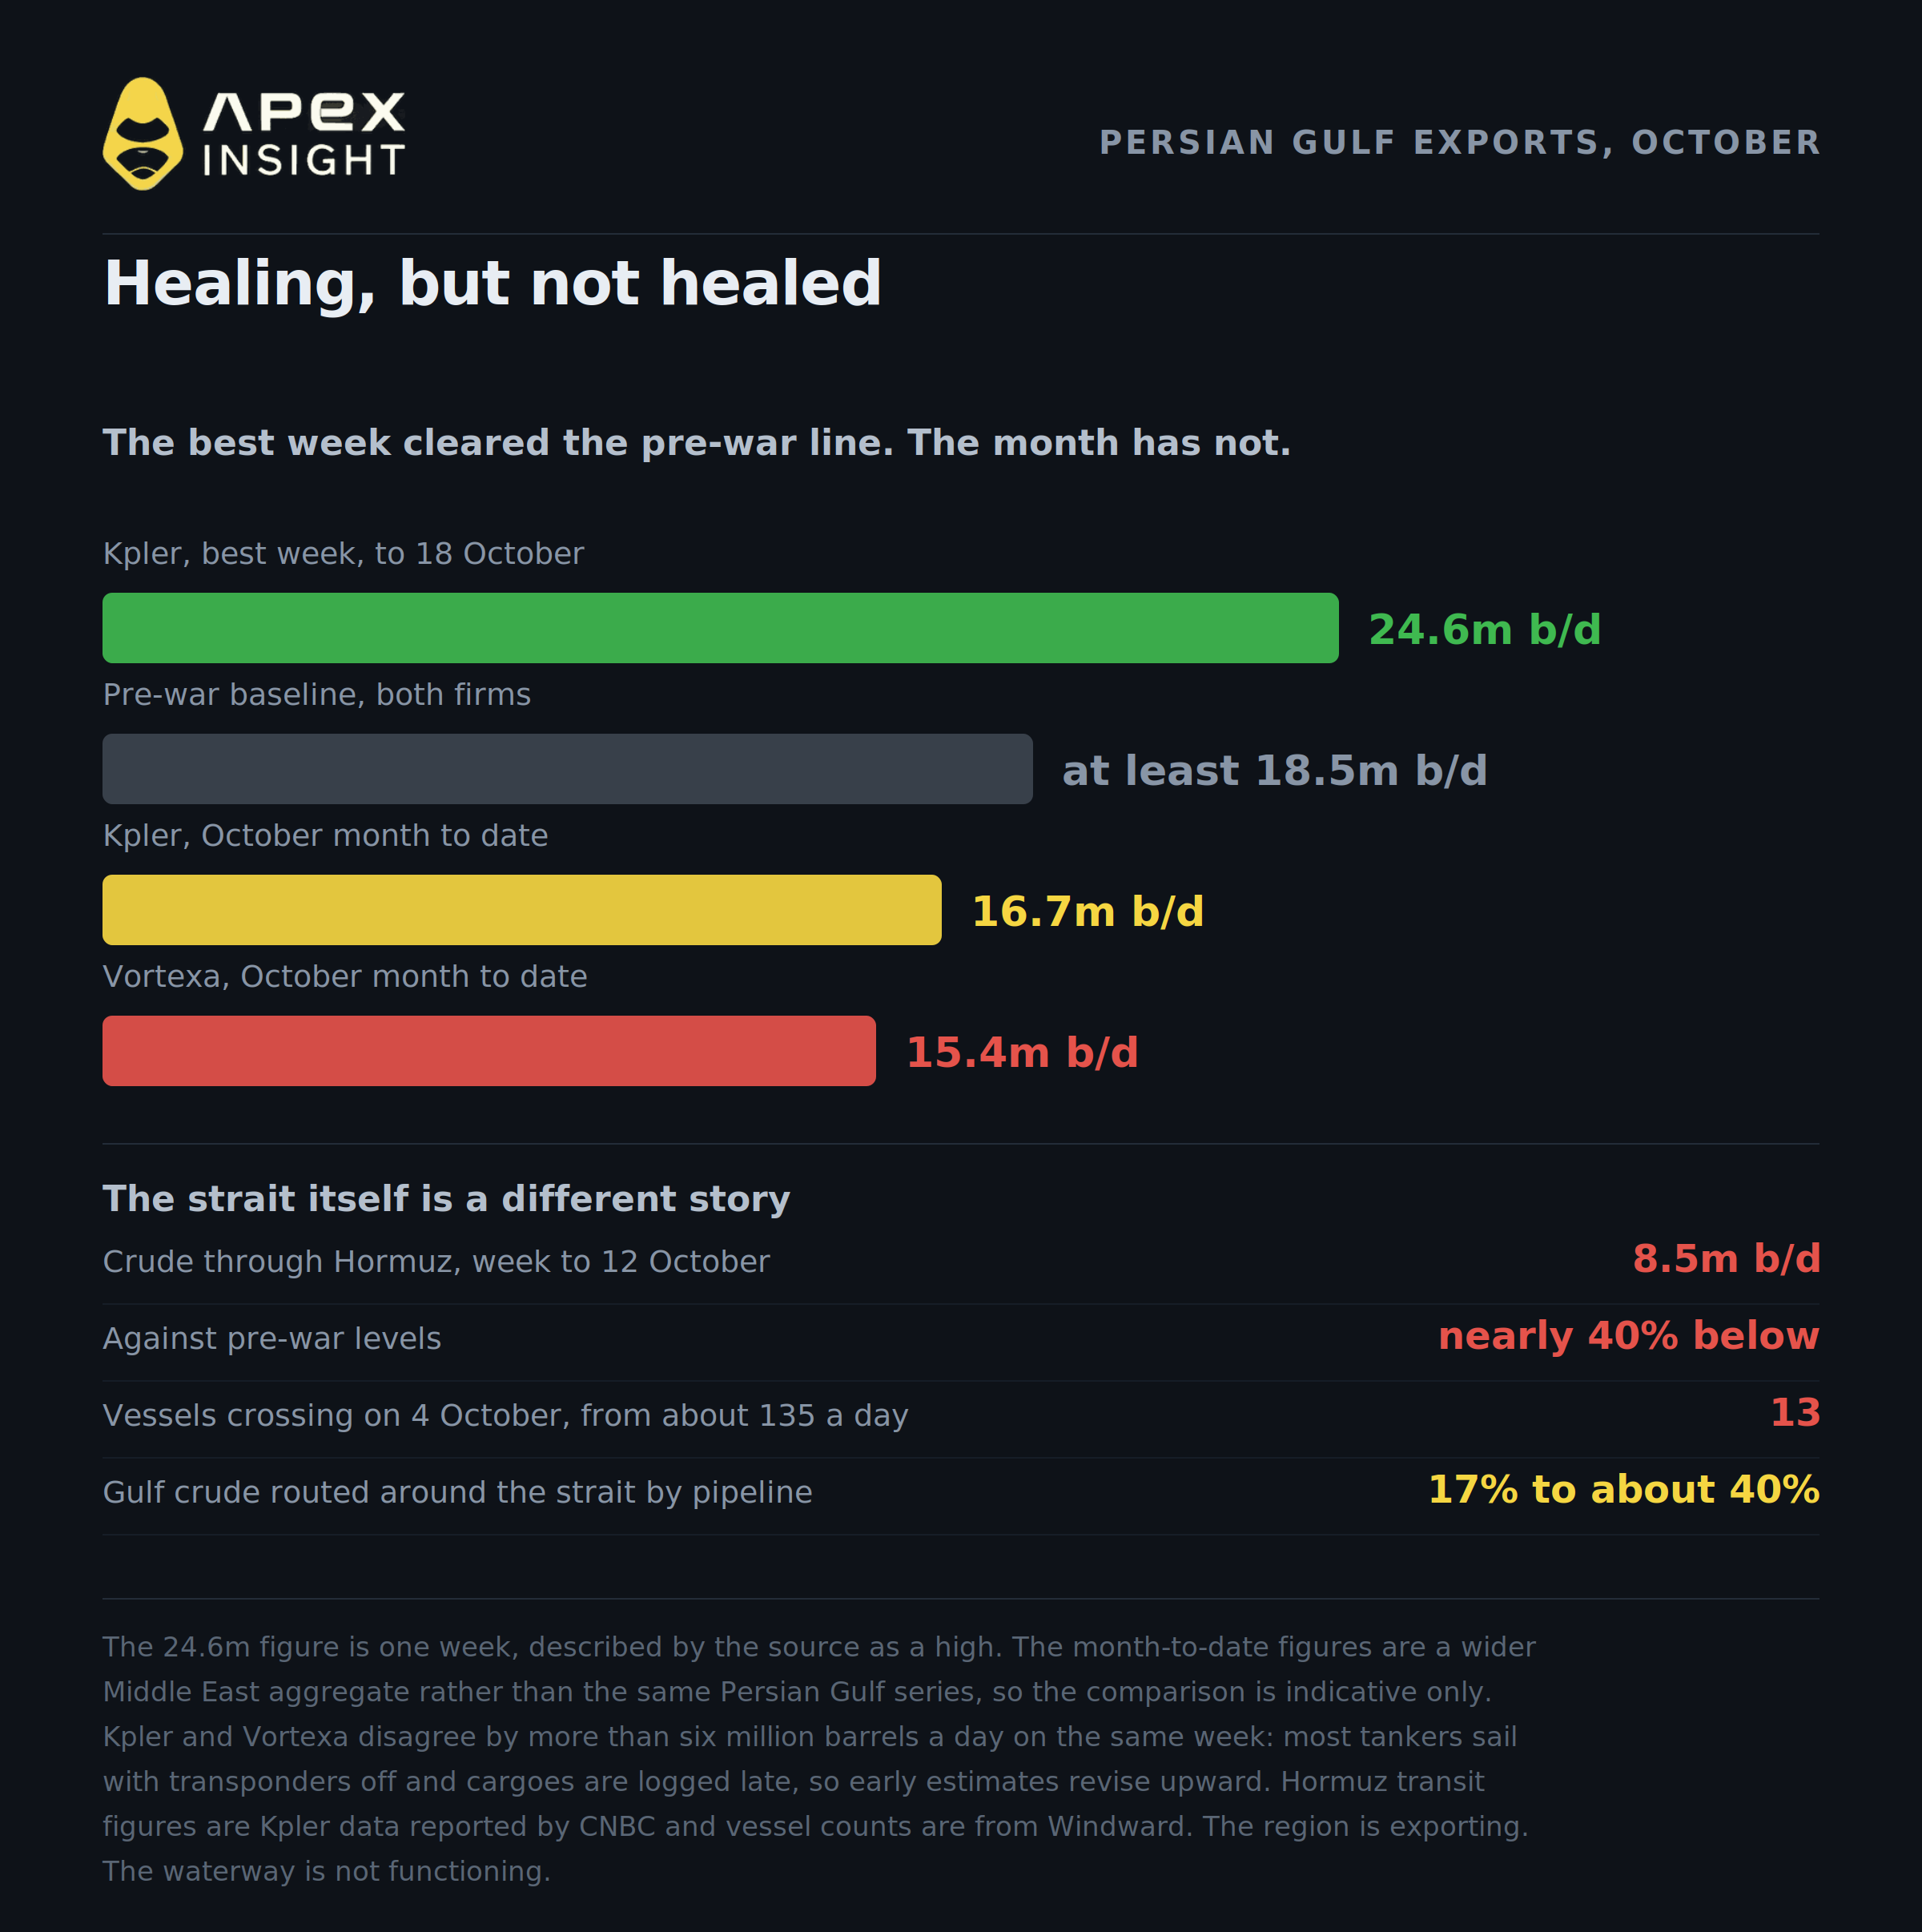
Start with the good week. In the seven days to 18 October, Kpler put Persian Gulf crude and condensate exports at 24.6 million barrels a day, a weekly high. Vortexa, measuring the same seven days, put it at 18.0 million. Both firms place the pre-war baseline at a minimum of 18.5 million.
Now the month. From the same report, October to date runs at 16.7 million barrels a day on Kpler's numbers and 15.4 million on Vortexa's, and the source states that both are below pre-war levels. Note that these are a wider Middle East aggregate rather than the Persian Gulf crude and condensate measure used for the weekly figure, so they are not strictly the same series. The 24.6 million was a weekly high, not a running rate.
And the strait itself is a different story again from the region. Crude exports through Hormuz specifically averaged about 8.5 million barrels a day in the week to 12 October, nearly 40% below pre-war levels, on Kpler data reported by CNBC. Windward counted 13 vessels crossing on 4 October against roughly 135 a day before the war. The region is exporting. The waterway is not functioning.
So the accurate statement is narrower than the headlines on either side. Flows have recovered a long way from March, when the market deficit was running at 7.2 million barrels a day. They have not fully recovered, and the recovery has come from going around the problem rather than solving it. Goldman's own wording is that Gulf exports have recovered to roughly their 2025 average since late September.
The two trackers disagree by more than six million barrels a day on the same week, which tells you how hard this is to measure. Most tankers in the region sail with their transponders off, and cargoes get logged days late, so early estimates revise upward.
The mechanism behind the recovery is rerouting rather than resolution. Kpler's data shows Saudi and Emirati pipelines now move roughly 40% of Gulf crude around the strait, against 17% before the war. The oil is reaching the market. It is simply taking a longer and more expensive road.
Morgan Stanley analysts including Martijn Rats put the tension plainly, noting that attacks on merchant vessels around the strait have increased sharply in recent weeks while "oil flow through the strait has remained relatively resilient."
So the barrels are largely moving. The premium is not mainly about barrels.
3. Shipping a barrel costs about $20 a barrel more than it did, and only $7 of that is the strait
A second piece of Goldman work, reported this morning, explains where a large part of the cost actually lives.
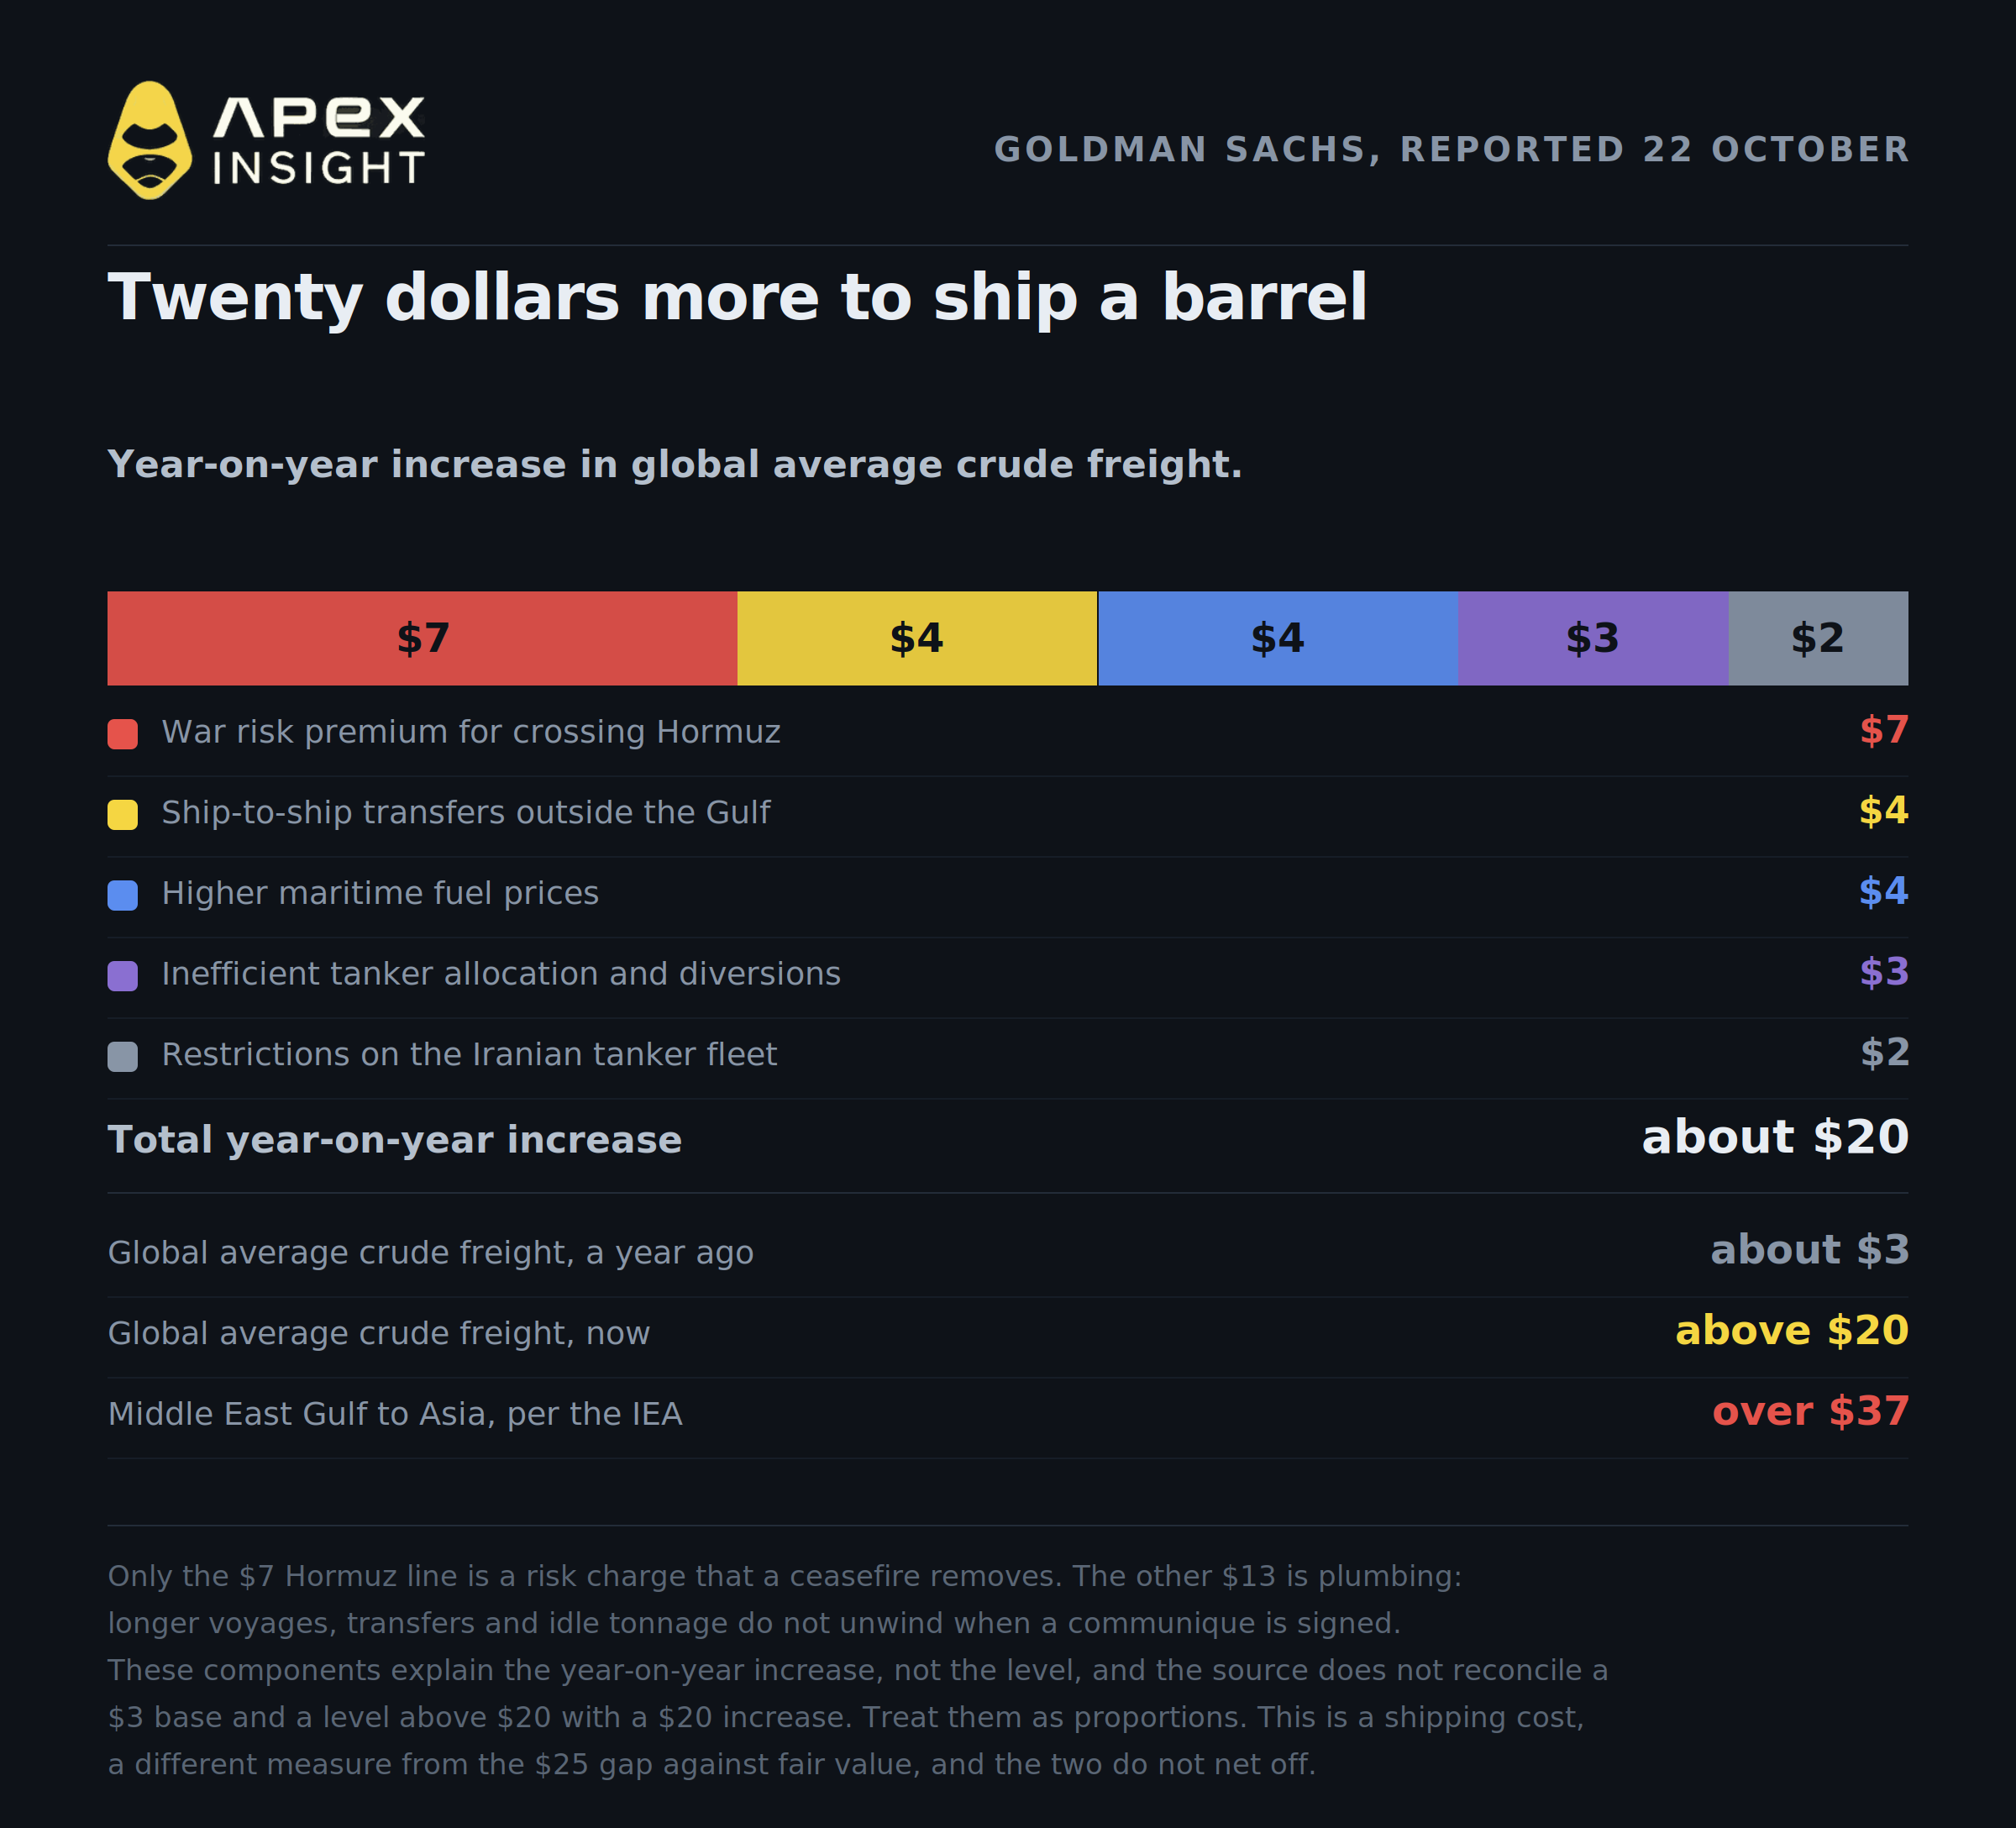
The global average crude freight rate has risen to above $20 a barrel, from about $3 a year ago, roughly seven times higher. Goldman attributes a $20 a barrel year-on-year increase to five factors:
Component of the increase | Per barrel |
|---|---|
War risk premium for crossing Hormuz | $7 |
Ship-to-ship transfers outside the Gulf | $4 |
Higher maritime fuel prices | $4 |
Inefficient tanker allocation and diversions | $3 |
Restrictions on the Iranian tanker fleet | $2 |
Two cautions before anyone does arithmetic with these numbers.
First, this is a decomposition of the increase, not of the rate. The source gives a $3 base and a level above $20, which is a rise of roughly $17 rather than $20, and it does not reconcile the two. Treat the components as a guide to proportions rather than an exact ledger.
Second, this is a shipping cost, and the $25 above is a gap against Goldman's fair value for the Brent price. They measure different things. Do not subtract one from the other, and do not read the $7 as a slice of the $25.
There is also a geography problem with the headline number. The $20 is a global average, and the route this article is about is dearer than that. The IEA puts Middle East Gulf to Asia shipping at more than $37 a barrel, over five times pre-war levels. If you are moving Gulf crude to a refinery in Asia, the global average understates your problem by nearly half.
With those caveats, the breakdown is still the most useful thing published on oil this week, because it separates what a ceasefire would fix from what it would not. The $7 Hormuz line is a risk charge that falls away the day ships stop being hit. The other $13 is plumbing. Ship-to-ship transfers, longer voyages and idle Iranian tonnage do not unwind because a communiqué gets signed. Refiners that depend on distant crude, mostly in Asia, either pass those costs on or accept thinner margins.
A risk premium can deflate overnight. A supply chain has to be rebuilt.
4. The only thing clearly coming down is tanker rates, and only from a record
If you are hunting for evidence that the fear trade is unwinding, there is one piece of it, and it is smaller than it first looks.
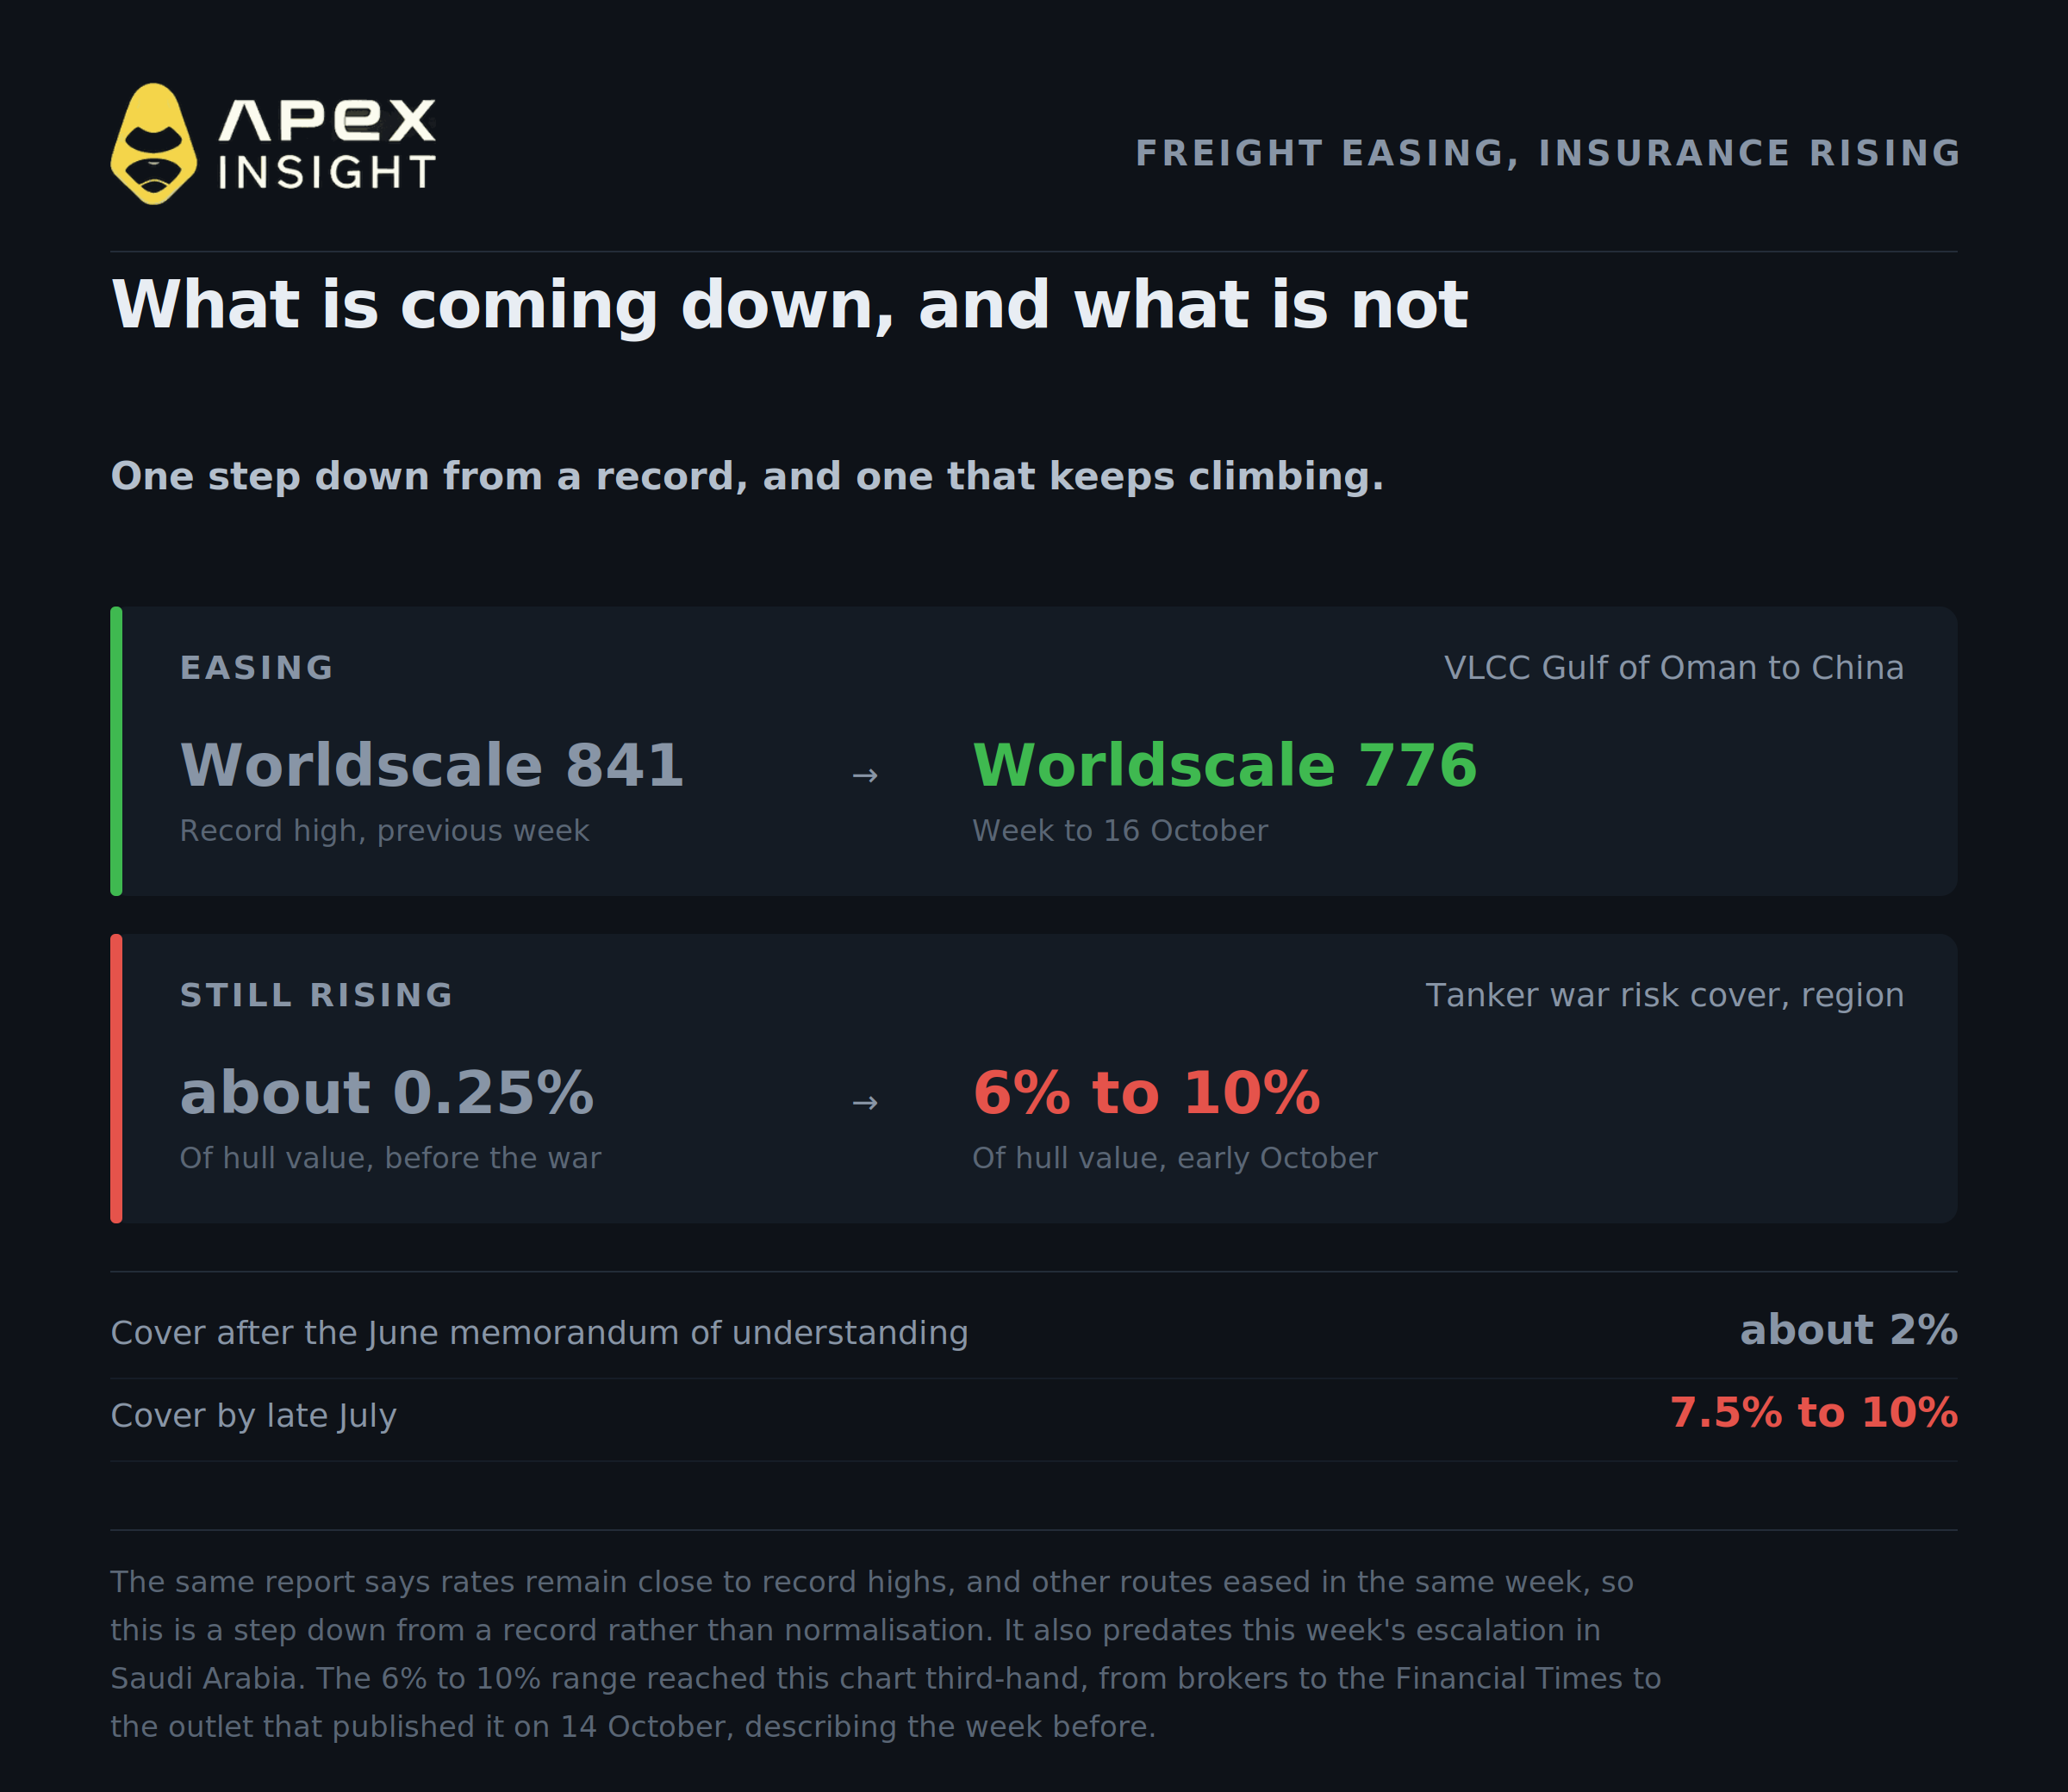
Tanker rates have come off their highs. The Gulf of Oman to China route for very large crude carriers was assessed in the week to 16 October at Worldscale 776, down from 841 the previous week, and 841 was the highest since the index launched this year. Rates eased on other routes in the same week, including West Africa to Asia. Matthew Wright at Kpler attributed the fall to demand on the Gulf of Oman route softening since the latest round of attacks.
Read the rest of that sentence before you trade it. The same report says rates remain close to record highs. A step down from the highest print ever recorded is not the same as normalisation, and two newer sources cut against it: ING described record tanker freight rates on 20 October, and the Goldman note reported this morning has the global average still above $20 a barrel. The turn is six days old and predates this week's escalation in Saudi Arabia.
Insurance, meanwhile, is moving the other way, and it is the stickier of the two. War risk cover for tankers in the region was put by brokers at 6% to 10% of hull value in reporting published on 14 October, against roughly 0.25% before the war. At those rates the same report puts the charge at as much as $20m for a single supertanker voyage into the Gulf. That is a per-voyage premium rather than an annual one, which is what makes it bite on every cargo. Underwriters are also reported to be paying out more than they take in, which is how capacity gets withdrawn rather than merely repriced.
The path matters as much as the level. Cover eased to around 2% after the June memorandum of understanding between the United States and Iran, then reached 7.5% to 10% by late July. Freight can fall in a week. Insurance reprices on renewal cycles, and it has spent this year ratcheting up.
5. The reason this premium may not deflate quickly: there is almost nothing behind it
Here is the fact that most endangers the bear case, and it rarely makes the headlines.
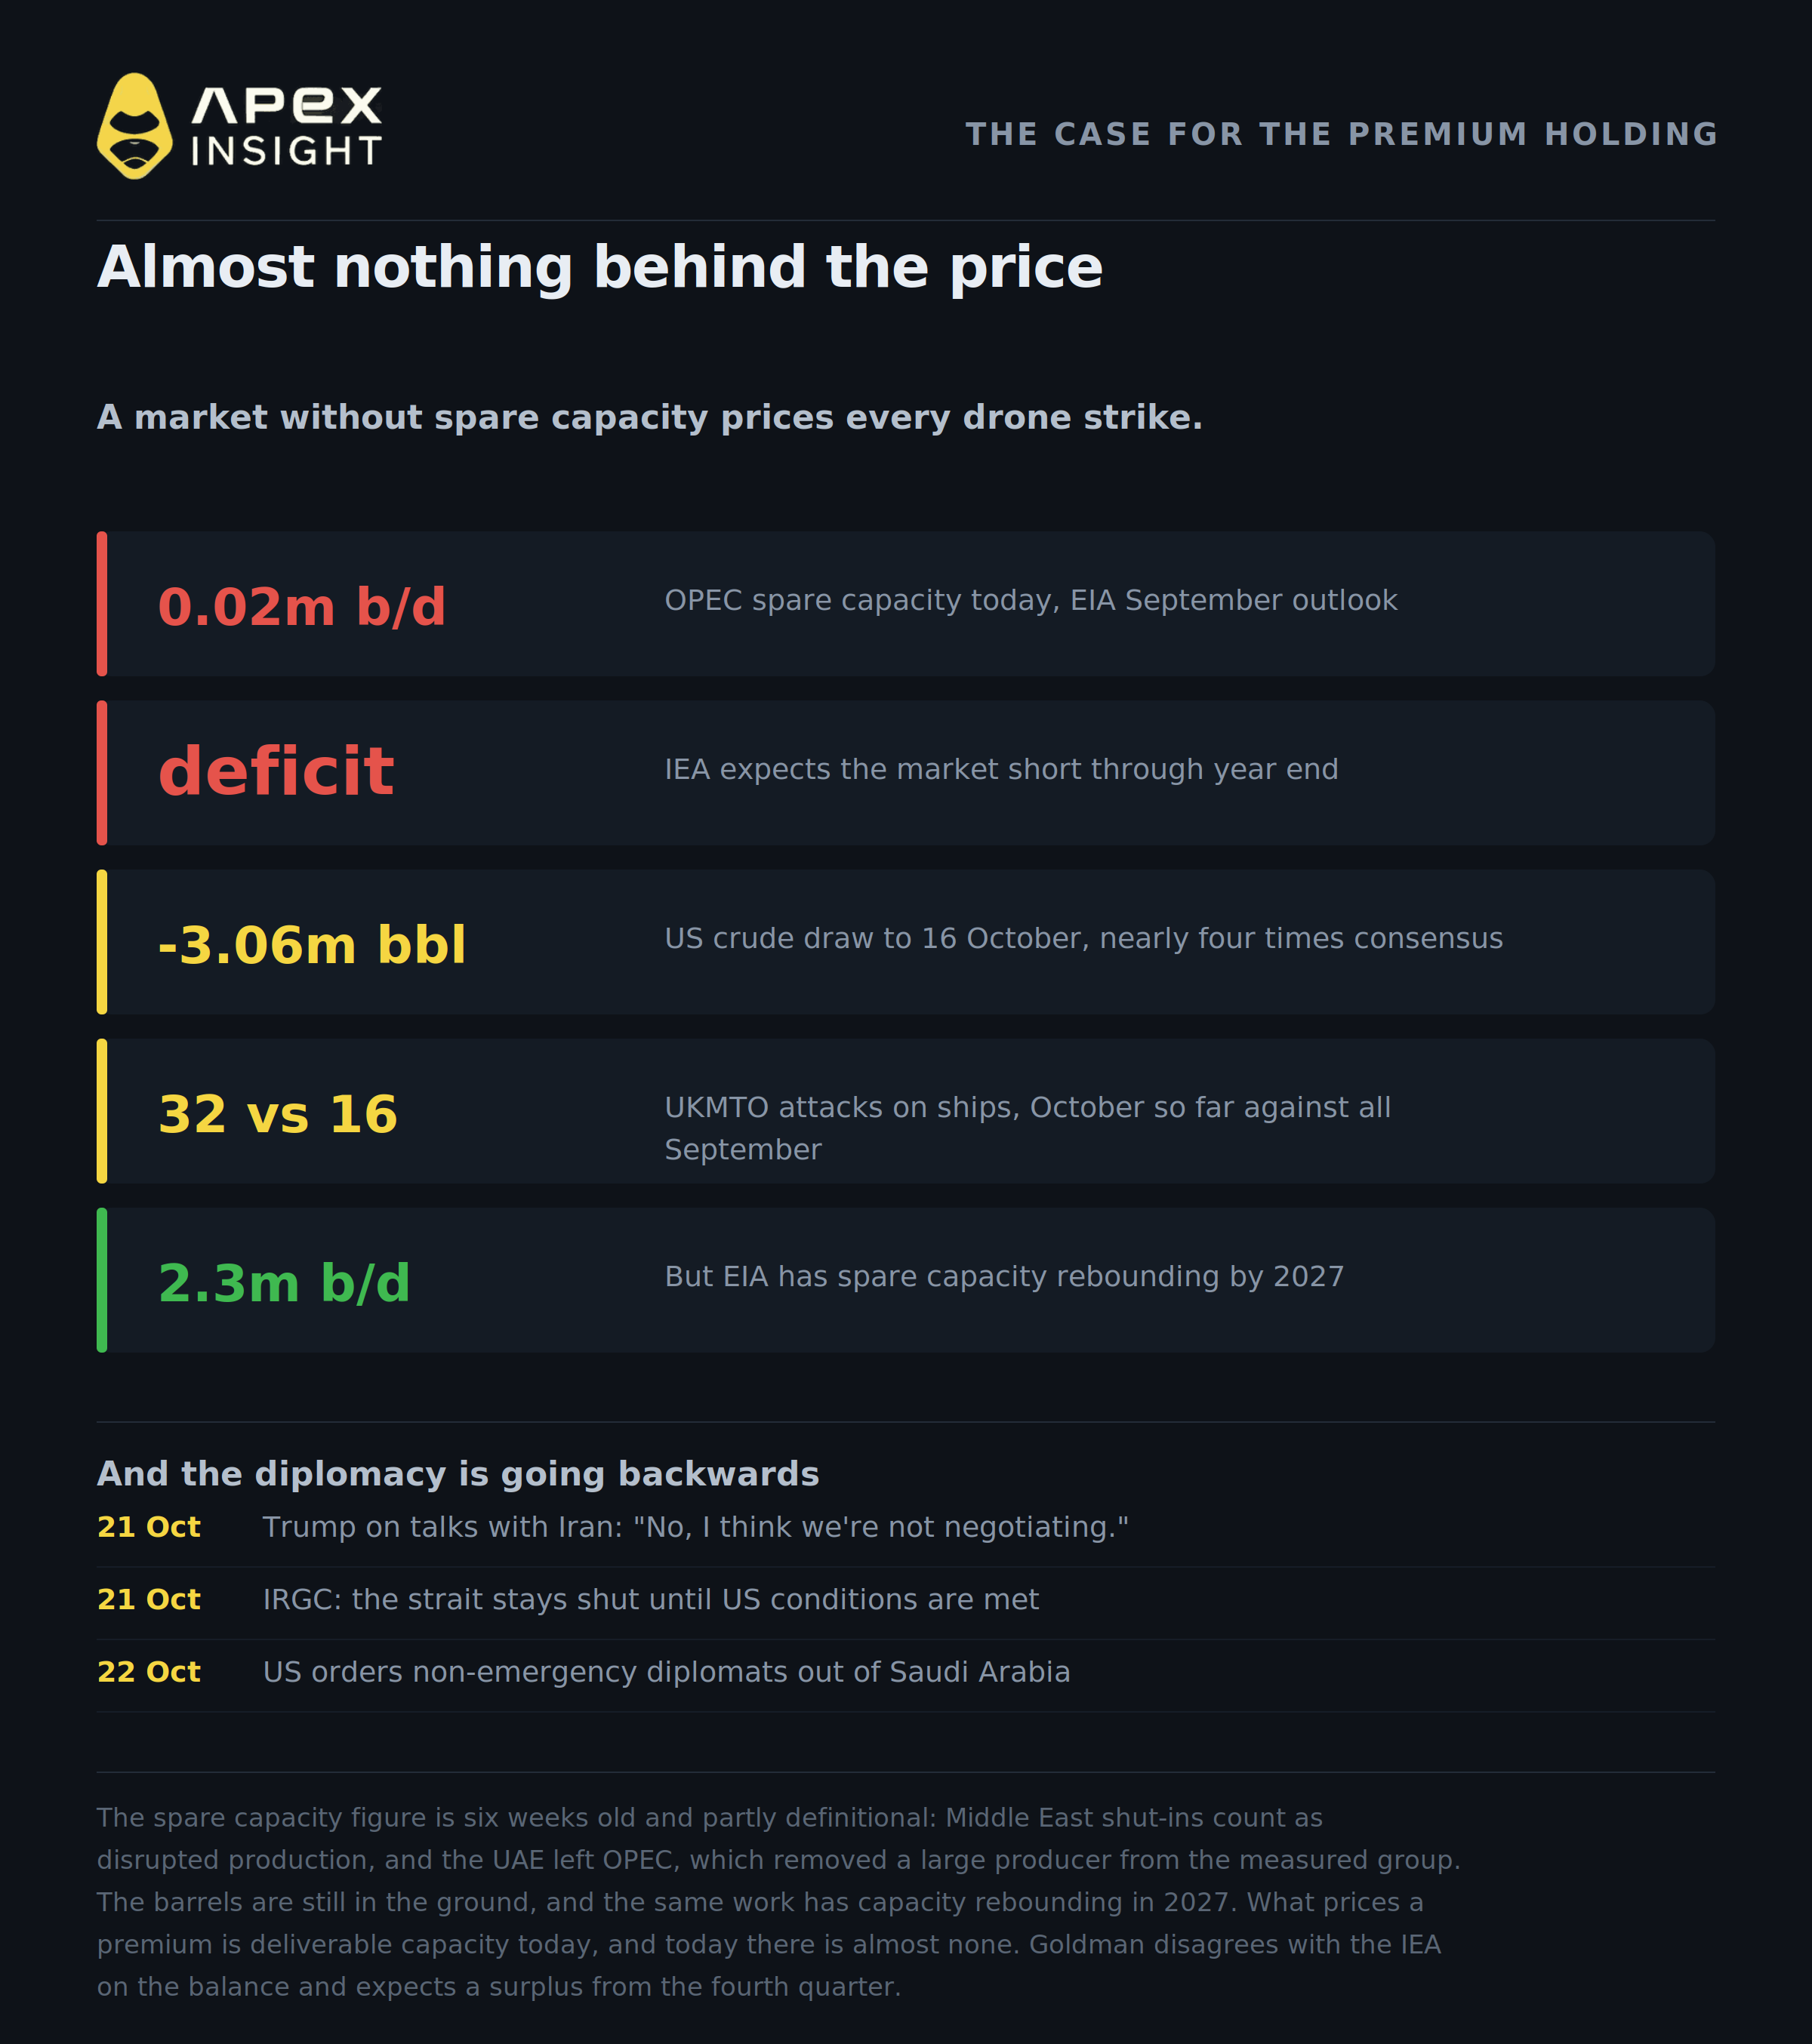
OPEC spare capacity is effectively gone. The EIA's September Short-Term Energy Outlook put it at 0.02 million barrels a day, which is to say zero in any practical sense.
Be careful with that number, because the researchers who flagged it spend their paper arguing it conflates three different things. Middle East shut-ins are classified as disrupted production rather than usable spare capacity. The UAE's exit from OPEC, effective 1 May, removed a large producer from the measured group. And the measure itself says nothing about what is in the ground. The same EIA work has spare capacity rebounding to around 2.3 million barrels a day in 2027 as trade routes normalise.
What matters for a premium, though, is deliverable spare capacity today, and today there is almost none. A market with a cushion shrugs off an outage. A market without one prices every drone strike straight into the curve.
Then there is the balance, and this is where the bank and the agency part company. Goldman expects a surplus from the fourth quarter. The IEA does not. In its October report, which forecast world oil demand falling 2.6 million barrels a day this year to 102.4 million, the IEA said it still expects the market to stay in deficit through year end, after global observed inventories fell by 10 million barrels in September. Demand destruction has been severe, and on the IEA's reading it still has not outrun the supply that went missing.
In fairness to the other side, that same IEA meeting on 15 October agreed to finish and accelerate the remaining emergency stock releases, roughly 100 million barrels on top of the 330 million already released, including more than 20 million barrels of diesel as soon as possible. That is real supply arriving on a known schedule, and it is the clearest bearish lever anyone currently has.
The weekly US data cuts both ways too. Crude stocks fell 3.06 million barrels to 412.5 million in the week to 16 October, against a Reuters poll expecting a draw of 820,000. That is a bullish print, nearly four times the consensus. In the same report, distillate stocks rose 1.68 million barrels to 104.3 million, which is the opposite signal in the part of the barrel that has been tightest all year.
That is the trade in one paragraph. Goldman's $90 needs the surplus to arrive. The IEA says it has not arrived yet, while releasing the stocks that would help it along.
And the diplomacy is going backwards. Iran's foreign minister Abbas Araghchi said on 21 October that indirect talks were continuing through Pakistan and Qatar, that Washington had accepted Iran's seven-day proposal while seeking further terms, and that the Strait of Hormuz would stay closed until Washington accepted Tehran's conditions. Asked the same day whether the two sides were negotiating, President Trump told reporters, in remarks relayed by Anadolu Agency, "No, I think we're not negotiating." An unnamed Iranian official told Reuters that "Iran is preparing for renewed Israeli and US attacks, not for a deal with America to end the war."
Meanwhile the theatre is widening rather than narrowing. The UKMTO has logged 32 attacks on ships around the Arabian peninsula so far in October, against 16 in the whole of September. The Houthis claimed on 19 October to have struck Aramco's Yanbu facility, the Shaybah oilfield and the Riyadh and Abha airports, though Saudi authorities did not immediately confirm the claims and Reuters could not independently verify them. This morning Washington ordered some personnel and their family members to leave its diplomatic missions in Saudi Arabia.
ING's commodities team, writing on 20 October, framed the conditional honestly: if flows continue uninhibited despite the geopolitical environment, "the risk premium would likely erode slowly." They added that there were no signs of it yet.
Slowly, and only if nothing else breaks.
What this looks like on the tape
WTI on ApeX has run from a close of $88.85 on 7 October to around $99 today, a gain of roughly 11% to 12% in fifteen days depending on where in the session you look. The contract has traded between $96.50 and $100.13 over the past 24 hours, pressing the $100 line repeatedly without clearing it.
Brent has done more of the work. On 20 October the December Brent contract reached $111.99 intraday, a five-month high, then settled at $108.79. The headline that day said WTI touched $110.48, the highest for a nearby contract since April, but that was the November contract on its expiry, which settled at $101.79 while December settled at $97.82. Expiring contracts print numbers the market is not really trading. It is worth checking which month a scary headline refers to before acting on it.
That gap between the two benchmarks is itself the cleanest expression of the premium. Brent is seaborne and has to cross water that is being shot at. WTI is landlocked American crude that does not. The spread between them was close to $12 this morning, $11.99 at 00:34 GMT and $12.25 by 06:26 GMT on the same wire. One long-run study of the two benchmarks puts the average WTI discount at about $4.19 across the decade from 2016 to early 2026, and the spread has been running well beyond that since the war began at the end of February.
Trade the markets in this article
Everything discussed here is tradeable on ApeX Omni as a TradFi perpetual, settled in USDT, up to 50x, long or short, with no KYC.
The two benchmarks at the centre of the argument:
CLUSDT, WTI crude, the landlocked benchmark
BZUSDT, Brent crude, the seaborne benchmark carrying the premium
If the view is about energy more broadly rather than the spread:
USOUSDT, the United States Oil Fund
NATGASUSDT, natural gas, which trades on its own weather and storage story
And the instrument that usually moves with geopolitical risk rather than against it:
XAUUSDT, gold
TradFi contracts settle against an index rather than the underlying asset, and ApeX lists them separately from its crypto perpetuals in its own contract data. Check promotion terms before trading one to qualify for a volume campaign.
Trade WTI crude on ApeX Omni
Long or short oil with USDT collateral. Up to 50x, no KYC, no gas fees.
Trading perpetual contracts carries a high level of risk and can result in the loss of your entire position. Leverage increases both gains and losses. Commodity prices move on headlines that arrive without warning, and the oil market is currently reacting to military events in real time. Nothing in this article is financial advice. Do your own research and never risk more than you can afford to lose.
If you need any help, feel free to reach out to our team on Discord.
Website: https://www.apex.exchange
Twitter: https://twitter.com/OfficialApeXdex
Telegram: https://t.me/ApeXdex
ApeX contract prices were refreshed at 14:00 UTC on 22 October 2026, and ApeX contract history is used only for October, where it tracks published WTI prints closely. Published Brent and WTI prices carry their own timestamps and are several hours earlier than the ApeX snapshot, so the two are not the same moment and should not be differenced. Oil moved materially during the session this piece was written, and every price here is stamped. ApeX settles these contracts against a Chainlink index which can sit a few dollars away from the front-month exchange price, so all Brent and WTI levels quoted in the body are published futures prices from the named sources rather than ApeX data, and the two are not mixed. Contract availability was verified against ApeX's own live contract configuration. Goldman's $25 fair-value gap and its $20 freight estimate are separate measures and are not components of each other. Flow figures are commercial tanker-tracking estimates that revise upward and that disagree with one another; both readings are given. The OPEC spare capacity figure is from the EIA's September outlook as relayed by a third-party research digest, and is six weeks old. The war risk insurance range is a broker estimate reaching this article third-hand, from brokers to the Financial Times to the outlet linked, published 14 October and describing the week before that. The tanker rate fall it is set against is dated to the week of 16 October, with no assessment date published, and predates this week's escalation in Saudi Arabia. Freight figures are a global average except where the Gulf to Asia route is named. One hourly bar on the ApeX WTI contract on 14 October printed a high near $104.68 that reversed within the hour and is excluded as an outlier.