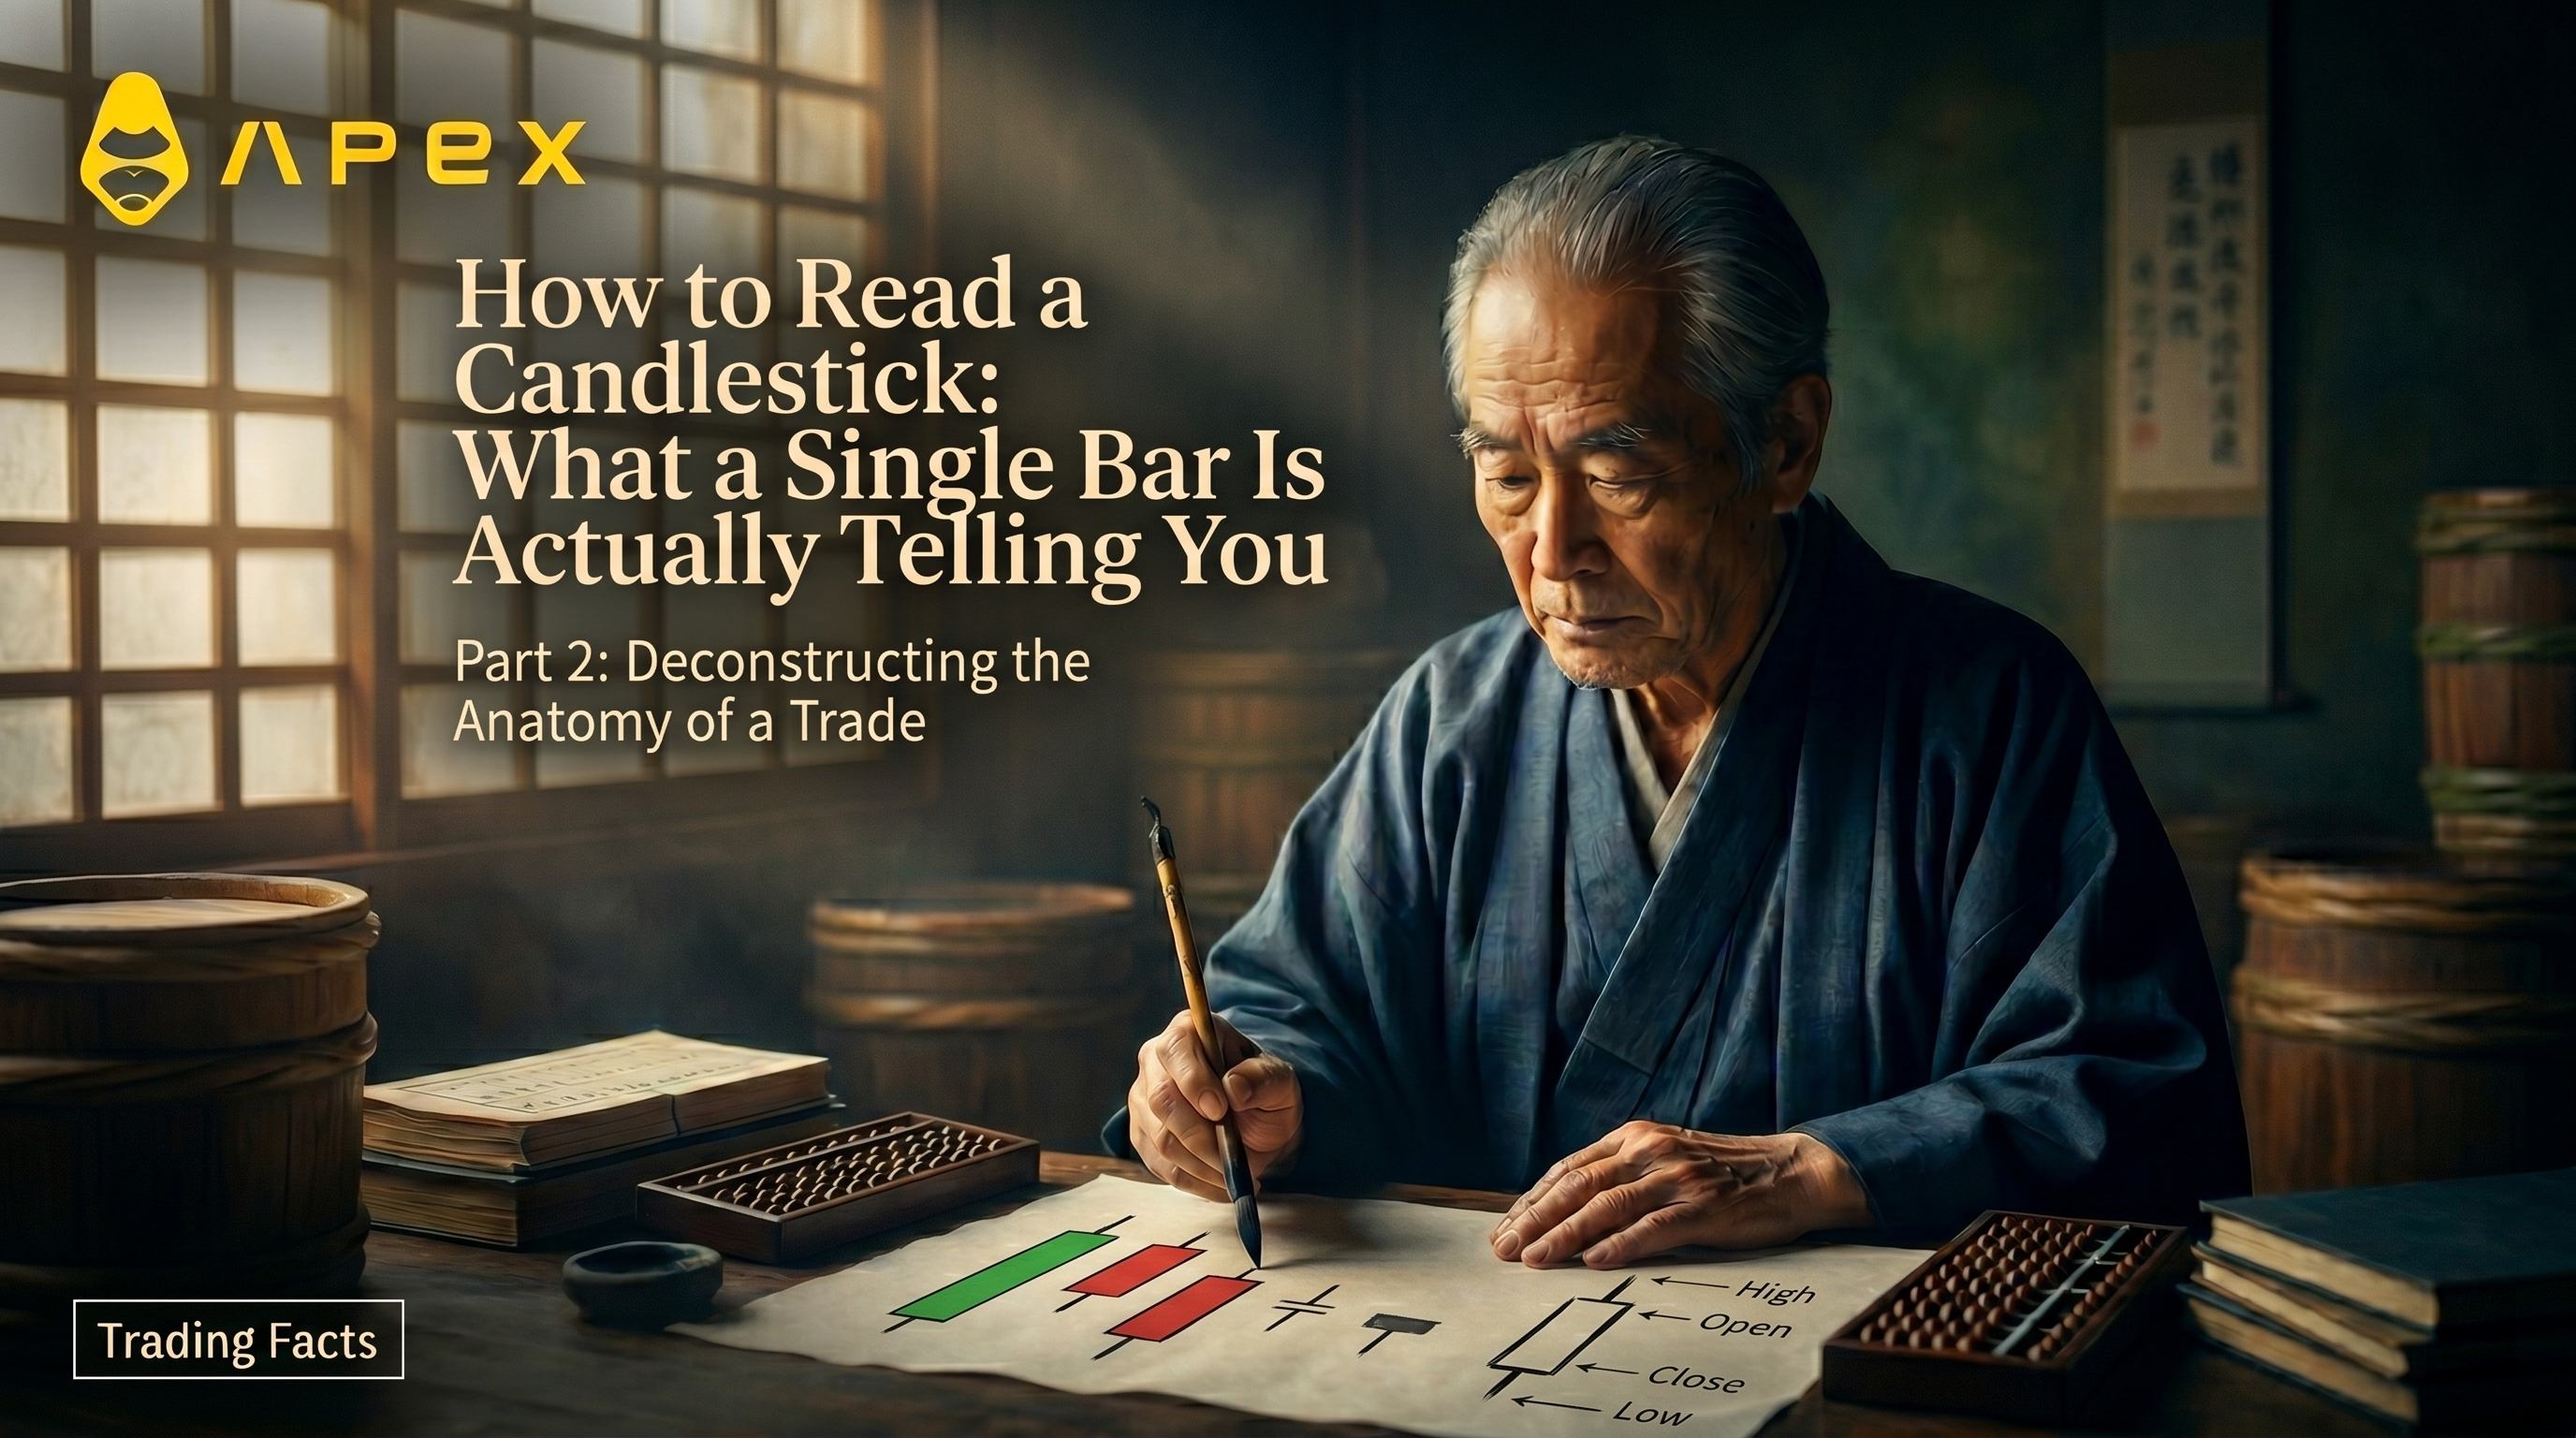
A single candlestick is a four-number story. It records where price opened, how high it reached, how low it fell, and where it closed, and the shape it draws tells you who won the fight during that period: buyers or sellers. Learn to read one candle and you can read any chart, on any timeframe, in any market.
Here is the catch, stated up front because most guides bury it: a single candle is a hint, not a signal. The popular claim that this or that candle "predicts a reversal" mostly does not survive testing, and we will look at the actual numbers below. This piece, the second in our series, teaches you to read one candle honestly: what the body says, what the wicks say, the named shapes worth knowing, and why none of them should be traded alone.
If you have not read the first installment on where candlesticks came from, the short version is this: each candle packs the same open-high-low-close data the West was already publishing, but fills and colors the body so the open-versus-close battle jumps out at a glance.
The body: how much conviction
Start with the thick part, the real body. It spans the distance from the open to the close, and its length is the single most useful thing on the candle.
A long body means one side dominated from open to close. The longer the body, the more intense the buying or selling pressure during that period (StockCharts). A long green body is buyers in control; a long red body is sellers pressing hard. A short body means the opposite: little net movement, consolidation, indecision, a period where neither side could close much ground.
One precision point that trips up beginners. Body length measures price conviction, the open-to-close range, not trading volume. A long body can print on thin volume and a short one on heavy volume. So read the body as buying or selling pressure, and check volume separately. The relationship between the open and the close is, as StockCharts puts it, "the essence of candlesticks": where price finishes relative to where it started is what makes a candle bullish or bearish in the first place.
The shadows: what got rejected
The thin lines above and below the body, the wicks or shadows, record the ground that was taken and then lost. They are a map of rejection.
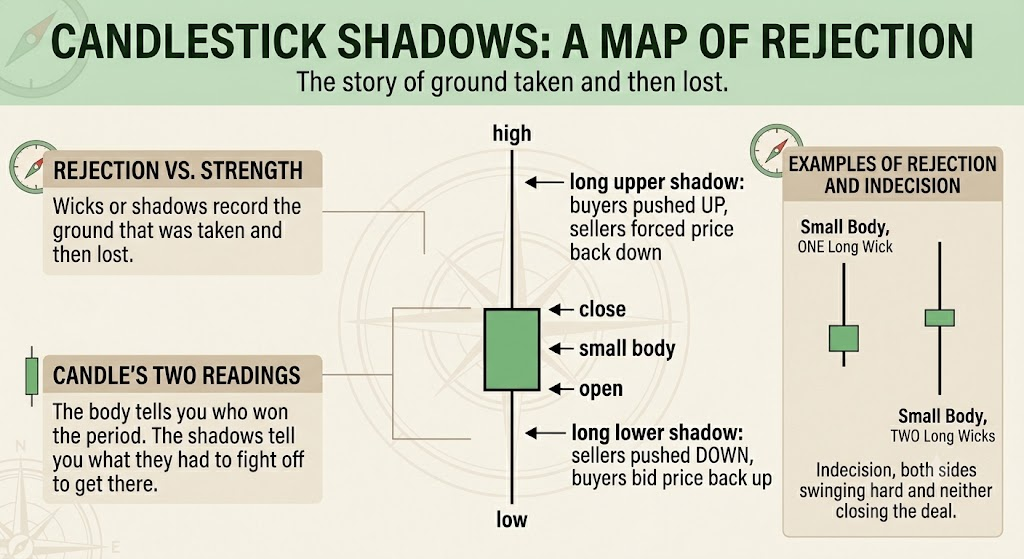
A long upper shadow means buyers bid prices up during the session, but sellers forced them back down before the close: higher prices were rejected. A long lower shadow is the mirror image: sellers drove prices down, but buyers resurfaced and bid them back up, so lower prices were rejected. Little or no shadow means price simply stayed near its extremes, with nothing pushed back.
So a candle has two readings stacked together. The body tells you who won the period. The shadows tell you what they had to fight off to get there. A small body with one long wick is a story of rejection in one direction. A small body with two long wicks is a story of indecision, with both sides swinging hard and neither closing the deal.
The single-candle vocabulary
Traders gave names to the most telling shapes. Knowing them is useful shorthand, as long as you remember the names describe a shape, not a guarantee.
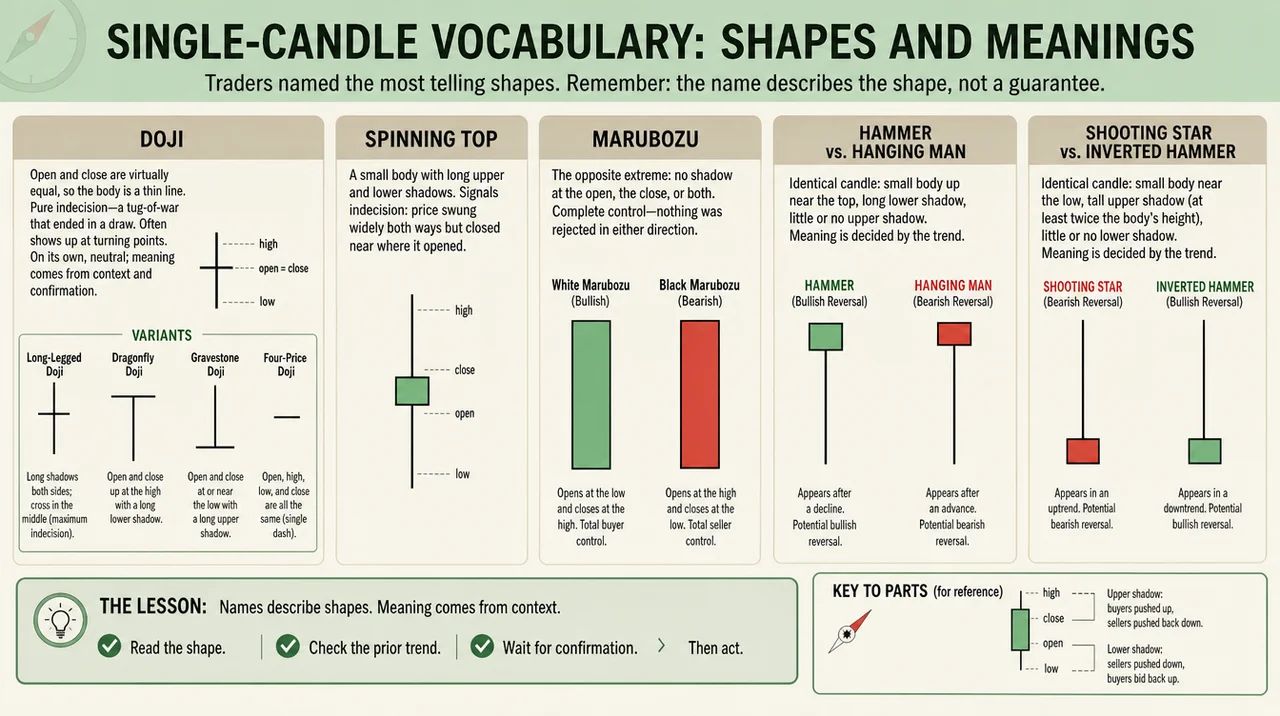
Doji. The open and close are virtually equal, so the body is a thin line. A doji is the purest picture of indecision, a tug-of-war that ended in a draw, and it often shows up at turning points. On its own, though, a doji is neutral. Any bullish or bearish meaning comes entirely from what came before it and what confirms it after. Its variants are just doji in different positions: a long-legged doji has long shadows on both sides with the cross in the middle of the range (maximum indecision); a dragonfly doji has the open and close up at the high with a long lower shadow; a gravestone doji sits at or near the low with a long upper shadow; and the rare four-price doji is a single dash where open, high, low, and close are all the same (StockCharts pattern dictionary).
Spinning top. A small body with long upper and lower shadows. Like the doji, it signals indecision: price swung widely both ways but closed near where it opened.
Marubozu. The opposite extreme: a candle with no shadow at the open, the close, or both. A white marubozu opens at the low and closes at the high, total buyer control; a black marubozu opens at the high and closes at the low, total seller control. Nothing was rejected in either direction.
Hammer and hanging man. Here is the lesson that matters most. These two are the identical candle: a small body up near the top, a long lower shadow, little or no upper shadow. The only thing that separates them is the trend they appear in. After a decline, the shape is a hammer, read as a potential bullish reversal. After an advance, the exact same shape is a hanging man, read as a potential bearish reversal. Same drawing, opposite meaning, decided purely by context.
Shooting star and inverted hammer. The same trick, flipped. Both are a small body near the low with a tall upper shadow at least twice the body's height and little or no lower shadow (Bulkowski). In an uptrend that shape is a shooting star (potential bearish reversal); in a downtrend it is an inverted hammer (potential bullish reversal). Identical candle, renamed and reinterpreted by prior trend alone.
Candle | Shape | Reads as | Only meaningful... |
Doji | Open ≈ close, thin body | Indecision | with prior trend + confirmation |
Spinning top | Small body, two long wicks | Indecision | with prior trend + confirmation |
Marubozu | Long body, no wicks | One-sided control | as momentum, still needs context |
Hammer | Small body top, long lower wick | Bullish reversal | after a decline |
Hanging man | Same as hammer | Bearish reversal | after an advance |
Shooting star | Small body low, long upper wick | Bearish reversal | after an advance |
Inverted hammer | Same as shooting star | Bullish reversal | after a decline |
The catch: one candle is not a signal
Now the part the candle-pattern industry would rather you skipped. When you test these shapes against decades of real price data, their predictive power is, charitably, modest. The most thorough public testing comes from Thomas Bulkowski, author of the Encyclopedia of Candlestick Charts, who ran the patterns across a large multi-year database and published the results.
The numbers deflate the folklore:
The hammer acts as a bullish reversal about 60% of the time, which Bulkowski calls "not far from random (50%)," and even when it does reverse, the follow-through is weak, ranking 65th of 103 candle types (Bulkowski).
The hanging man, taught everywhere as a bearish reversal, actually behaves as a bullish continuation 59% of the time in his testing, near random, and ranks a poor 87th of 103 (Bulkowski).
The shooting star acts as a bearish reversal 59% of the time, which he again calls near random, noting dryly that "this candle looks better than it performs".
The inverted hammer is the one single candle that cracks his top ten overall performers, at number six of 103. The twist: it acts as a bearish continuation 65% of the time, the opposite of the bullish reversal it is supposed to be (Bulkowski, HammerInv).
Bulkowski treats anything below roughly a 60% rate as effectively random. And even the strongest patterns are not crystal balls: the best-reversing pattern in his rankings tops out at an 86% reversal rate, and the tenth-best reverses only 72% of the time (Bulkowski). One important caveat to read these numbers honestly: a "reversal rate" is a frequency, the share of cases where price went the expected way, not a measure of profit or how far it traveled. It is a direction count, not a win rate.
The takeaway is not that candles are useless. It is that a single candle is one piece of evidence, roughly a coin flip on its own, and anyone selling you a shape that "works 85% of the time" with no context is selling folklore.
So how do you actually read one?
Three things turn a candle from a curiosity into usable information, and all three are about context.
Prior trend. A reversal needs something to reverse. A hammer means nothing in the middle of a sideways drift; it only carries weight at the bottom of a decline, and a hanging man only at the top of an advance. As Britannica notes, the same candle "can have a different interpretation, and even a different name, depending on the candlesticks that surround it" (Britannica). The hammer-versus-hanging-man pair is the proof.
Location. A candle sitting at a known support or resistance level is far more interesting than the same candle in open space. Candlesticks are at their best confirming a level that other tools already flagged (StockCharts).
Confirmation. Wait for the next move. Bearish patterns want bearish follow-through, typically within one to three sessions, in the form of a gap down or a long red candle, ideally on heavy volume; bullish patterns want the reverse. And remember timeframe: Bulkowski's statistics are drawn from daily charts, and a "hammer" on a one-minute chart is a far flimsier thing than one on a daily or weekly.
Common beginner mistakes
Trading a doji in isolation. A doji is indecision, full stop. With no prior trend and no confirmation, it is noise, not a setup.
Ignoring the trend. Calling every long-lower-wick candle a "hammer" regardless of what came before strips the shape of the only thing that gives it meaning.
Trusting one candle. The single most common error. The tested reliability says wait for confirmation; impatience is what the percentages punish.
Believing the accuracy myths. "This pattern is 85% reliable" claims rarely cite a tested source. When they do, the real numbers are usually closer to a coin flip.
The bottom line
A single candlestick is a compact, honest record of one period's fight between buyers and sellers: the body shows conviction, the shadows show rejection, and the named shapes are useful shorthand for the stories that recur. What a single candle is not is a prediction. The evidence is clear that one bar, read alone, is close to a coin flip, and that its value appears only when you add prior trend, location, and confirmation.
That is exactly where this series goes next. Single candles gain most of their meaning in combination, so the following installment moves from one candle to two and three: engulfing patterns, stars, and the multi-candle setups where the signal starts to outrun the noise.
Explore more from this series: Part 1 | Part 2 | Part 3 (Coming Soon)
This article is for educational and informational purposes only and is not financial, investment, or legal advice. Do your own research and consult a licensed professional before investing.