



Published 11 November 2026
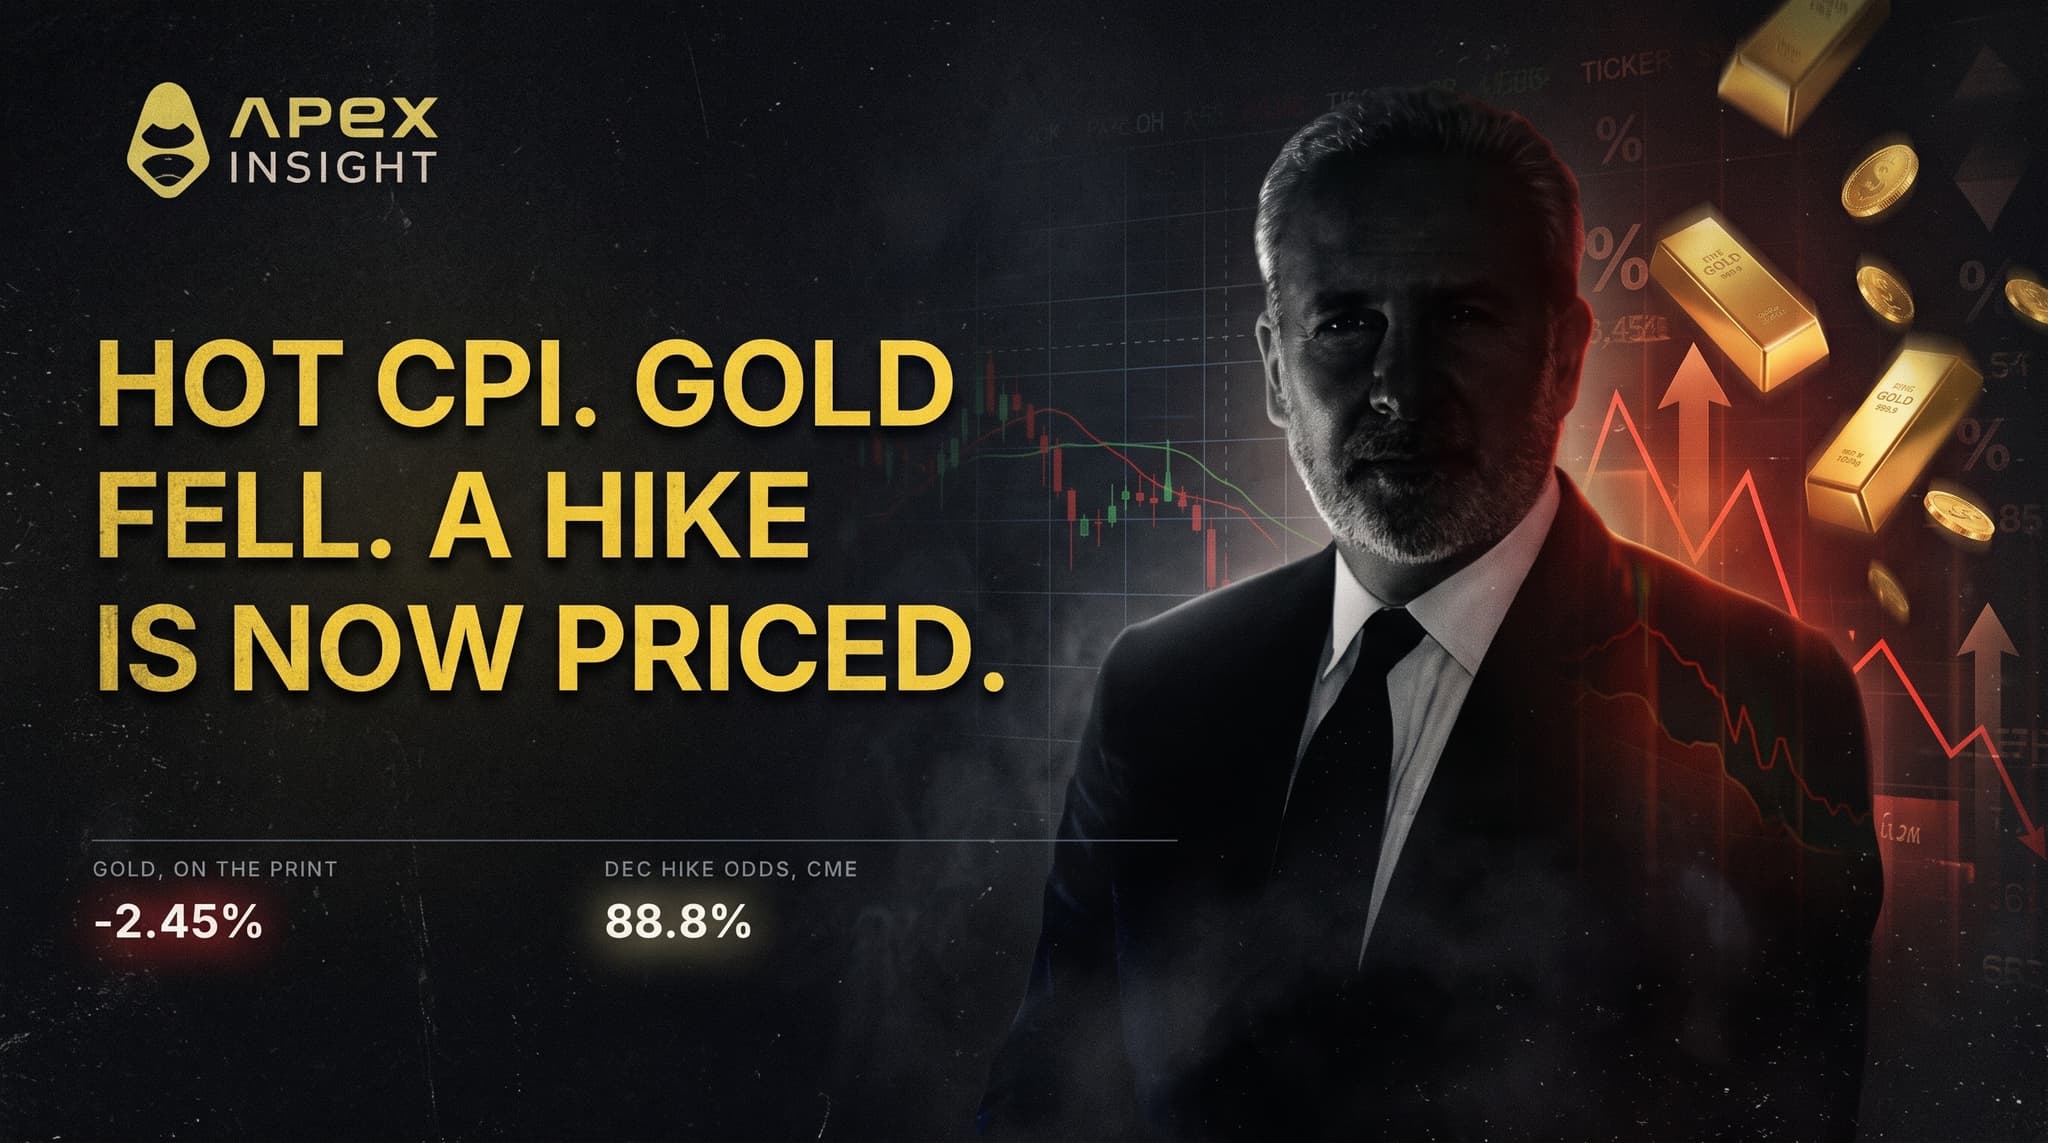
Gold is the asset people buy when they are worried about inflation. On Tuesday the United States reported inflation running hotter than forecast on both of its main measures, and the ApeX gold contract fell 2.45% over the day.
Silver fell 3.41%. Bitcoin fell 2.06%. Ether fell 3.86%.
That is not a contradiction, and it is not the market being irrational. It is the most useful thing a trader can understand about inflation data: a hot print is news about interest rates as much as it is news about prices. Gold pays no yield, so when the return on holding cash goes up, gold gets more expensive to own.
Here is what the October report actually said, what repriced against it, and what the release hour itself shows once you measure it bar by bar.
1. The print beat on both lines
The Bureau of Labor Statistics released the October Consumer Price Index at 08:30 Eastern on Tuesday 10 November, which is 13:30 UTC.
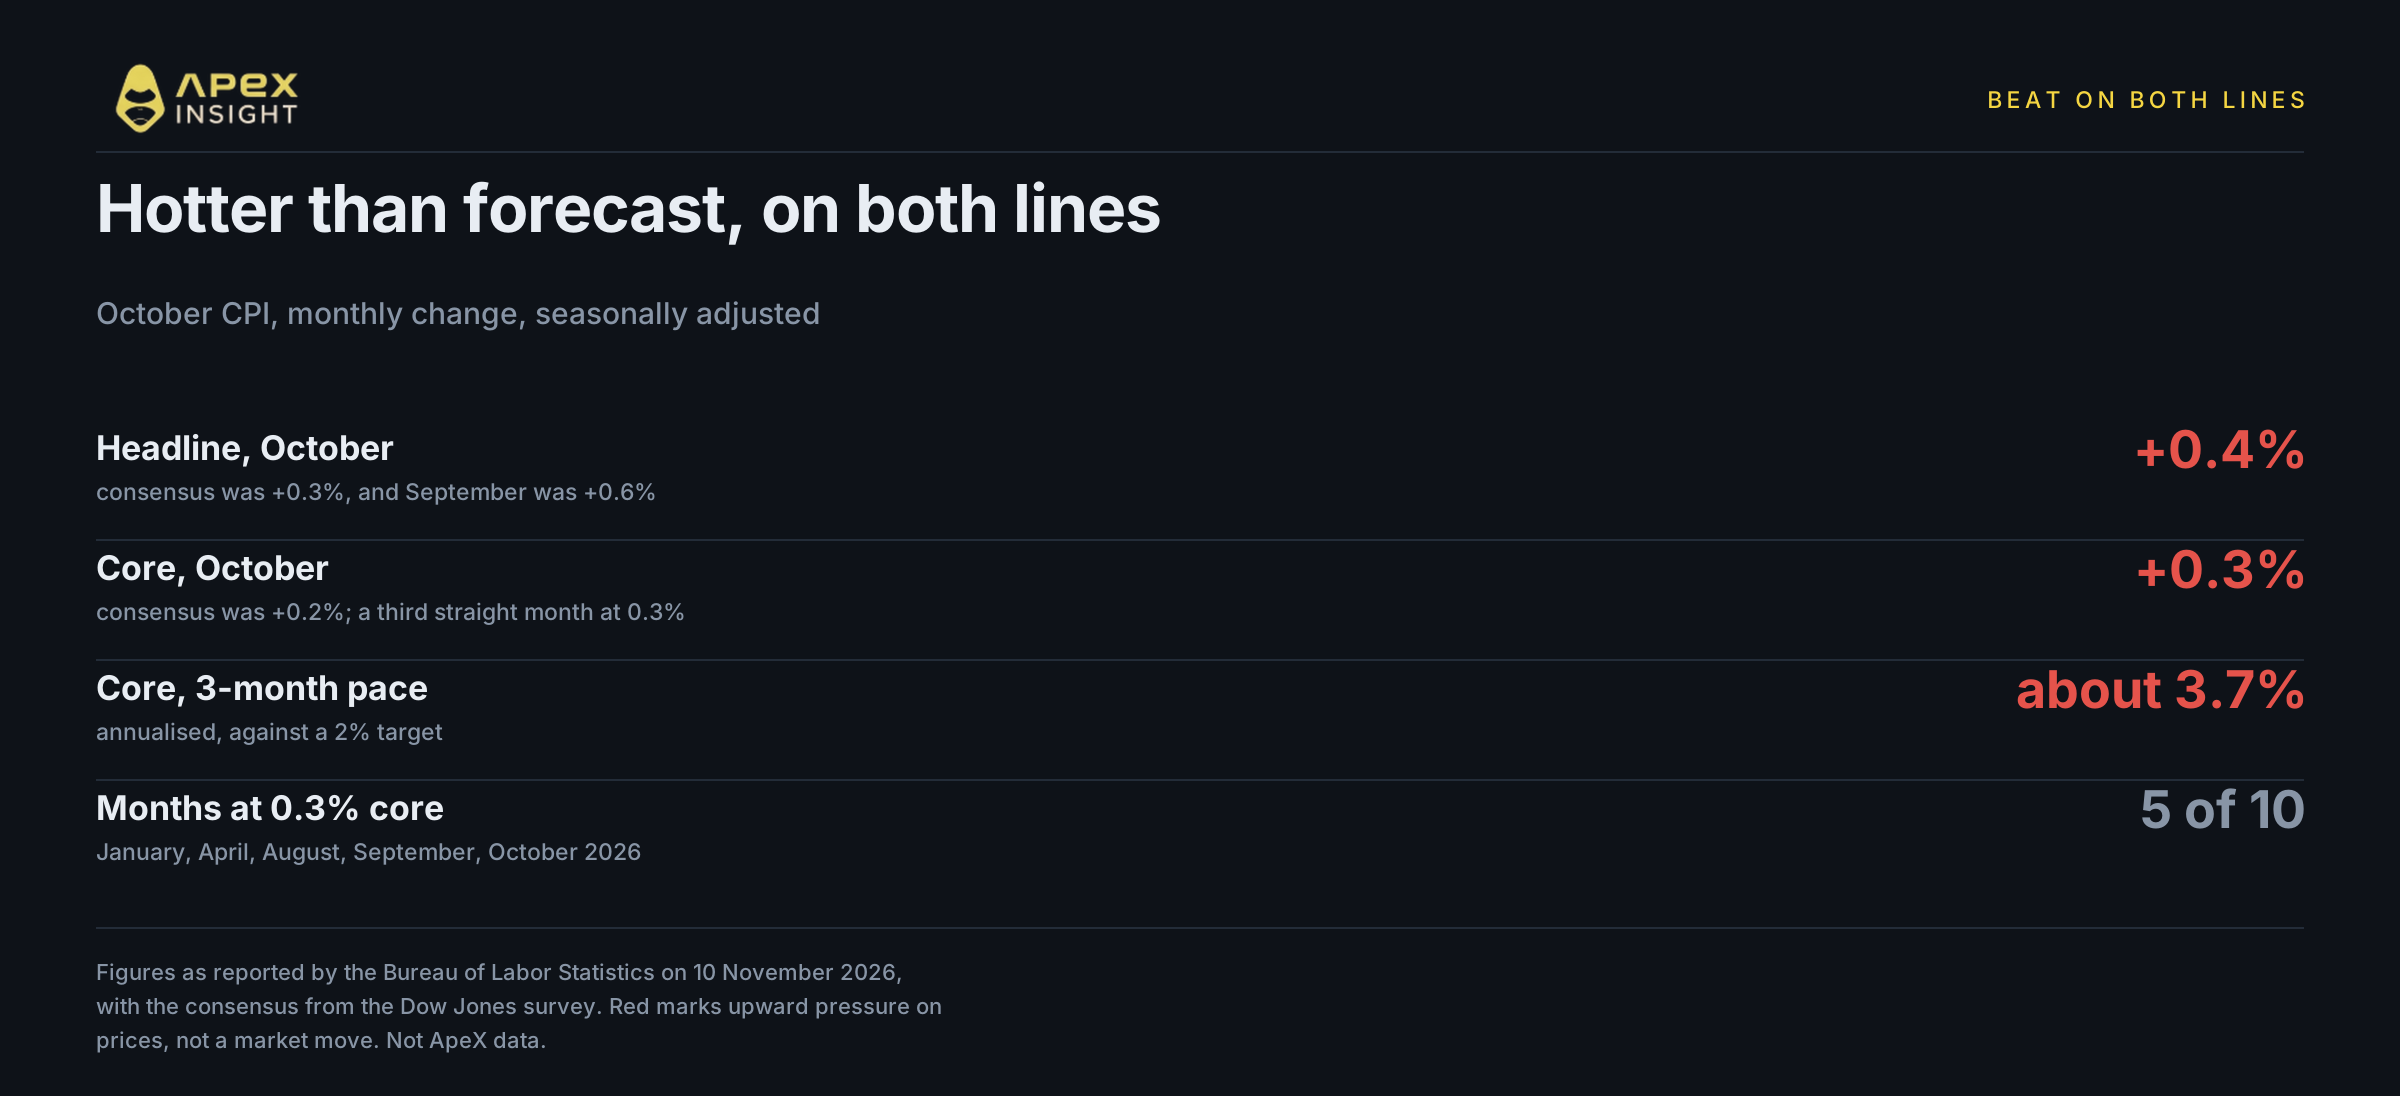
Headline prices rose 0.4% on the month against a 0.3% consensus. Core prices, which strip out food and energy, rose 0.3% against a 0.2% consensus. Both beat. The headline did slow from September's 0.6%, but it slowed less than forecast, and the core did not slow at all.
The core number is the one that matters for policy, and the BLS says it rose 0.3% in October, as it did in September and August. Compound three months of that and you get a pace of about 3.7% a year, against a 2% target. That annualised figure is arithmetic on the monthly prints rather than something the BLS publishes. Core has run at 0.3% or more in five of the ten months of 2026 reported so far.
Breadth is the part that turns a firm print into a hawkish one. Core goods excluding used cars rose 0.4%, and core excluding shelter and used cars also rose 0.4%, both the largest since January. Transportation services rose 0.8%. Furnishings and supplies rose 0.7%. When the increase is spread across unrelated categories rather than concentrated in one, it is harder to argue the cause is temporary.
The counter-argument, and it is a real one: used cars fell 1.2%, and used cars and communications were among the small number of major indexes that decreased. Energy decelerated sharply. This was not a print with nothing good in it.
2. The inflation rate nobody can quote this month
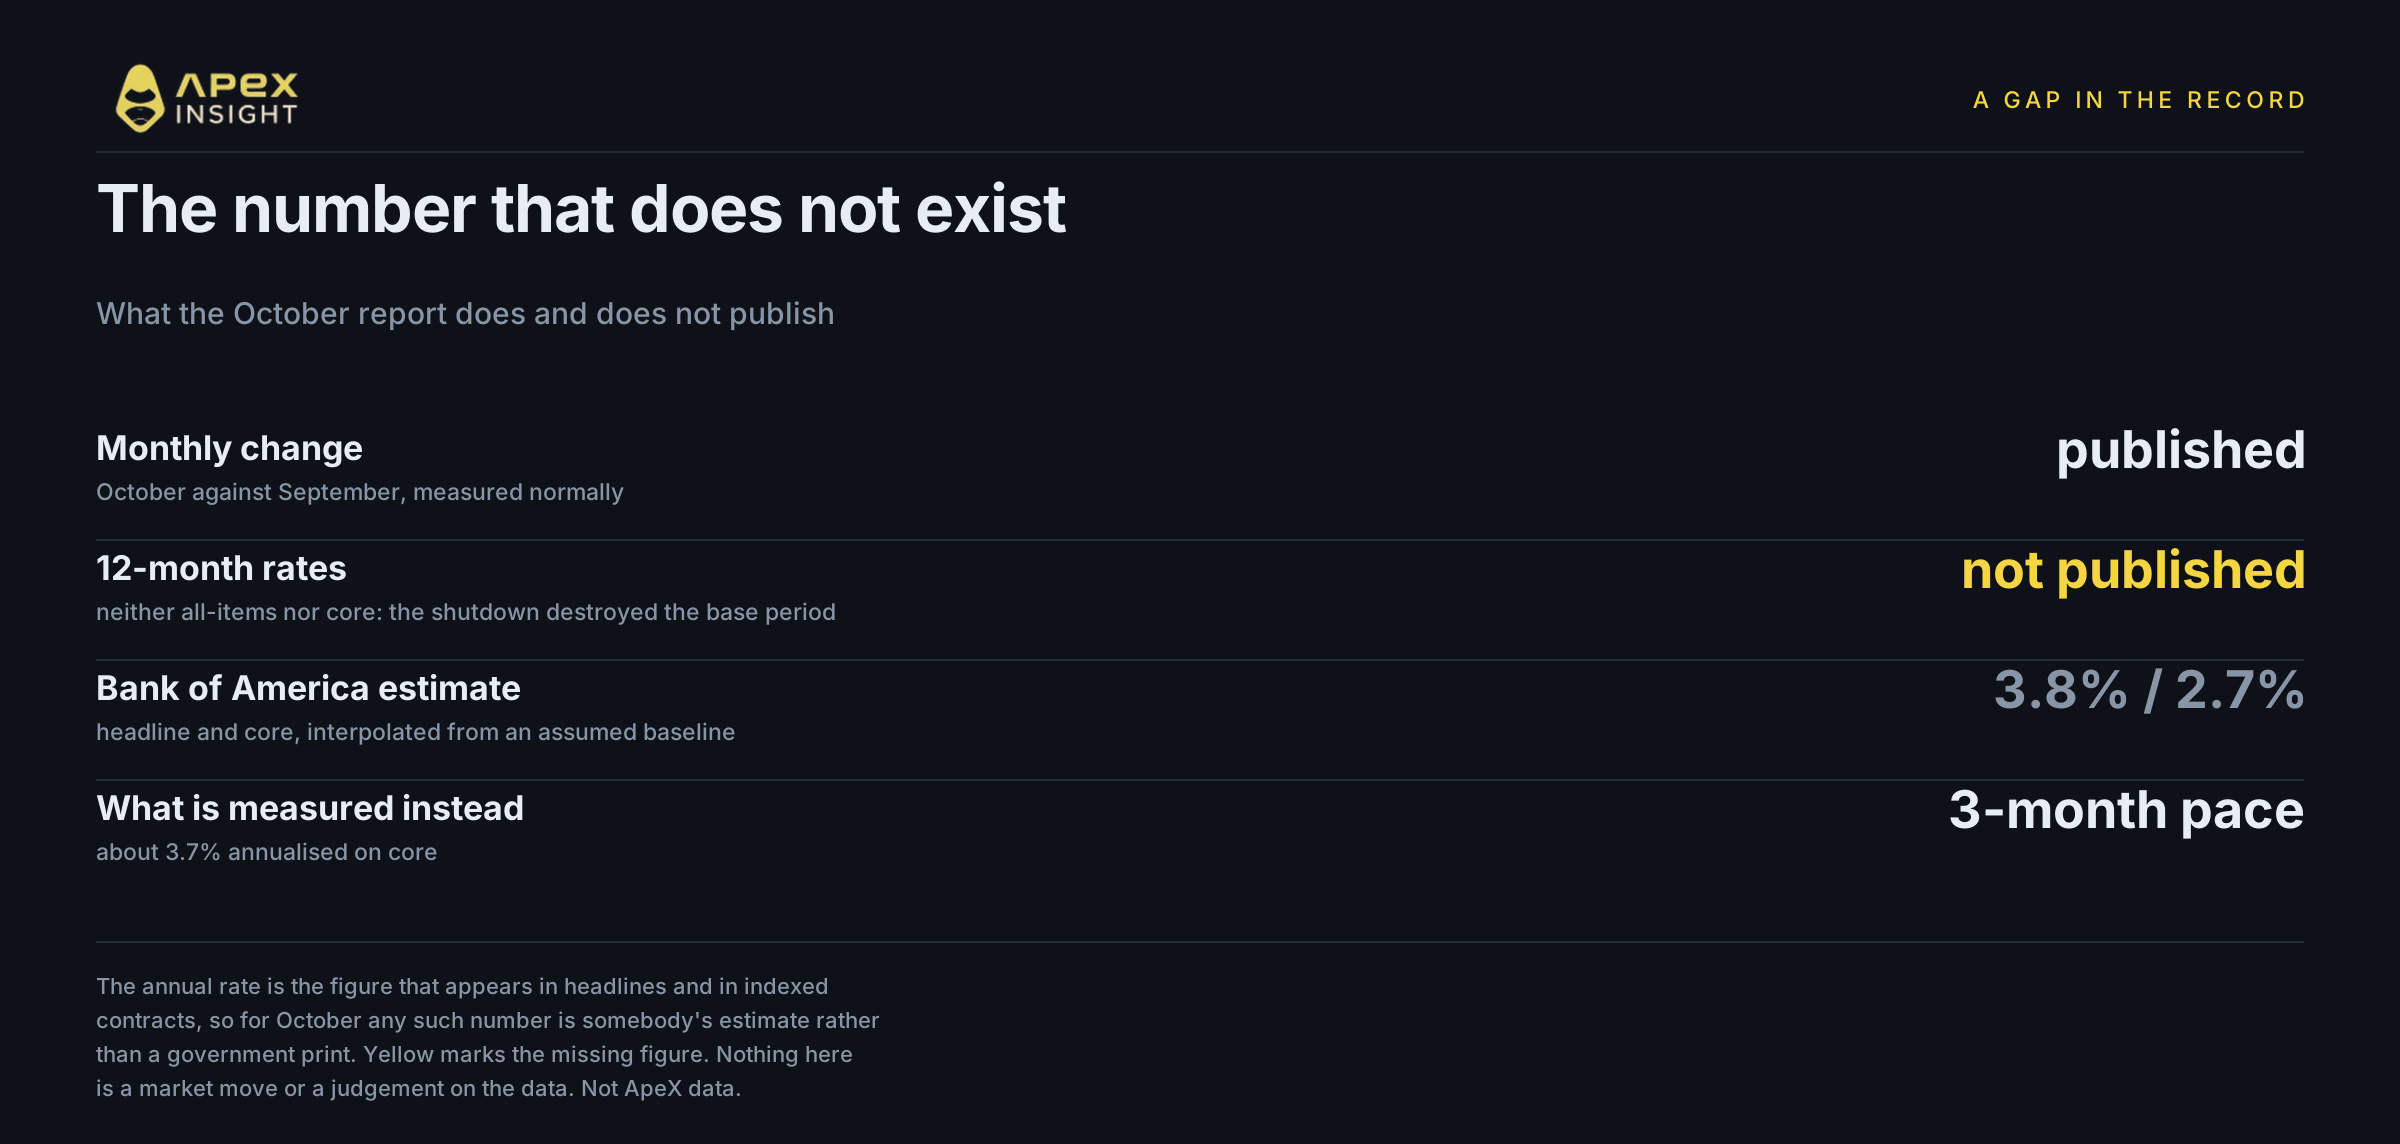
Here is the part that deserves more attention than it got. The October report carries no 12-month inflation rate, for overall prices or for core.
Last year's government shutdown interrupted collection, which destroyed the base period the annual comparison needs. The BLS can publish the month-on-month change, because that compares October with September. It will not publish 12-month percent changes for October 2026 where October 2025 data are not available, and that covers both the all-items index and the core measure. CNBC flagged this before the release.
This matters more than it sounds. The annual rate is the number that appears in headlines, in contracts, in pension adjustments and in most people's mental model of inflation. For October, any such figure you see is an estimate someone built, not a number the government published. Bank of America estimated 3.8% headline and 2.7% core by interpolating an assumed baseline. That is a reasonable method and it is still an estimate.
A few individual 12-month figures do survive, where the underlying series is built from data that existed anyway: gasoline is up 37.4% on the year, used cars and trucks down 3.3%. What is missing is the aggregates, which are the ones anybody quotes.
For a trader, the practical consequence is that the monthly path and the three-month annualised pace carry more weight than usual this month, because they are the only aggregate figures that are actually measured. That pace is roughly 3.7%, against a 2% target. With no annual rate to argue about, it is the figure doing most of the work in the policy debate.
3. Shelter did a third of the work
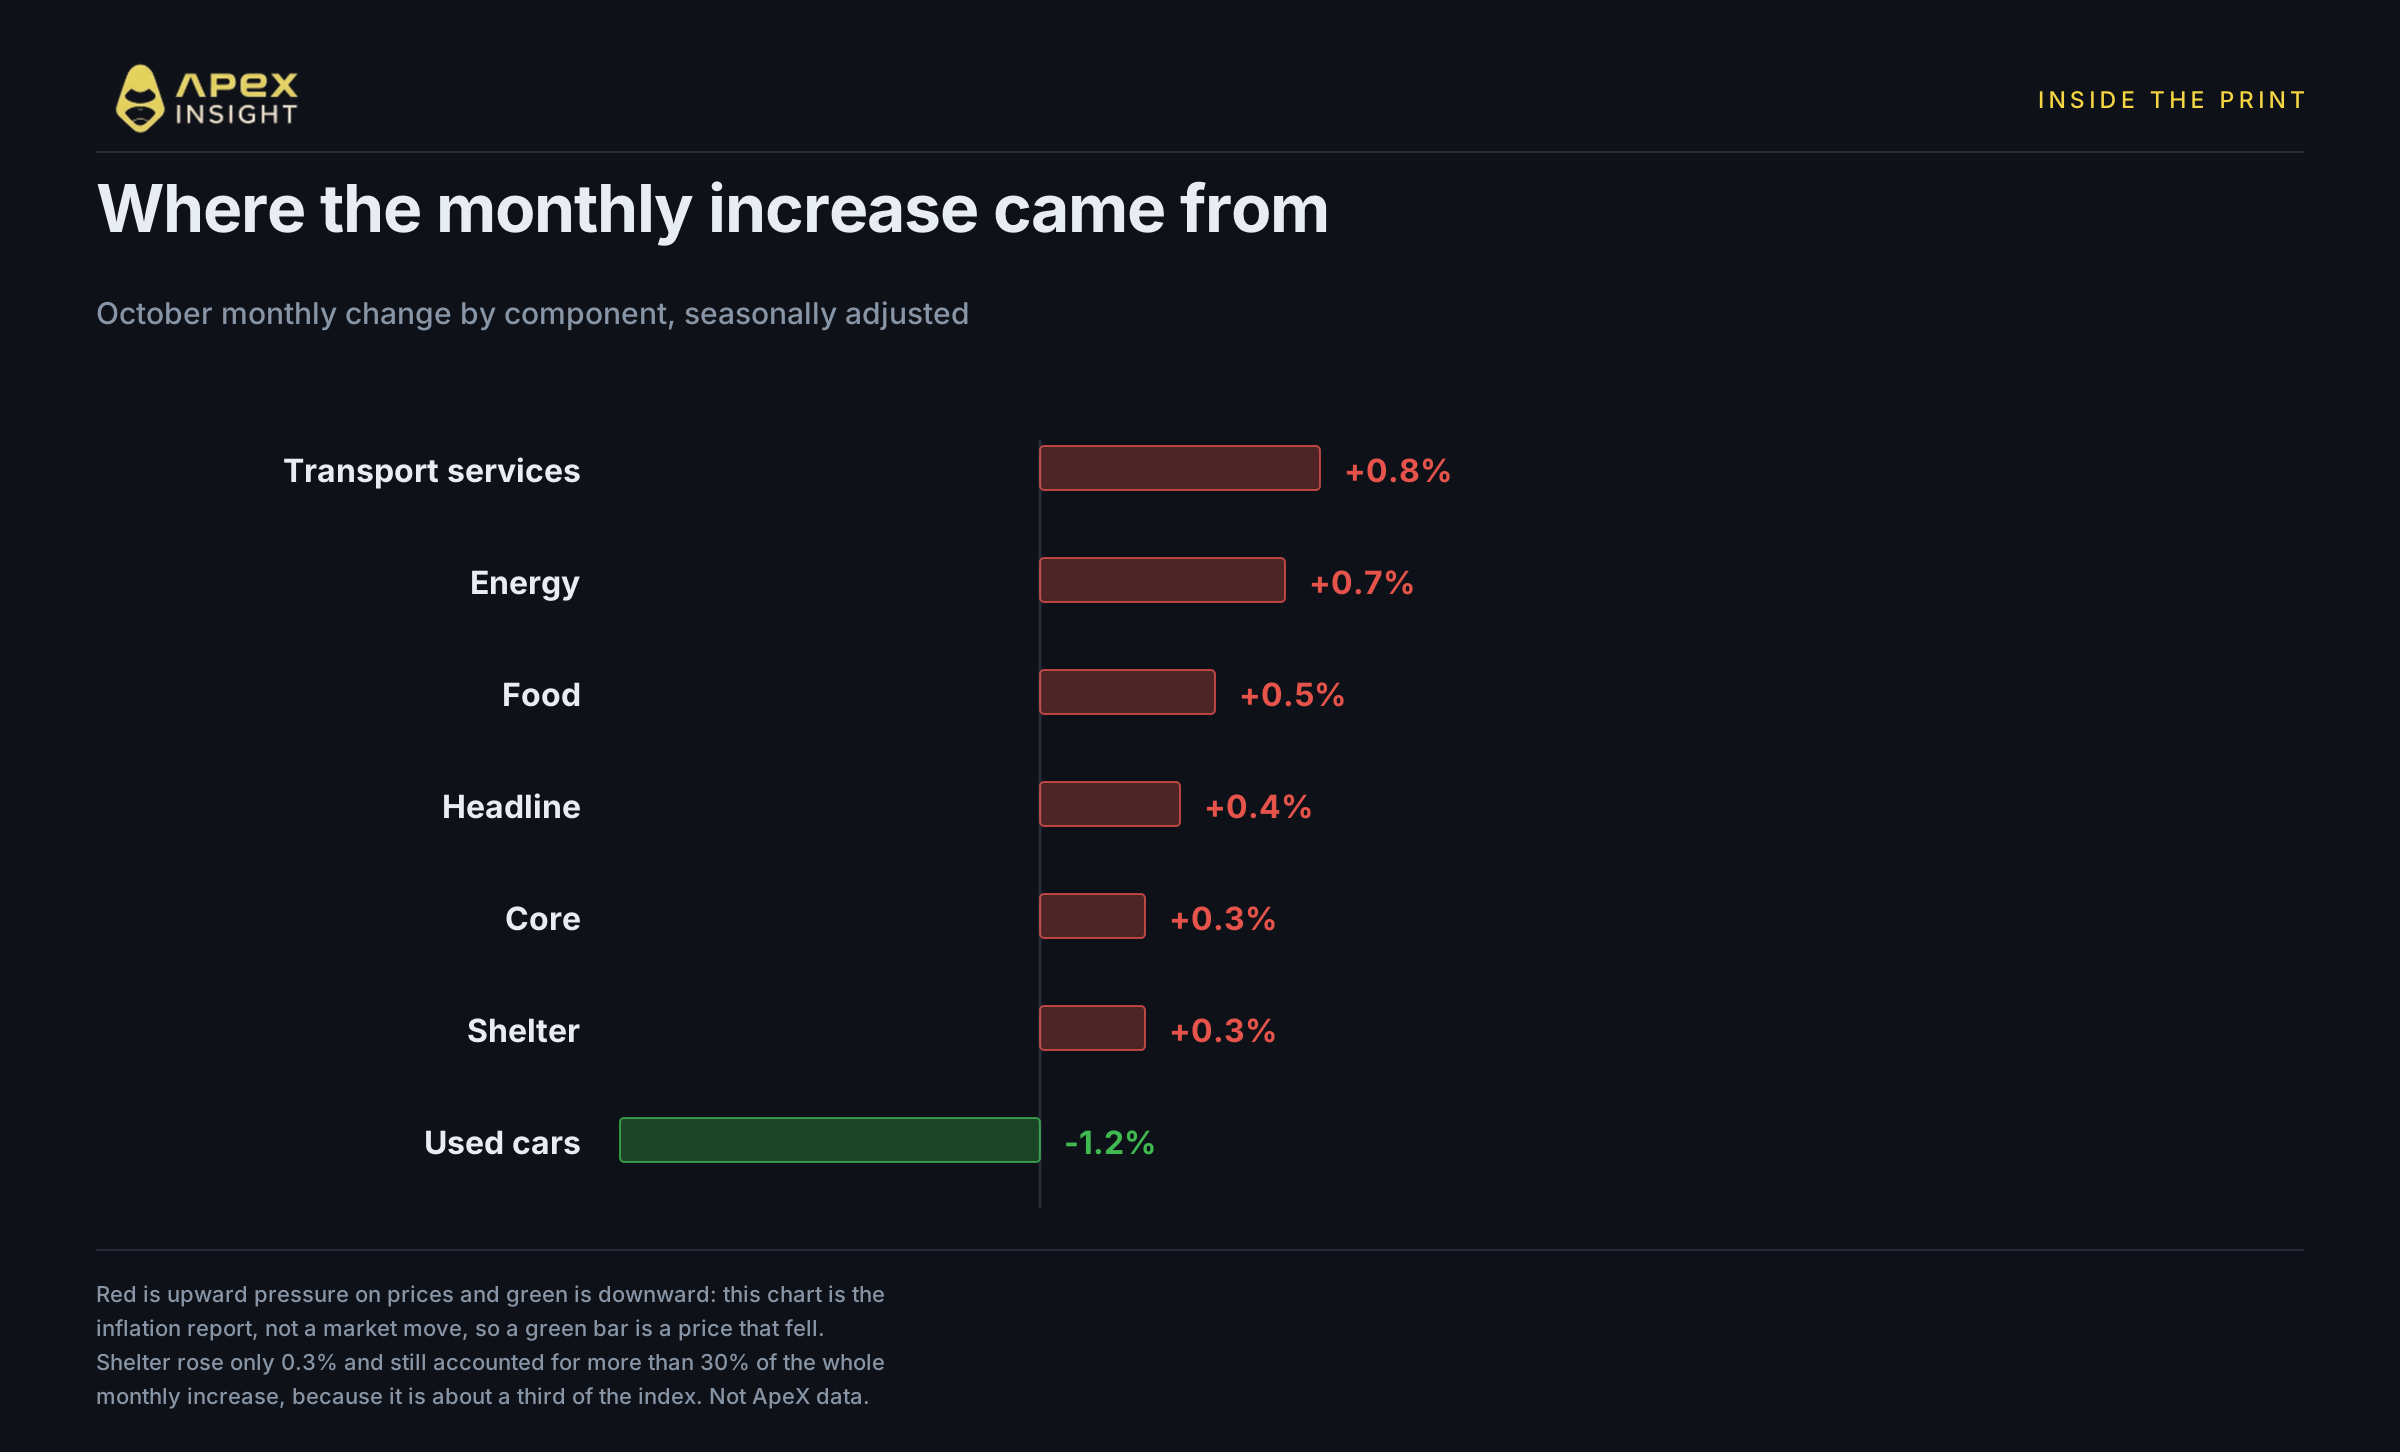
Shelter rose 0.3% in October, slower than September's 0.4%. It still accounted for more than 30% of the entire monthly all-items increase, by the BLS's own attribution.
That is the structural problem. Shelter is roughly a third of the index, and it is measured through leases that turn over slowly, so it lags actual market rents by many months. A central bank raising rates to slow shelter inflation is acting on a series that will not respond for the better part of a year, which is one reason this fight has lasted as long as it has.
The rest of the month breaks down like this:
Component | September | October |
|---|---|---|
Headline | +0.6% | +0.4% |
Core | +0.3% | +0.3% |
Energy | +5.2% | +0.7% |
Food | 0.0% | +0.5% |
Shelter | +0.4% | +0.3% |
Transportation services | +0.6% | +0.8% |
Energy decelerating from 5.2% to 0.7% is the reason the headline fell at all. Gasoline rose 1.0% after a 9.1% surge in September. Food went the other way, from flat to 0.5%, led by snacks, dairy and fresh produce, with beef up 0.9%.
Set against that, the awkward fact is that core did not improve while energy was decelerating. Vanguard's senior US economist Josh Hirt put that down to a longer-lasting pass-through from the earlier energy shock into core, and said the firm now projects core at 3.2% by year end.
4. Why did a hot print push gold down?
Because gold does not pay anything.
Hold a bar of gold for a year and you receive no interest, no dividend and no coupon. Hold cash in a short-dated Treasury instead and you receive the policy rate. The gap between those two is the cost of owning gold, and it moves with the real interest rate, which is the policy rate minus expected inflation.
A hot CPI print raises expected inflation, which helps gold. But it can raise the expected policy rate by more, because the central bank is expected to respond. The most coherent reading of Tuesday is that the second effect won. Reuters reported both the dollar and Treasury yields climbing on the print, which is what that looks like from the outside.
The dollar is a second channel in its own right, and worth separating from the first. Gold is priced in dollars, so a stronger dollar makes it more expensive in every other currency and tends to push the dollar price down, whatever real rates are doing. Two mechanisms pointed the same way on Tuesday, and a single session cannot tell you how much each contributed.
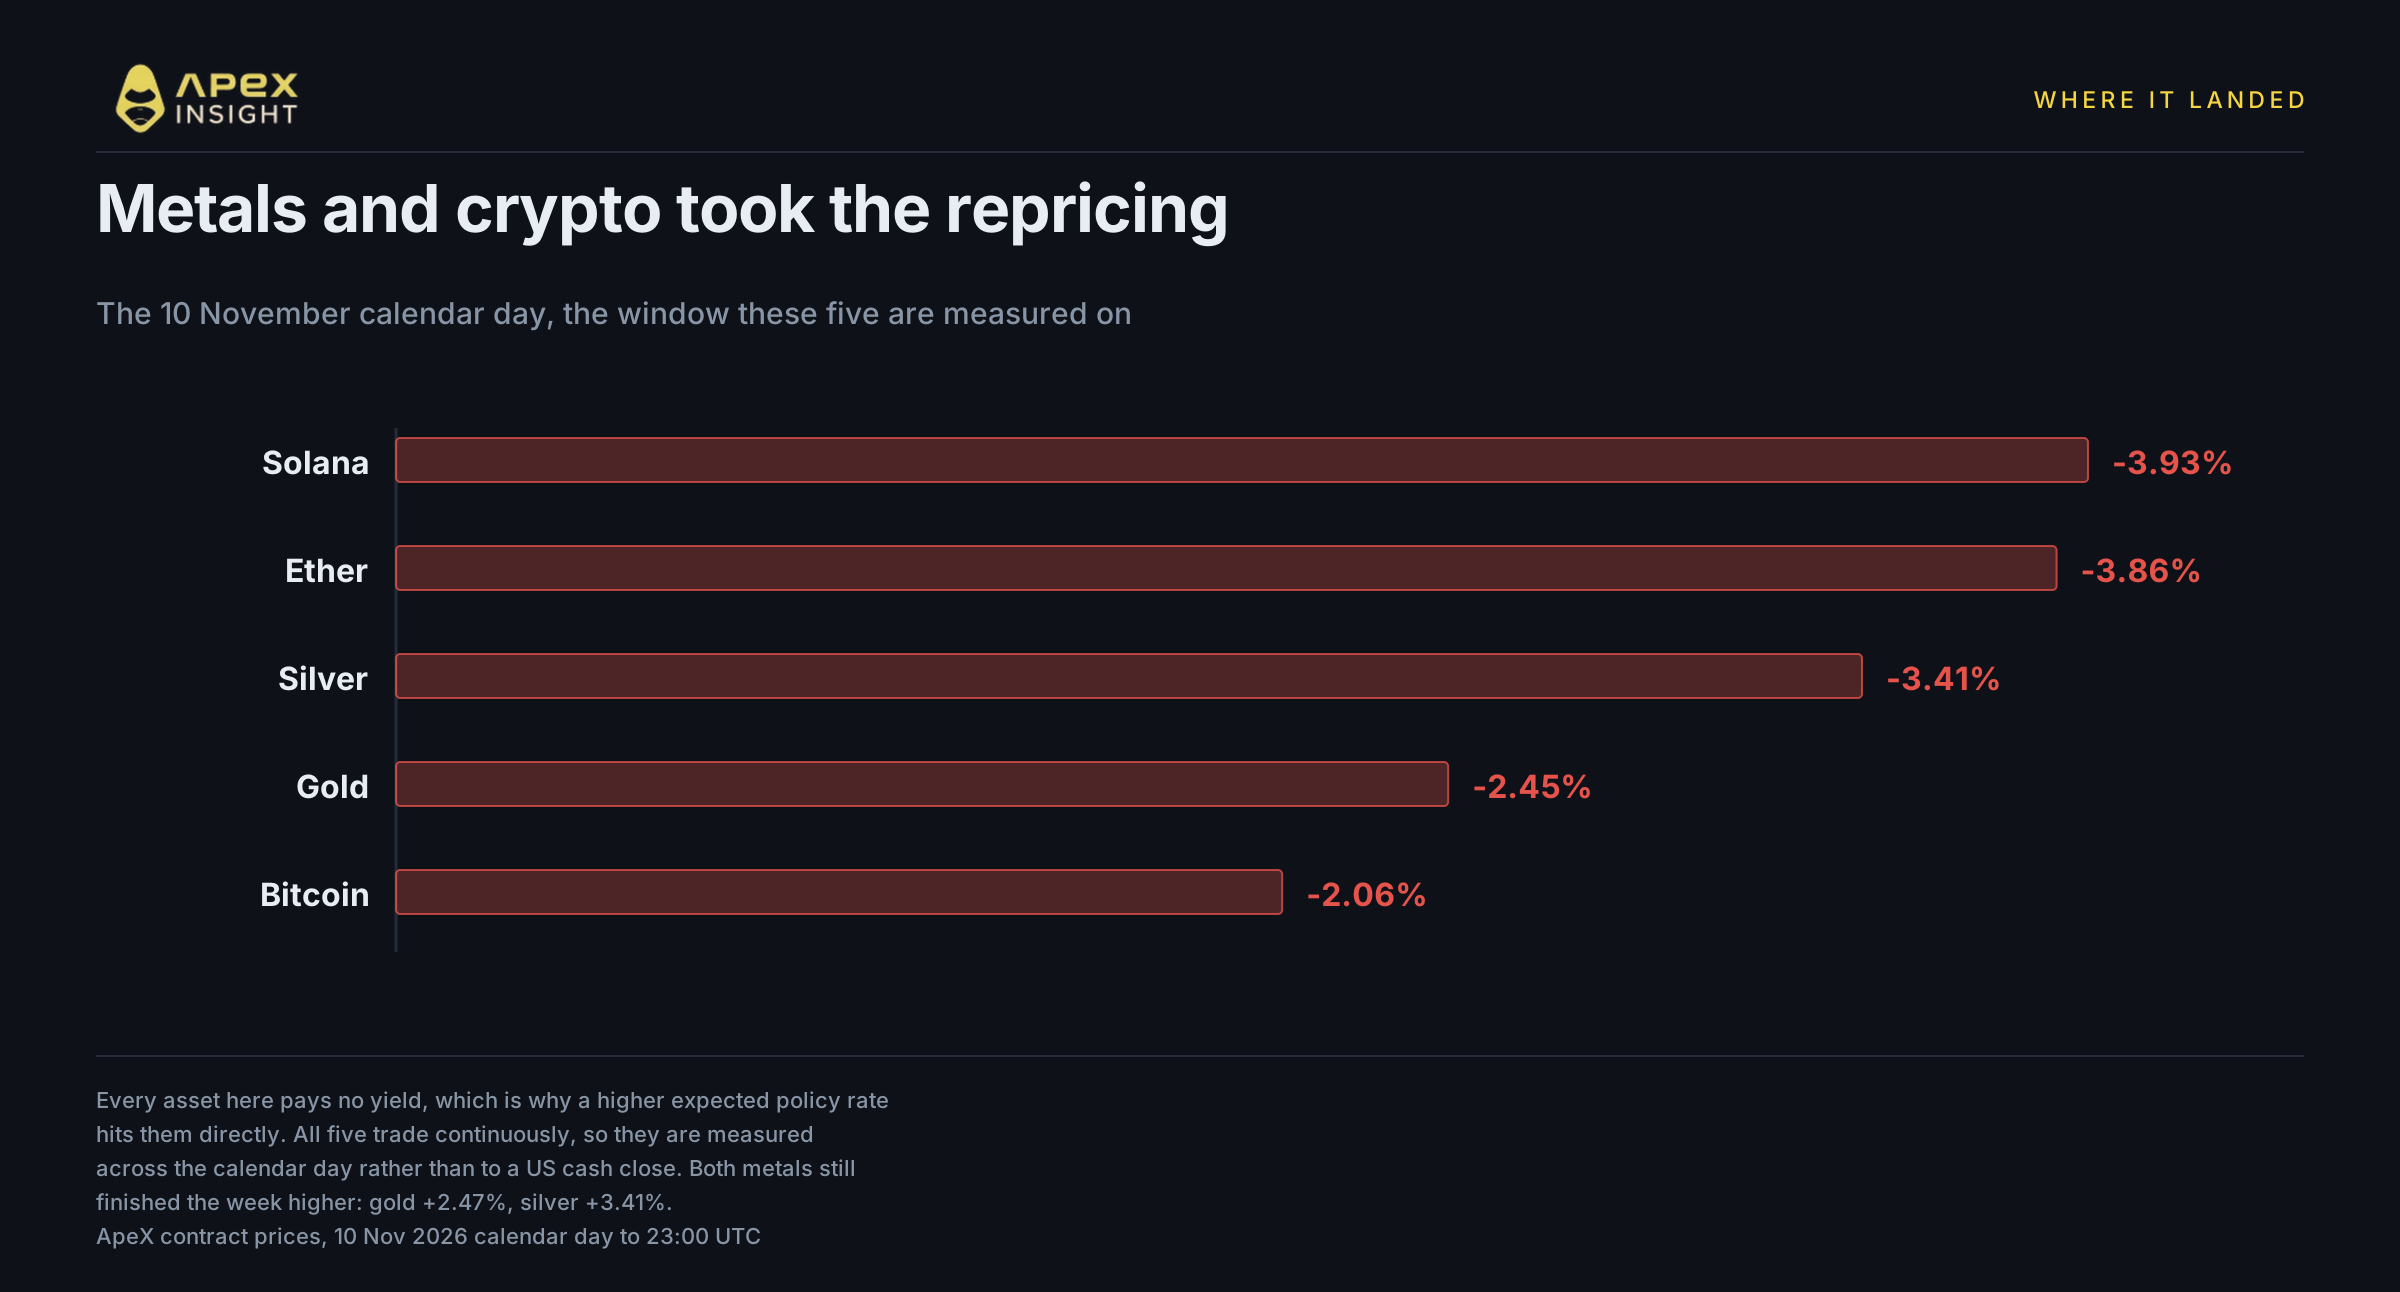
On the ApeX contract, over the 10 November calendar day. These five trade continuously, so they are measured to the 23:00 UTC close rather than to a cash close that does not apply to them:
Contract | 10 Nov day | Week to 10 Nov | Below 200-day high |
|---|---|---|---|
-2.45% | +2.47% | -19.89% | |
-3.41% | +3.41% | -42.31% | |
-2.06% | -4.73% | -15.55% | |
-3.86% | -9.74% | -26.86% | |
-3.93% | -10.30% | -33.32% |
Three things in that table deserve care. First, both metals are up on the week despite the session fall, so this was one day's repricing inside a rising week, not a trend break. Second, silver is 42.31% below its 200-day high while gold is 19.89% below its own, which is the usual pattern: silver carries industrial demand on top of the monetary story and moves further in both directions. Third, silver's two figures are not a typo. It fell 3.4076% on the session and rose 3.4075% on the week, which round to the same number by coincidence.
Crypto fell alongside the metals rather than with the equity market, which fits the same real-rate logic. Bitcoin has no yield either. Total crypto market capitalisation fell 1.6% to $2.57 trillion over the 24 hours around the print.
The honest limit on all of this: one session is one session. Gold has fallen on hot prints and risen on hot prints, depending on whether the market reads the central bank as likely to chase the number or likely to look through it. This time it read "chase".
5. Everything fell in the same hour, then stopped
This is the part worth keeping.
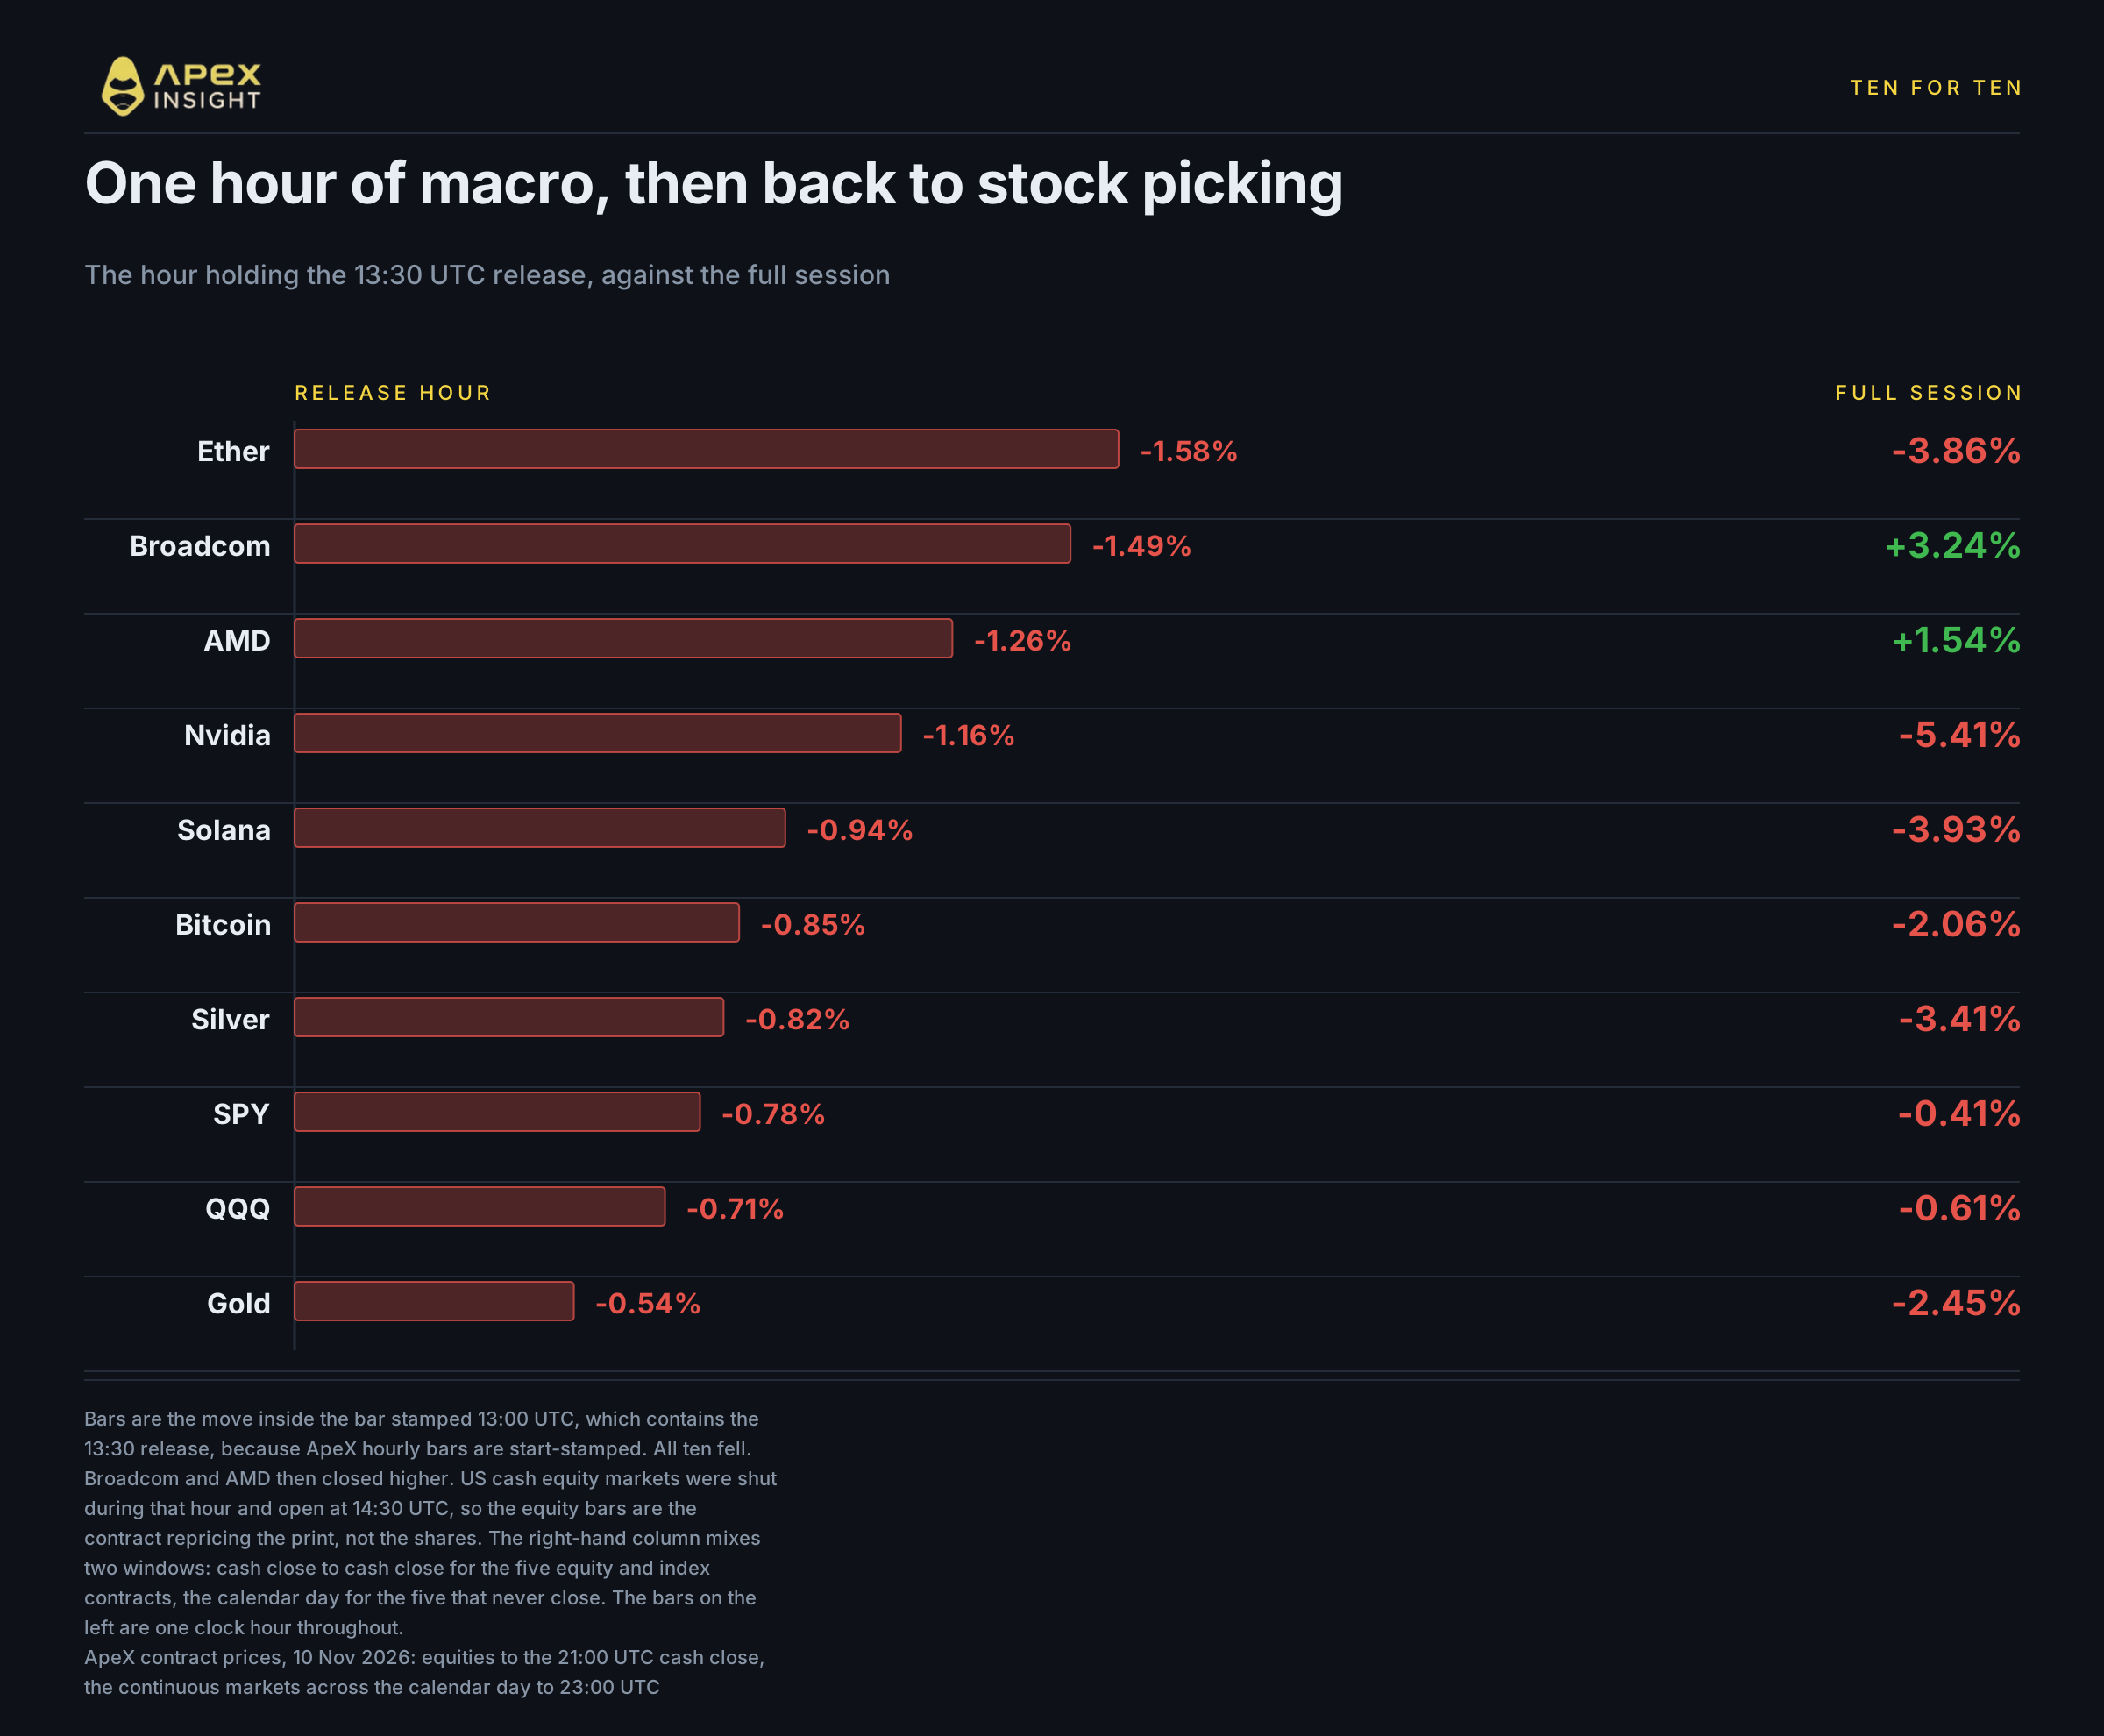
ApeX hourly bars are start-stamped, so the bar stamped 13:00 UTC is the hour that contains the 13:30 release. Measured open to close inside that single bar, every one of the ten contracts tracked here fell. Not most. All ten.
Contract | Release hour | Full session |
|---|---|---|
-1.58% | -3.86% | |
-1.49% | +3.24% | |
-1.26% | +1.54% | |
-1.16% | -5.41% | |
-0.94% | -3.93% | |
-0.85% | -2.06% | |
-0.82% | -3.41% | |
-0.78% | -0.41% | |
-0.71% | -0.61% | |
-0.54% | -2.45% |
Broadcom and AMD are the two to look at. Broadcom fell 1.49% in the release hour and finished the session up 3.24%. AMD fell 1.26% and finished up 1.54%. The most coherent reading is that for one hour the discount rate was the only thing being priced, and it hit everything. After that, company-specific stories reasserted themselves and two names reversed completely.
One qualification that is essential rather than decorative. US cash equity markets were shut during that hour. They open at 14:30 UTC in winter, an hour after the release. So the equity moves in the 13:00 bar are the TradFi perp repricing the print while the underlying shares were not trading at all. That is a real feature of these contracts rather than a flaw in the data, and it is the clearest practical reason a trader would use one: CPI lands at 13:30 UTC and the cash market cannot respond for another hour.
It also means the equity rows in that table are not comparable to the metals and crypto rows, which were trading in continuous markets. Treat the hour as evidence that the perp repriced immediately, not as a measurement of what the shares did.
The right-hand column mixes two conventions for the same reason. For the five equity and index contracts it runs cash close to cash close at 21:00 UTC; for gold, silver, bitcoin, ether and solana it runs across the calendar day to 23:00 UTC, because those markets never close. The release-hour column on the left is a single clock hour and is directly comparable all the way down.
And keep the size in proportion. These are moves between 0.54% and 1.58%. The signal is that they all pointed the same way, not that any one of them was large. These ten are also a hand-picked basket rather than a sample: three crypto assets, three AI semiconductor names, two US index funds and two precious metals are not ten independent observations, and the names inside each of those groups move together anyway.
6. What is actually dated from here
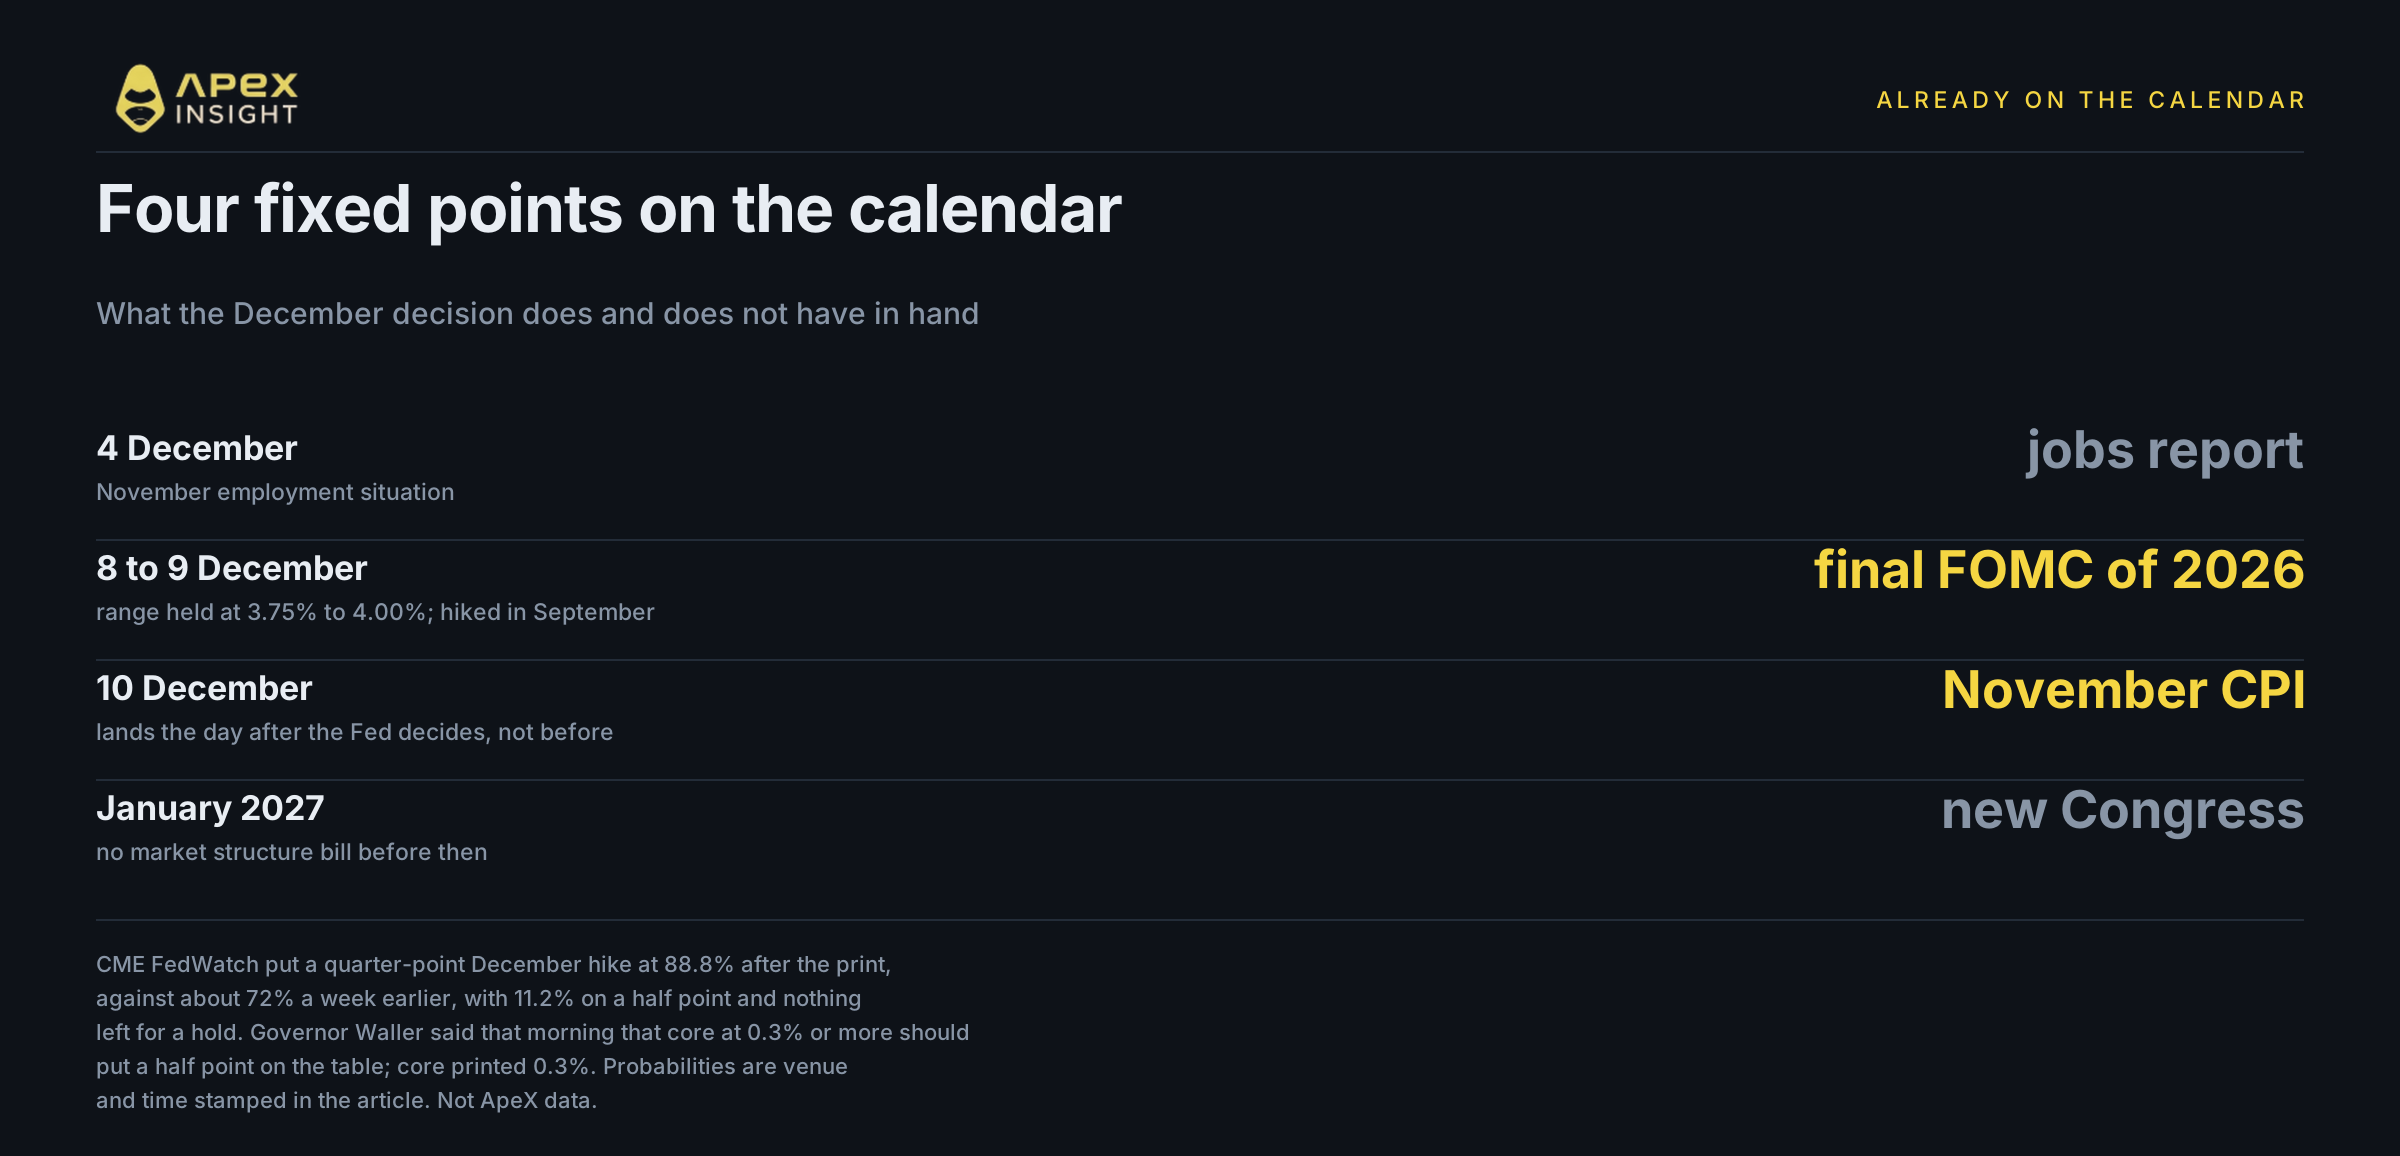
Most of what a market prices after a data release is a guess about a decision nobody has taken. Here, unusually, the next steps are on a published calendar.
Date | Event |
|---|---|
4 December | November employment report |
8 to 9 December | Final FOMC meeting of 2026 |
10 December | November CPI, the day after the Fed decides |
January 2027 | New Congress convenes |
The Fed holds its target range at 3.75% to 4.00%. It raised rates in September, its first increase in three years, then held on 28 October by 10 votes to 2, with Governor Lisa Cook and Cleveland Fed President Beth Hammack both dissenting in favour of hiking. The committee also upgraded its description of growth from solid to strong.
After the print, CME FedWatch put a December quarter-point hike at 88.8%, up from about 72% a week earlier, with 11.2% on a half-point move and a hold no longer priced at all: those two figures sum to exactly 100. Polymarket showed 85% on a quarter point and 12.7% on something larger than a quarter point, as reported at 15:18 UTC on 10 November. Those last two are close but not the same question: the CME figure is a half point specifically, the Polymarket one is a half point or more. A Reuters poll of 101 economists taken from 6 to 10 November was unanimous on a quarter-point December increase, and 45 of the 101 expected at least two more hikes.
Then there is the part that is easy to miss. Governor Christopher Waller, speaking in London on the morning of the release, said he would support at least a quarter-point hike in December even if October inflation had improved, and that if core came in at 0.3% or more, a half point should be considered.
Core came in at exactly 0.3%. The threshold the Fed's most hawkish governor set in the morning was met by the data that afternoon, which is the real reason a half-point hike went from barely on the board to priced in double digits inside two hours.
Note the ordering in that table, because it is the detail that will matter in four weeks. The Fed decides on 9 December and the November CPI lands on 10 December. The committee will take its last decision of the year without the next inflation reading in hand.
Trade gold and silver
Go long or short gold, silver and bitcoin from one cross-margin account.
The no-yield assets. These respond most directly to the real rate, and they moved together on the print rather than one at a time.
The index against its own largest member. The gap between these two legs is far larger than the index leg's own move.
The two that reversed. Both fell in the release hour and closed the session higher.
Trading carries a high risk of loss, and leverage increases both gains and losses. Nothing here is financial advice, and none of it is a recommendation to buy or sell anything. Do your own research and size positions you can afford to lose.
If you need any help, feel free to reach out to our team on Discord.
Website: https://www.apex.exchange
Twitter: https://twitter.com/OfficialApeXdex
Telegram: https://t.me/ApeXdex
Methodology. Contract figures are our own arithmetic on ApeX Omni contract prices and are not exchange cash prices. The session window runs from the 9 November US cash close to the 10 November US cash close, and the week window from 3 November, both at 21:00 UTC, which is the US cash close now that US daylight saving has ended; every boundary in this article is on standard time, so no window here straddles the change. True 24 hour contracts, which here are XAU, XAG, BTC, ETH and SOL, are measured on the calendar day to 23:00 UTC instead. Hourly bars are start-stamped, so the bar stamped 13:00 UTC is the hour containing the 13:30 UTC release. The 200-day high is taken from each contract's own daily bars with the first bar of its history excluded as a listing placeholder; the five contracts shown with that column trade continuously, so no weekend filter applies to them. CPI figures, Fed votes, poll results and market-implied probabilities are from the sources hyperlinked at each claim and are not ApeX data. TradFi contracts on ApeX settle against an index rather than the underlying asset, and ApeX lists them separately from its crypto perpetuals in its own contract data. Figures are as at 11 November 2026 and will go stale.