





Everyone spent this week watching the chip stocks. Something larger happened underneath.
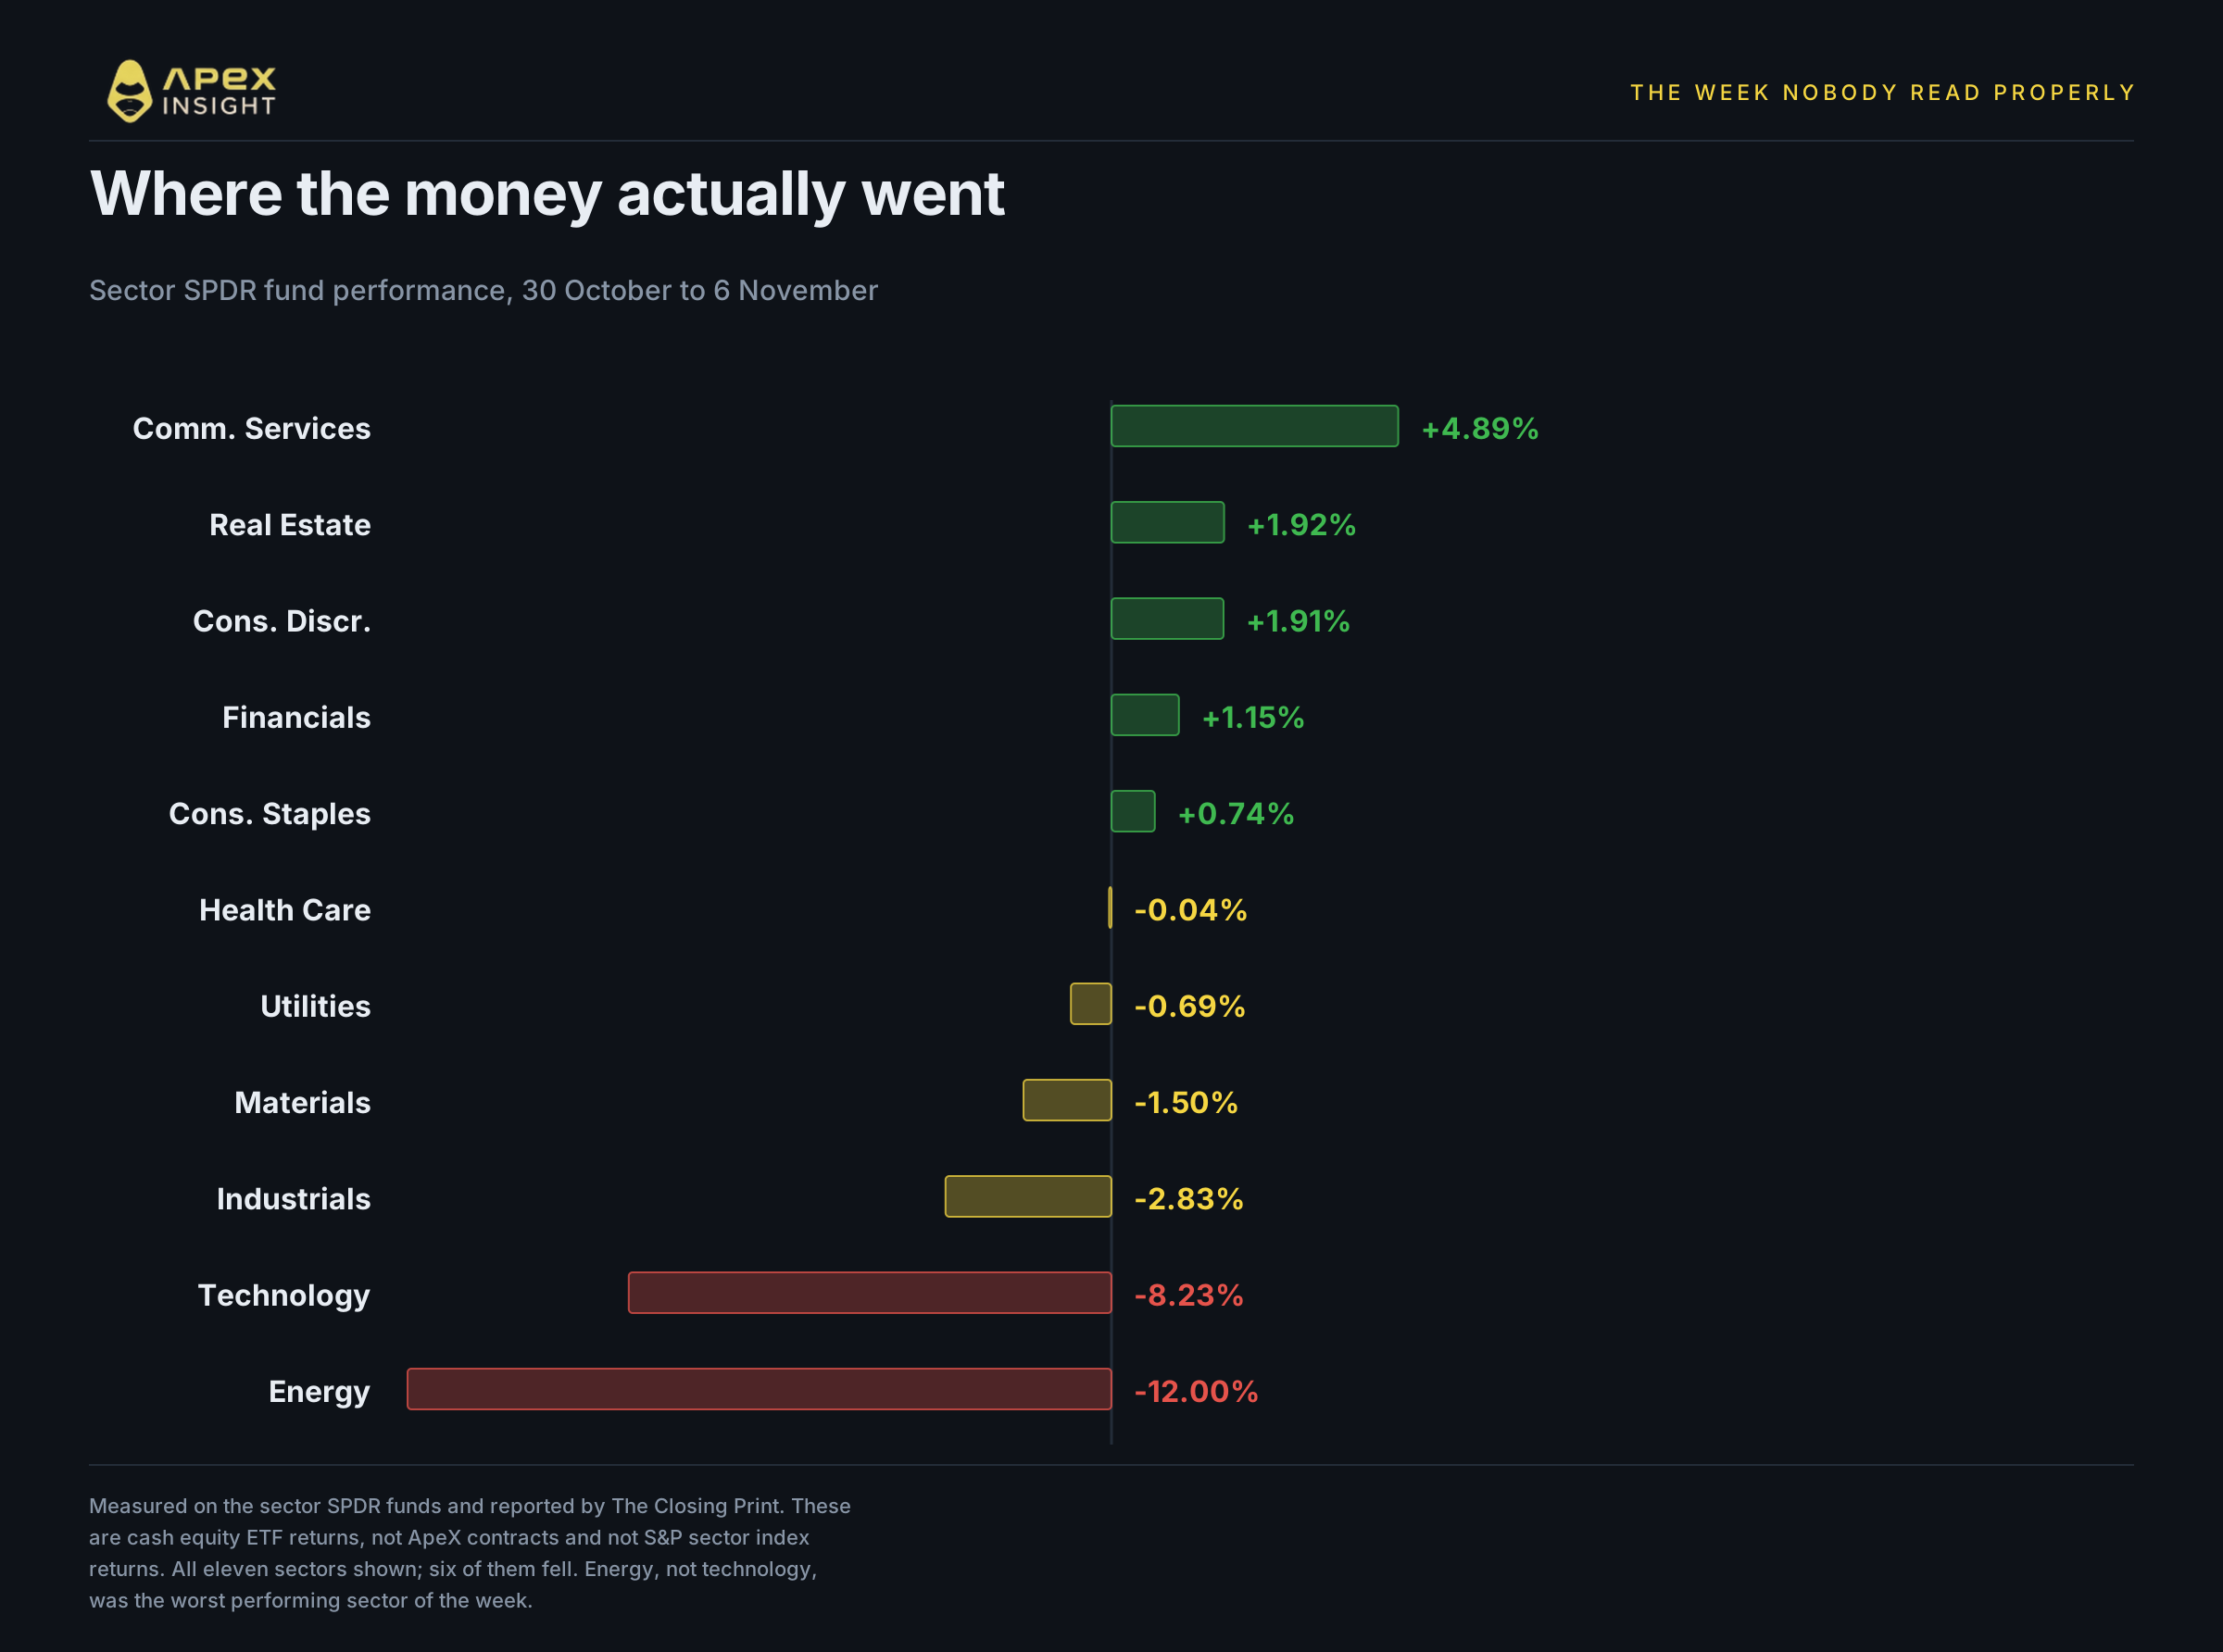
Energy was the worst performing sector of the week, not technology. Energy fell 12.00% against technology's 8.23%. Brent had its worst week since April 2020.
Two crashes, one week, one election behind both of them. And almost nothing in common between them beyond that.
US markets are shut for the weekend, so every figure here is measured to Friday's close. Equity and commodity contracts keep printing through Saturday and Sunday on thin order flow that reflects positioning rather than the underlying asset, so no weekend price is quoted as a move anywhere in this piece.
Here are six things the week's tape shows.
1. Energy, not technology, was the worst sector
Start with the thing that got buried.
Measured on the sector SPDR funds, the week reads: Energy down 12.00%, Technology down 8.23%, Industrials down 2.83%, Materials down 1.50%, Utilities down 0.69% and Health Care flat at 0.04% lower. On the other side, Communication Services up 4.89%, Real Estate up 1.92%, Consumer Discretionary up 1.91%, Financials up 1.15% and Consumer Staples up 0.74%. That is all eleven sectors, and six of them fell.
The indices hid most of that. The Nasdaq Composite finished the week 3.37% lower, the S&P 500 2.68%, the Russell 2000 2.05% and the Dow 0.94%. Those index numbers are not mild: the S&P's 2.68% was its worst week since April 2025. But they still understate what happened underneath, where two sectors lost a tenth of their value or close to it.
Friday itself was a rebound. The Nasdaq rose 1.09%, the S&P 0.31% and the Russell 0.89%, while the Dow fell 0.46%.
2. Oil fell on peace, not on demand
Here is the half of the story that did not make the front pages.
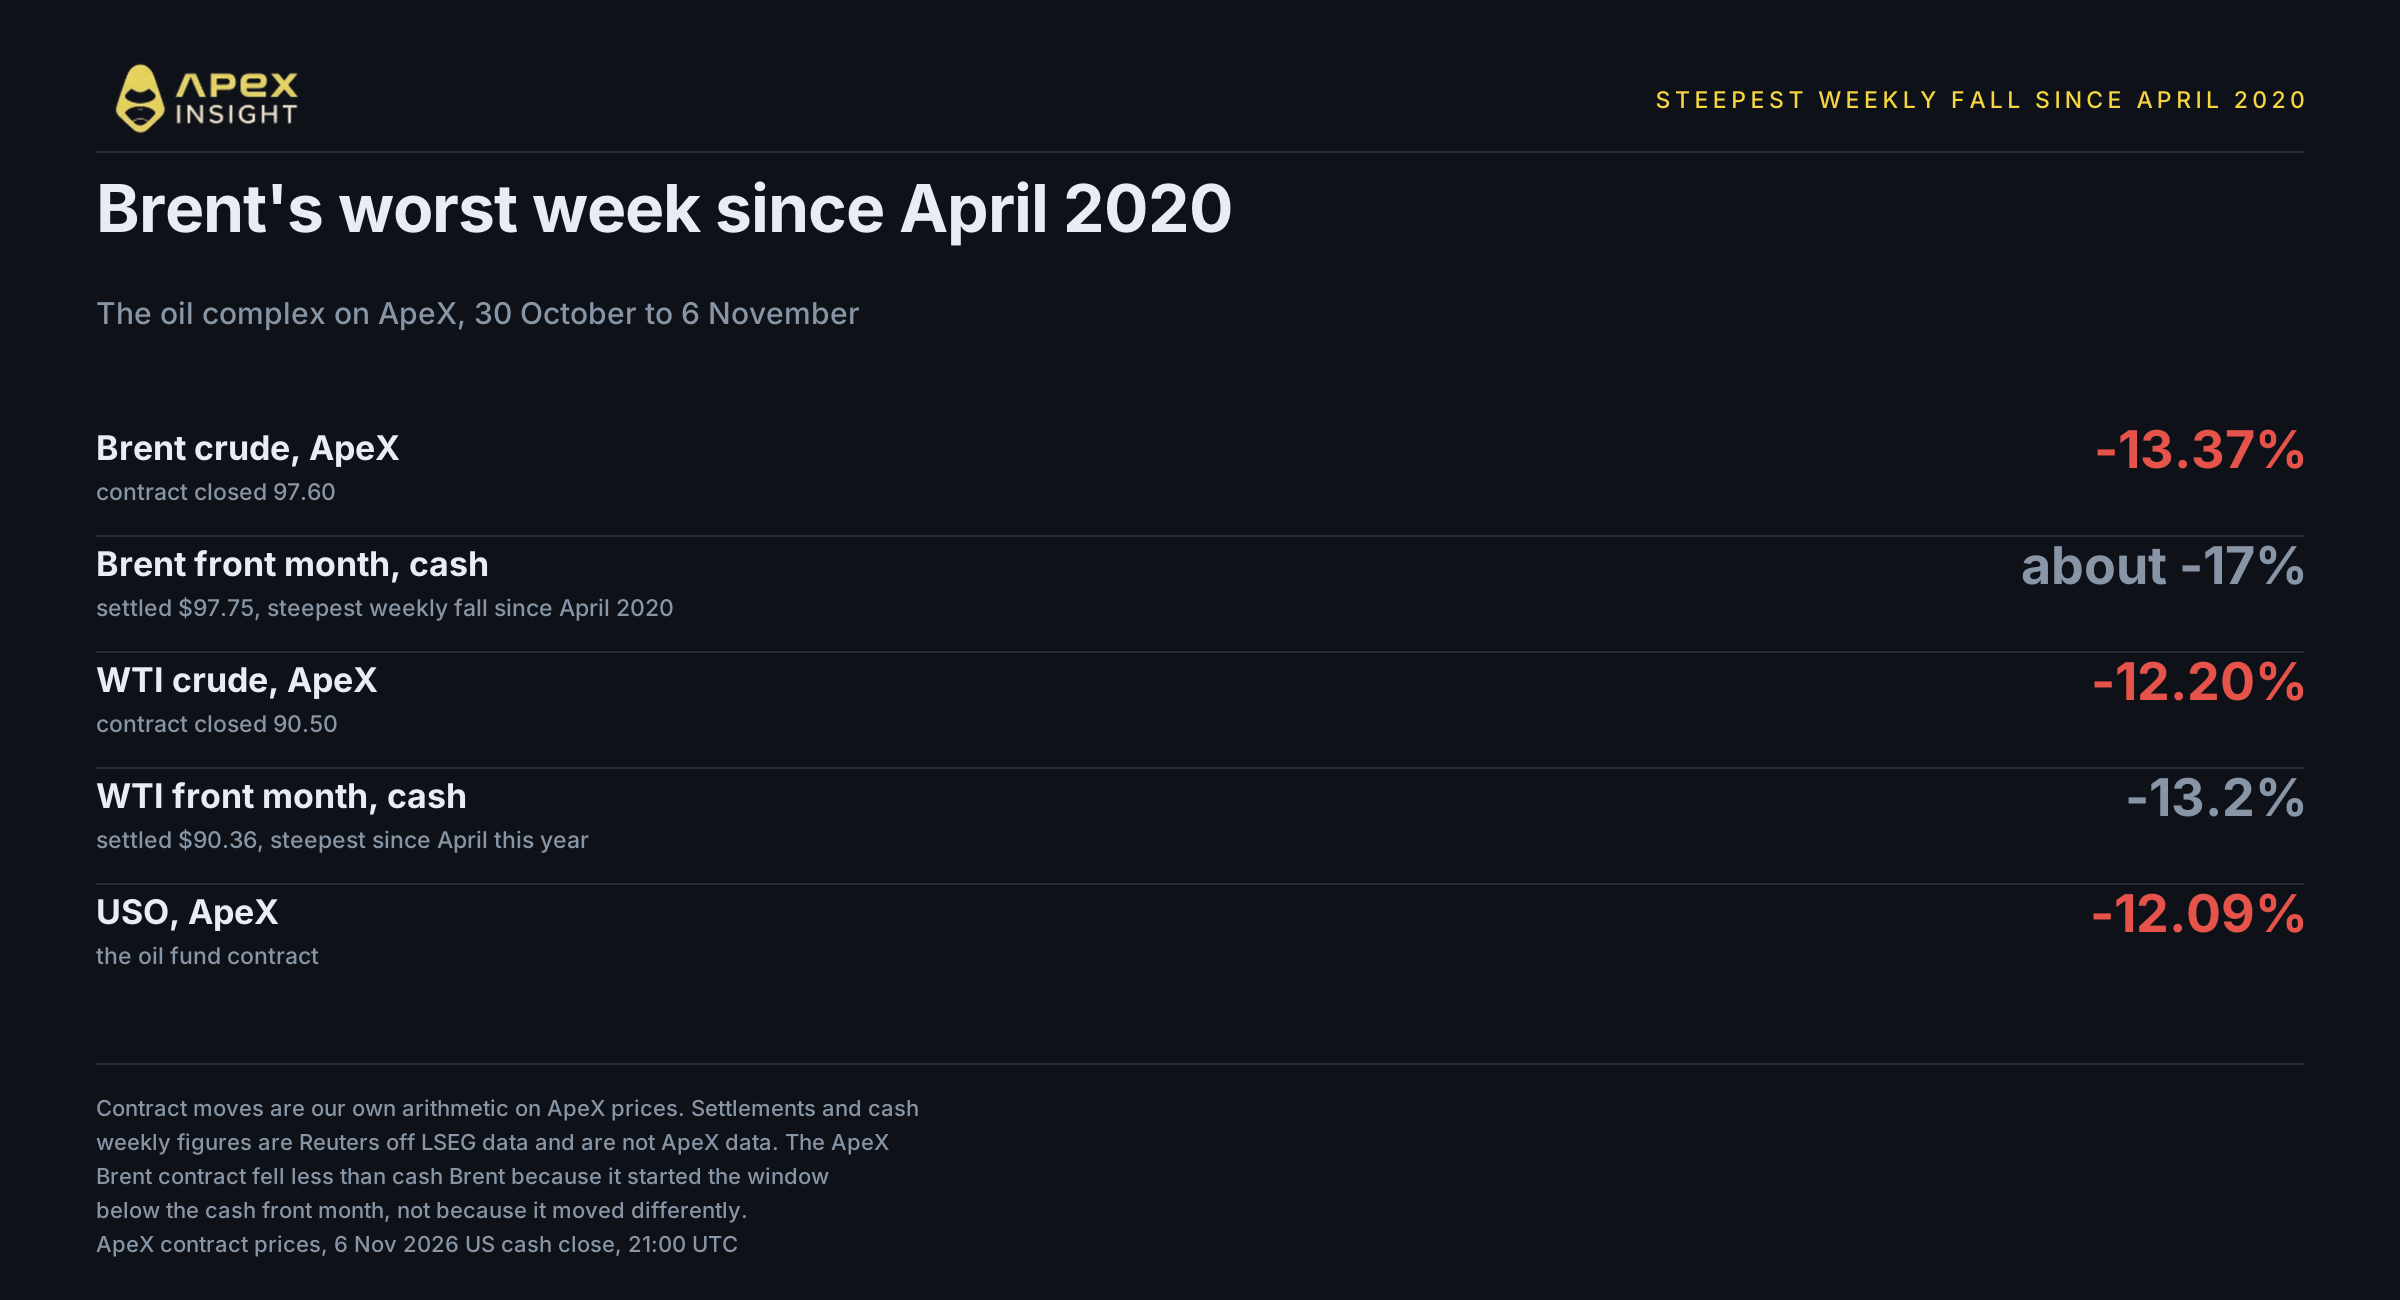
Brent fell about 17% over the week, its steepest weekly percentage fall since late April 2020 and, in absolute terms, the largest in LSEG data going back to 1988. WTI's 13.2% fall was its steepest since April this year. Brent settled Friday at $97.75 and WTI at $90.36.
On ApeX the contracts fell 13.37% for Brent, 12.20% for WTI and 12.09% for USO. The WTI contract tracked its underlying closely. The Brent contract did not: it fell about three and a half points less than cash Brent, because it was already trading below the cash front month at the start of the window rather than because it moved differently through the week. Both ended Friday within cents of their settlements.
The reason is Iran. Traders spent the week pricing a faster end to the war, and the midterm result is what moved that probability. Wells Fargo Investment Institute put it plainly: "The election results may pressure the president to seek to end the war more quickly". On Friday Bloomberg reported Washington and Tehran edging closer to a potential breakthrough, with Iran willing to discuss nuclear questions that had previously been off the table. An Iranian official separately told Reuters that any nuclear proposal waits until Washington meets seven demands.
Supply did its part too. Middle East Gulf crude exports excluding Iran had already returned to prewar levels on Kpler's September data, helped by greater use of pipeline routes by Saudi Arabia and the UAE, though Vortexa puts total Persian Gulf exports at only 81% of prewar volumes, so the recovery is partial and the two trackers disagree on how partial. On 5 November Saudi Arabia cut its December prices to Asian buyers to a six-year low.
Two things stop this being a tidy peace trade. The diplomacy is not done: Nationwide's Mark Hackett described oil retreating "on hopes for a deescalation in the Iran conflict, even as the diplomatic signals remain ambiguous". And the war premium is nowhere near fully unwound. WTI began 2026 near $57 and peaked near $113 in April, so even after this week it sits roughly 60% above where the year started.
3. The two crashes have almost nothing in common
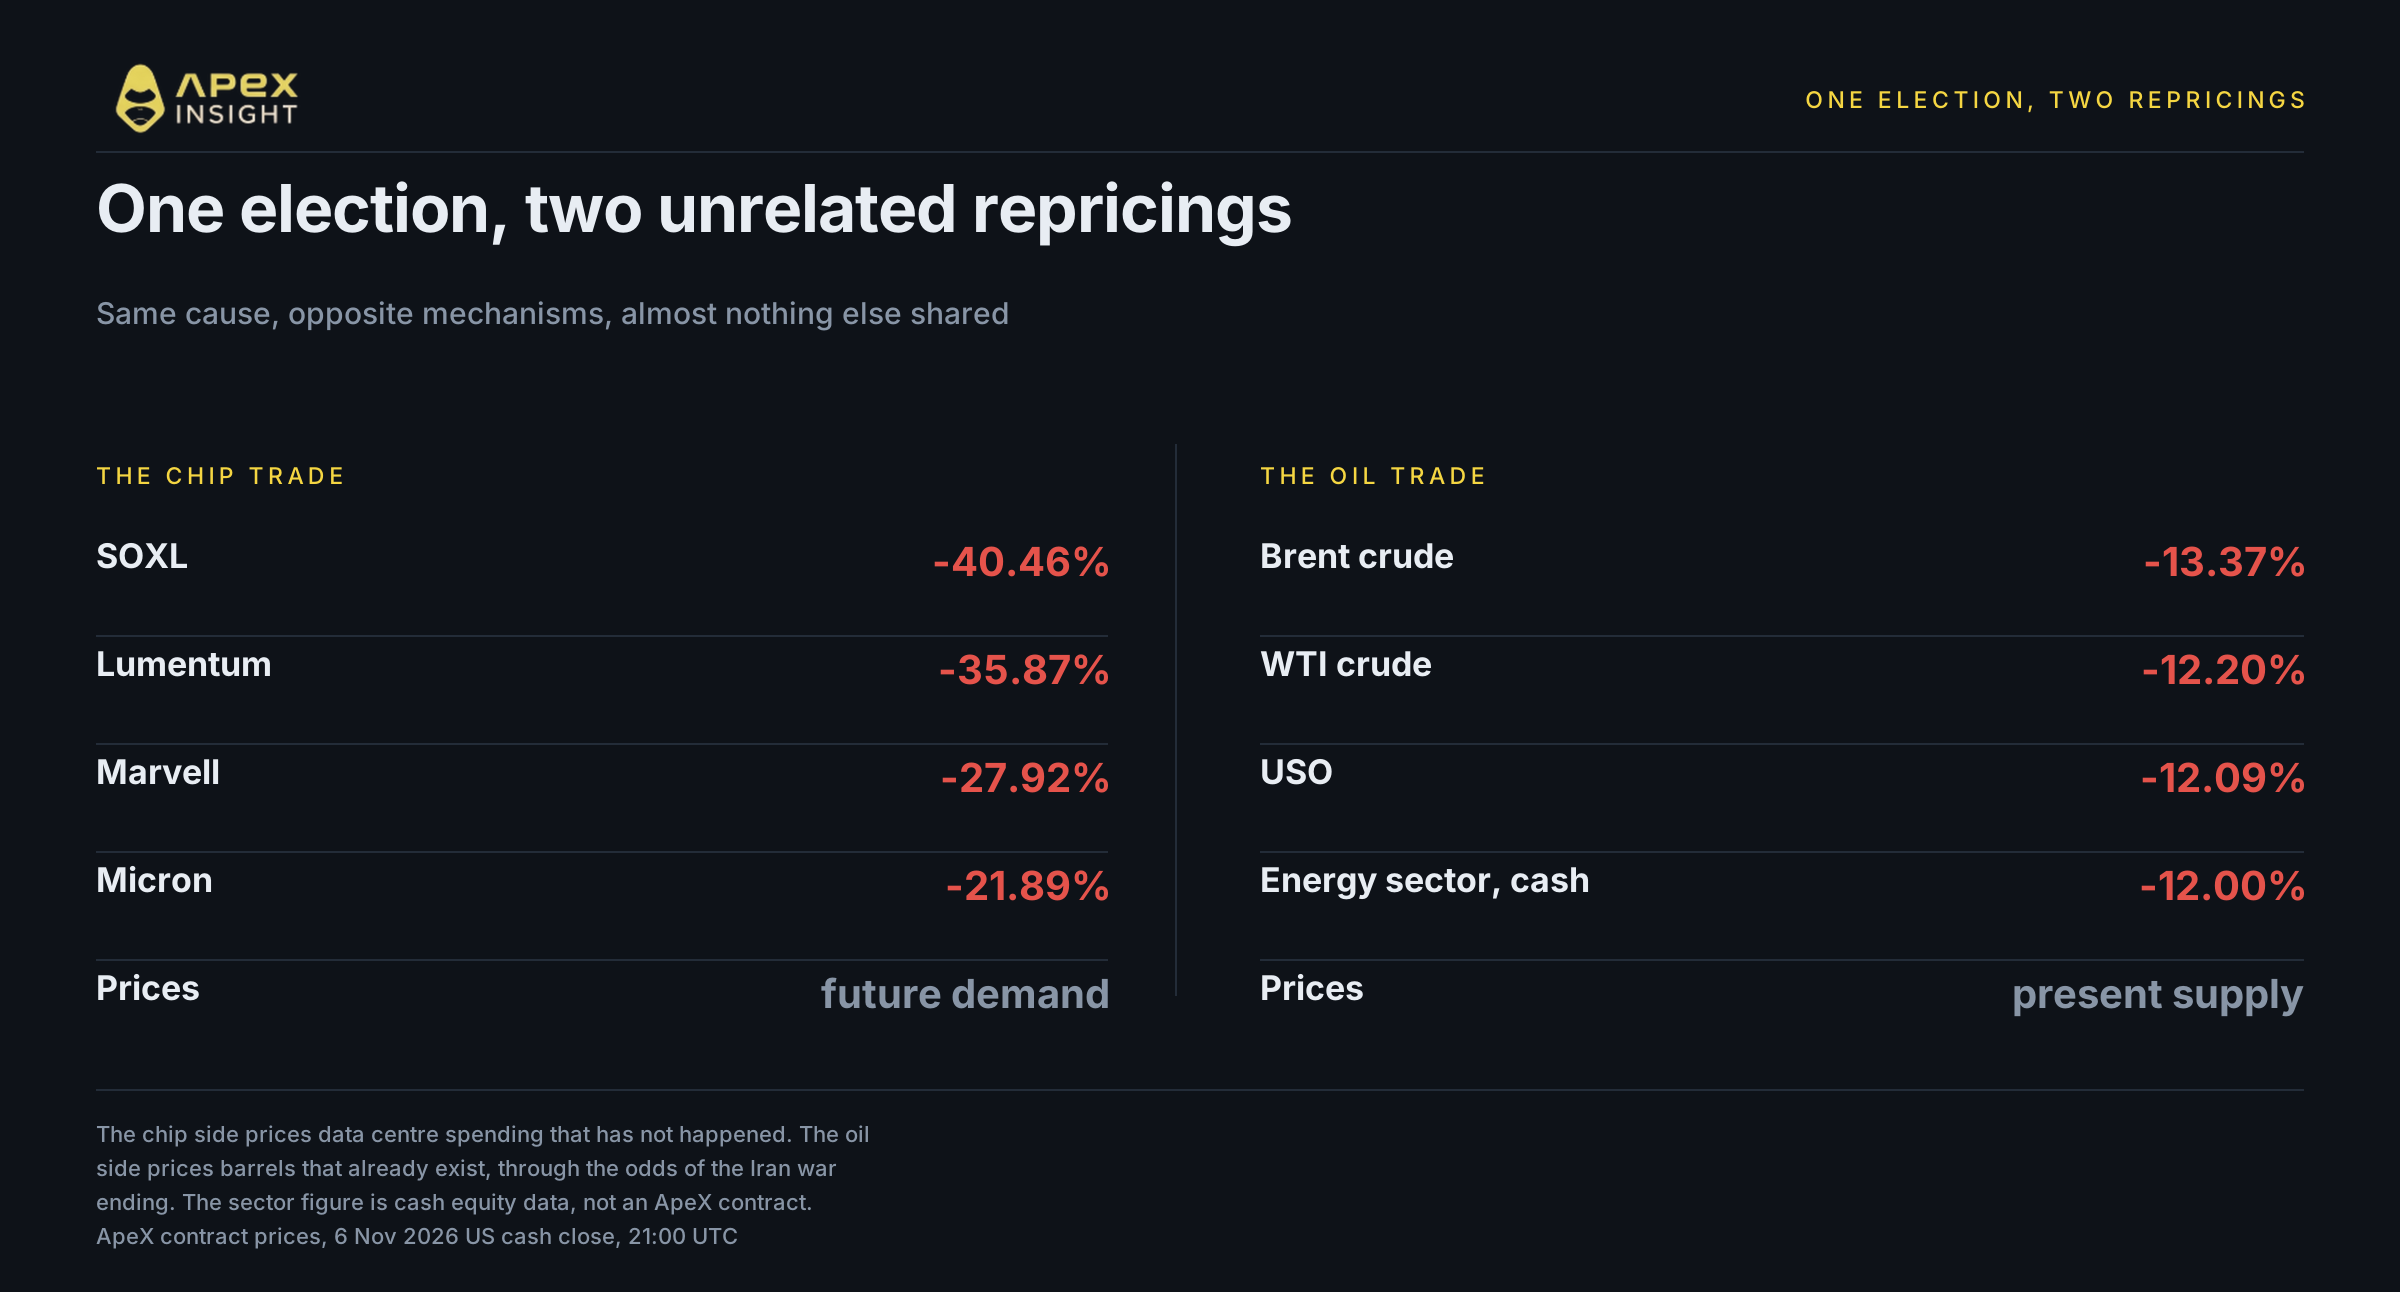
This is the part worth sitting with.
Both falls trace to the same Tuesday result, and the mechanisms could hardly be less alike.
The chip trade repriced because a Democratic sweep raised the odds of slower data centre approvals, which is a demand story about spending that has not happened yet. We covered that in detail on Thursday and Friday. On ApeX the damage was concentrated and severe: SOXL down 40.46% on the week, Lumentum 35.87%, Marvell 27.92%, Micron 21.89%.
The oil trade repriced because the same result raised the odds of a war ending, which is a supply story about barrels that are already there. Those two things share an election and nothing else. One is about future construction, the other about present production.
The counter-argument is real and comes from inside the oil market. Sasha Foss, an energy analyst at Marex Group's CSC Commodities, said "The fall in tech equities has had a negative effect on oil futures", which is the view that this was one risk-off move rather than two independent repricings. The dollar strengthened on Friday, which pushed the same way, though it finished the week slightly lower.
That reading has a problem, though. If this were a single risk-off wave, the assets usually first to go in one would have gone. They did not, which is section 5.
4. The money went to metals and gas
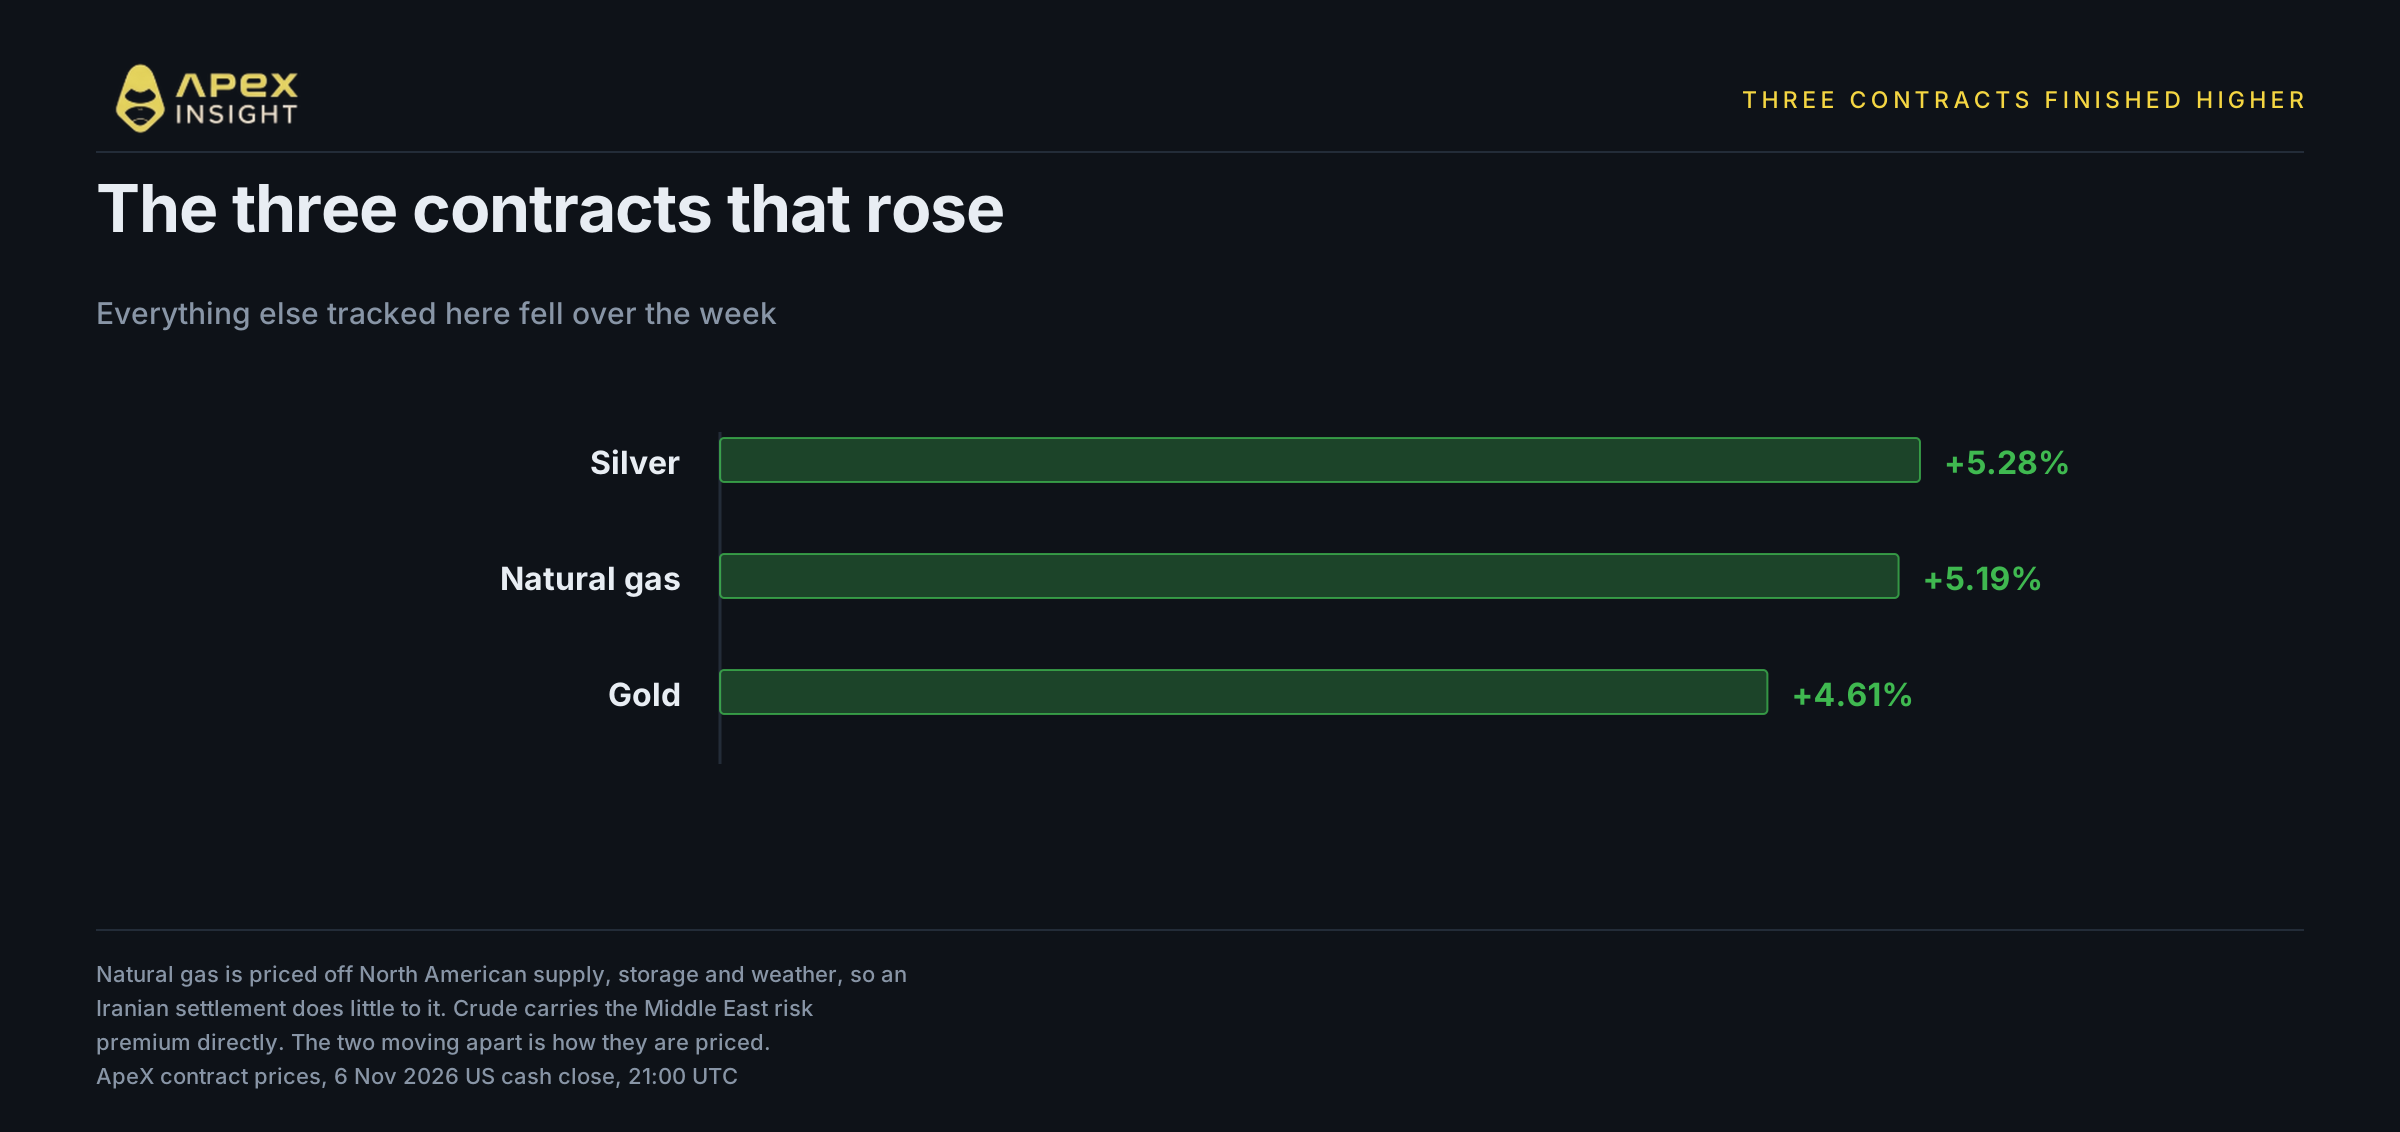
Three of the contracts tracked here finished the week higher, and all three are commodities.
Silver rose 5.28%, natural gas 5.19% and gold 4.61%. Worth noting against the easy story: this is the first up week for either metal in over a month. Measured Friday to Friday on ApeX, gold fell in each of the three preceding weeks and silver in each of the four.
Natural gas rising while crude collapses looks odd until you notice they are not the same market. Crude is priced globally and carries the Middle East risk premium directly. North American natural gas is regional, priced off domestic supply, storage and winter weather, and an Iranian settlement does very little to it. That is a claim about Henry Hub, not about gas everywhere: Qatar ships LNG through the Strait of Hormuz, so the global LNG market is not insulated in the same way. The two moving opposite ways in one week is a feature of how they are priced, not a contradiction.
Metals are the harder call. Gold and silver rising alongside falling oil and falling equities fits a world where investors want neither growth risk nor energy risk, which is a reasonable thing to want in a week like this one. It would also fit simple momentum in a metal that has run all year. This piece cannot separate those, and anyone claiming to from one week of prices is guessing.
5. Crypto barely moved, which is the strangest part
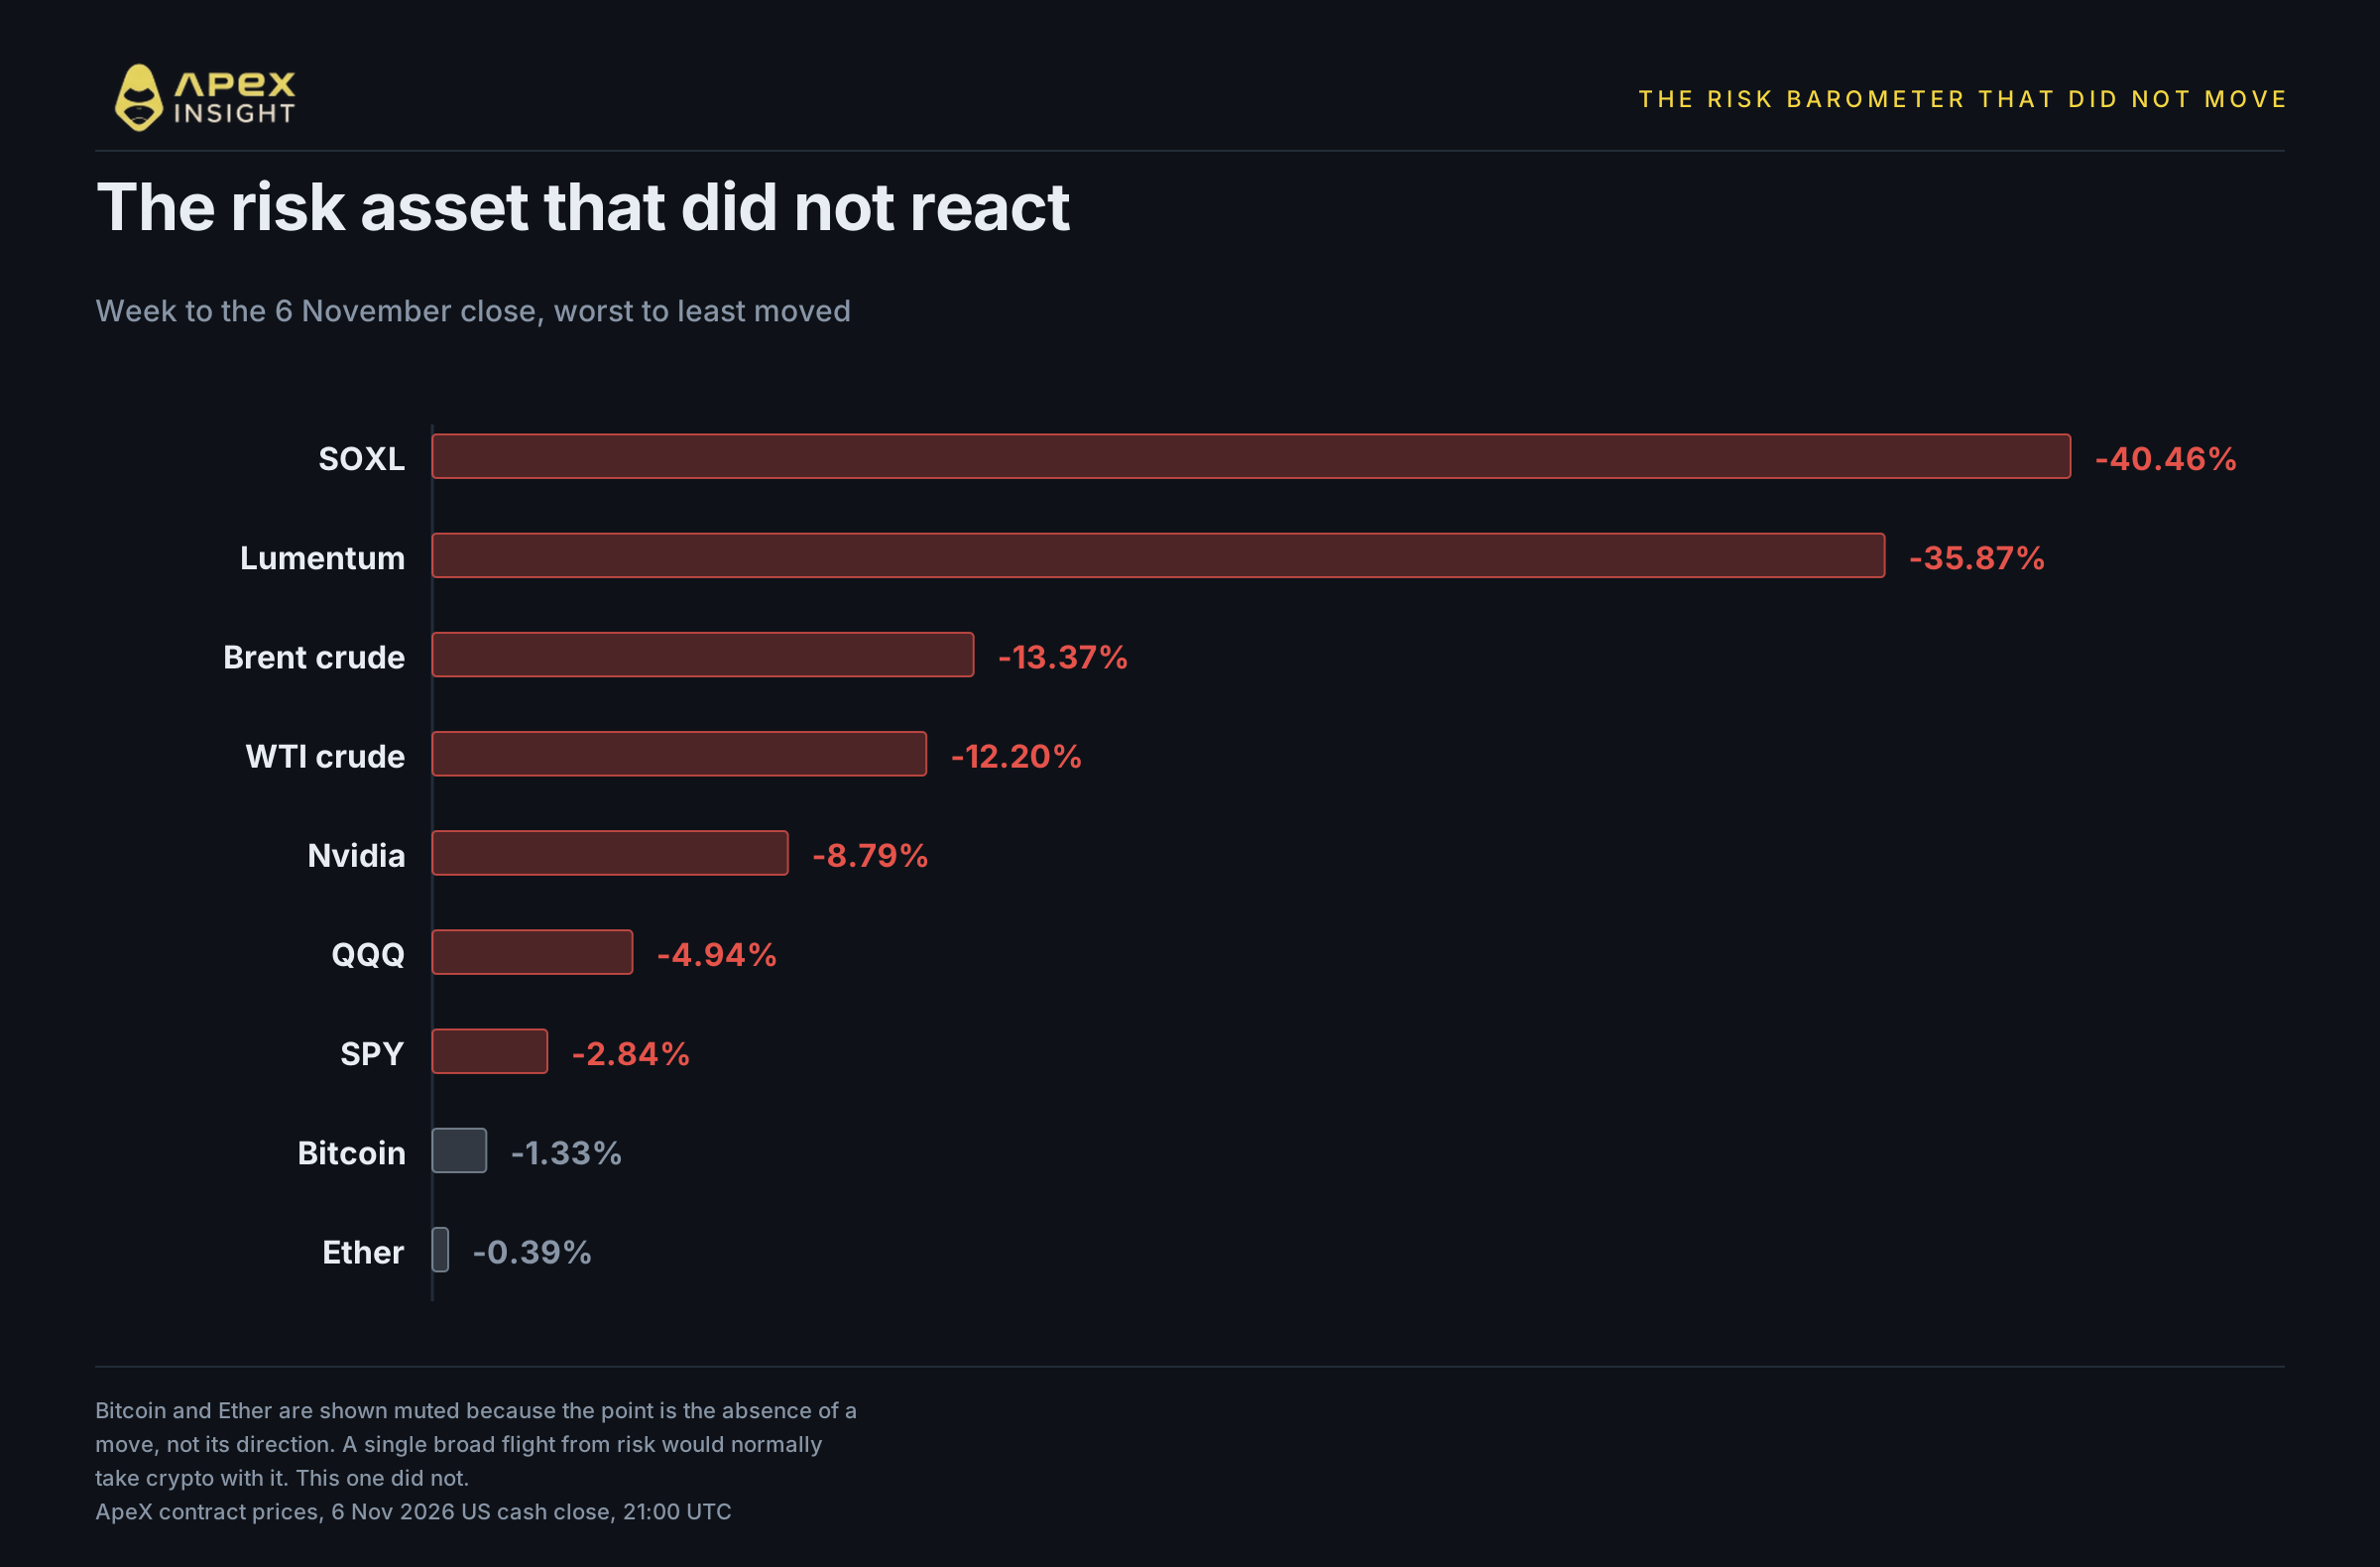
Now the dog that did not bark.
Bitcoin finished the week 1.33% lower and Ether 0.39% lower. In a week where a leveraged semiconductor product lost 40% of its value and Brent had its worst week since April 2020, the two assets most often described as the market's risk barometer did essentially nothing.
That matters for the argument in section 3. The single risk-off explanation predicts that crypto sells off with everything else, because that is what it has typically done in genuine liquidation weeks. It did not. Bitcoin and Ether sat out a week that took a tenth out of two major sectors.
The honest reading is that this was not a broad flight from risk. It was two specific trades being repriced for two specific reasons, with the rest of the market largely left alone. Crypto is the evidence for that, precisely because it did nothing.
Be careful how far you take it. Two weeks of this behaviour is a pattern; one week is an observation. Crypto has had its own difficult autumn and may simply have had less left to give.
6. Both trades price a future that has not arrived
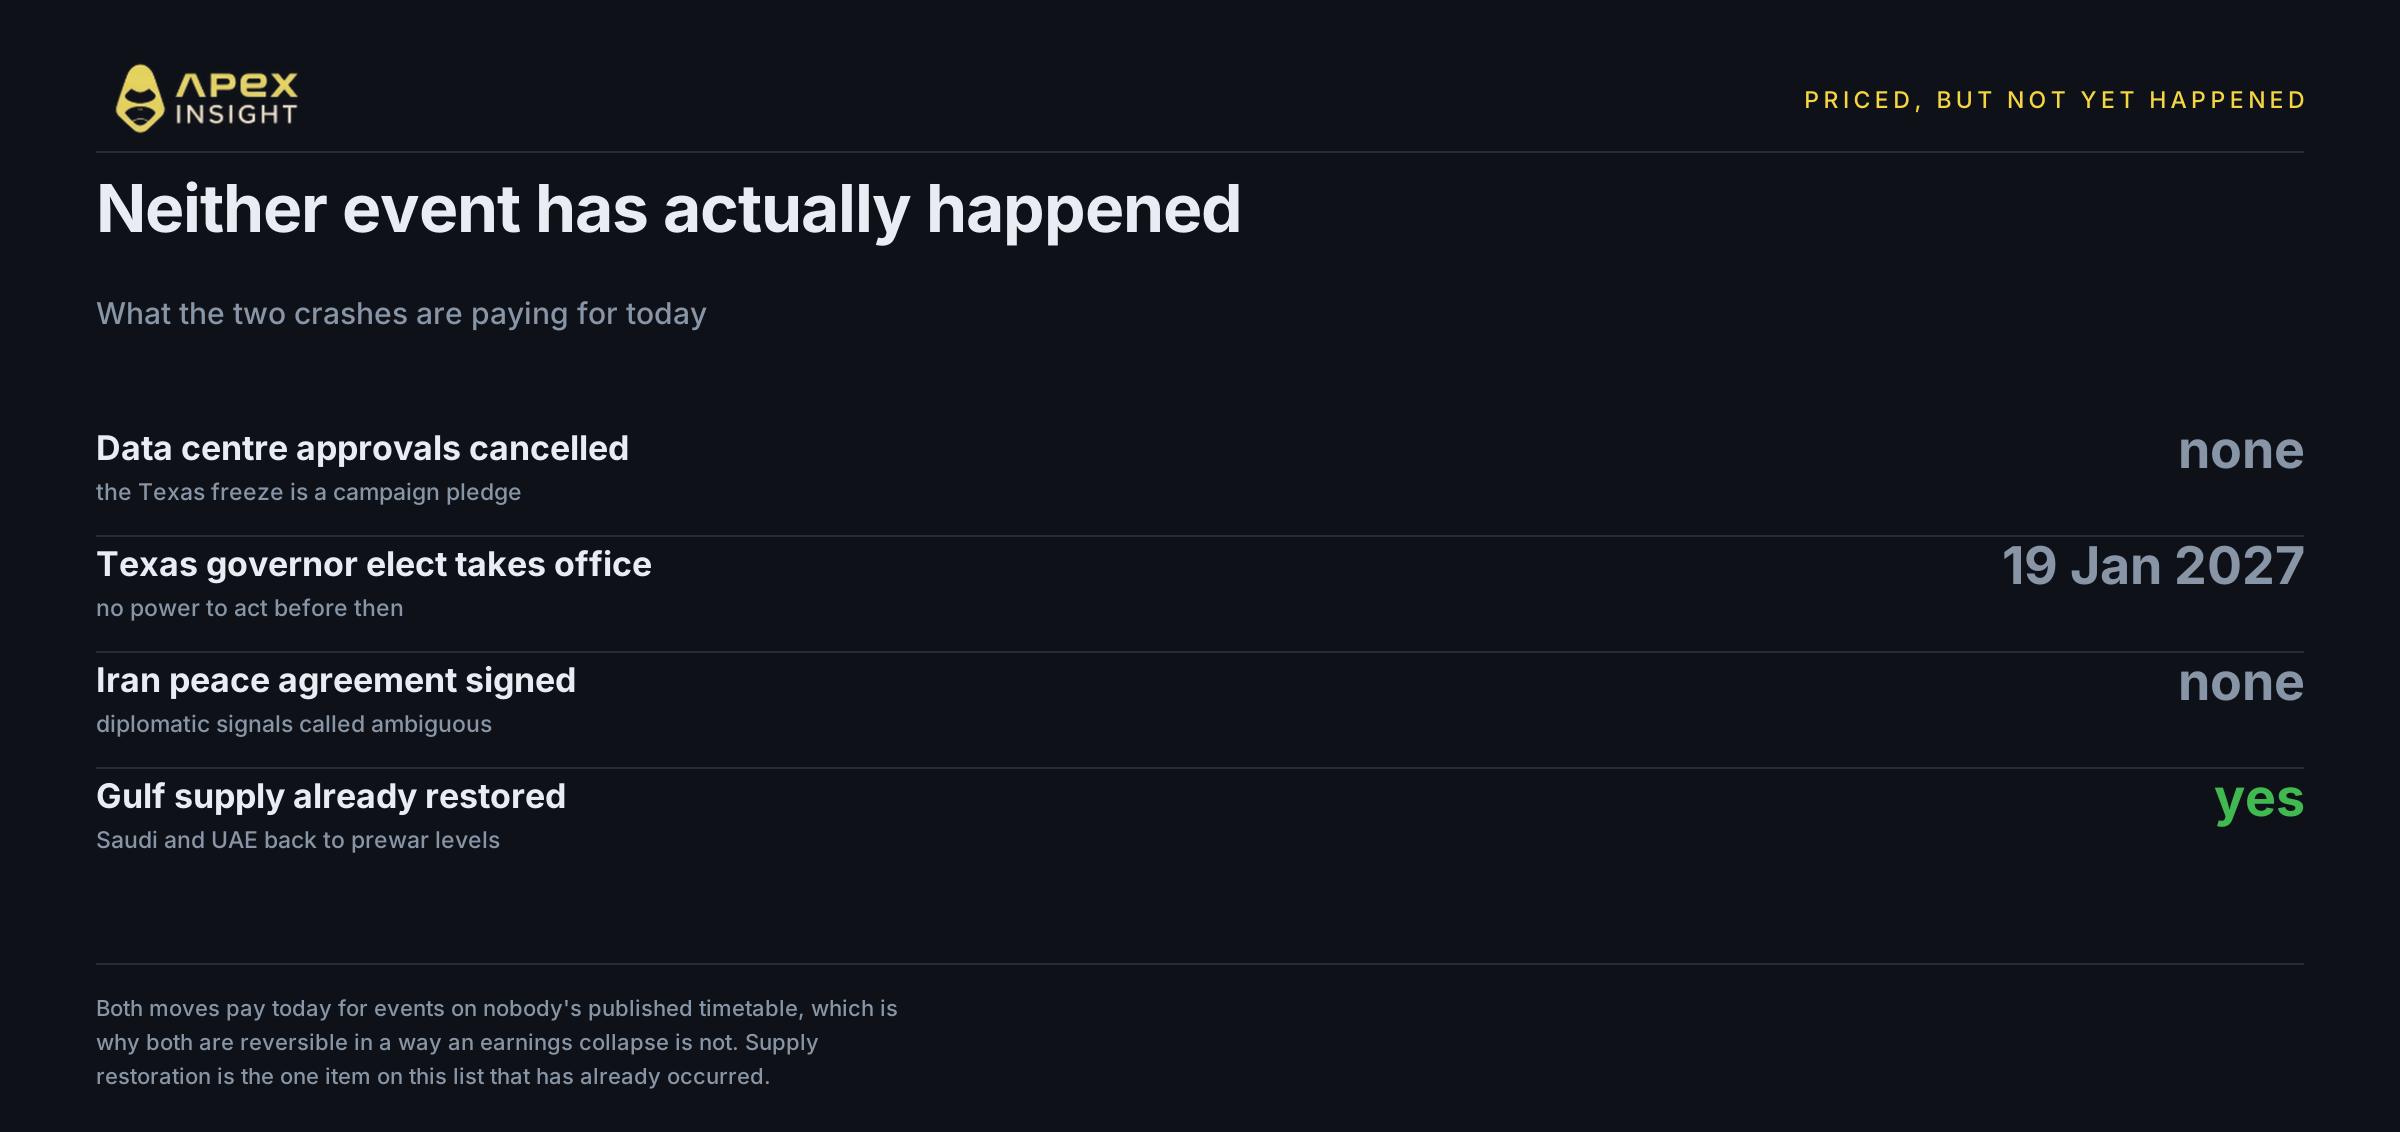
Here is what the two halves of the week do share.
Not one data centre approval has been cancelled. Not one peace agreement has been signed. The Texas governor-elect who promised to freeze data centre approvals does not take office until January. The Iran diplomacy is, in Nationwide's own word, ambiguous.
Both crashes are markets paying today for events that may or may not occur, on a timetable nobody has published. That is an ordinary thing for markets to do and it is the reason both moves are reversible in a way that an earnings collapse is not. Friday's equity rebound, with the Nasdaq up 1.09%, is the first small evidence of that. Crude did not join it, settling slightly lower on the day.
It also means the usual anchors are missing. There is no quarterly number that will confirm or deny either thesis. The next real information is political, not financial, and it arrives on its own schedule.
Trade oil perpetuals
Go long or short WTI crude around the clock, with the same account you trade stocks and crypto from.
The energy complex. The peace trade, in three expressions.
The one that went the other way. North American gas, largely untouched by Middle East supply.
The metals. Both higher on the week, after three losing weeks for gold and four for silver.
The other crash. The AI capex trade, covered in Thursday's and Friday's pieces.
The ones that sat it out.
Every ApeX price in this piece is a perpetual contract price. TradFi contracts settle against an index rather than the underlying asset, and ApeX lists them separately from its crypto perpetuals in its own contract data.
Trading perpetual futures carries a high risk of loss and leverage magnifies losses as fast as gains. Nothing here is financial advice.
If you need any help, feel free to reach out to our team on Discord.
Website: https://www.apex.exchange
Twitter: https://twitter.com/OfficialApeXdex
Telegram: https://t.me/ApeXdex
Methodology: all contract moves are computed from ApeX klines. Hourly bars are start-stamped, so the price at hour H is the close of the bar stamped H minus one. The week runs from the 30 October US cash close to the 6 November US cash close. The US close was 20:00 UTC on 30 October and became 21:00 UTC when daylight saving ended on 1 November, so the two ends of the window use different clock times. One deliberate deviation from our usual convention: house practice measures continuously traded markets such as crude, gold, silver, natural gas, Bitcoin and Ether on the calendar day, but this piece compares them directly against equity contracts, so every asset is measured over the same US-close to US-close window instead. Calendar day figures for those contracts would differ slightly. US markets are closed for the weekend and no Saturday or Sunday price is used anywhere, because weekend prints in these contracts are thin and reflect positioning rather than the underlying. Sector and index percentages, oil settlement prices, and all quotations are from the linked sources and are not ApeX data. Contract moves are our own arithmetic. Figures as at the 6 November 2026 US cash close, 21:00 UTC.