




Published on 28 October 2026, ahead of the 2pm New York decision.
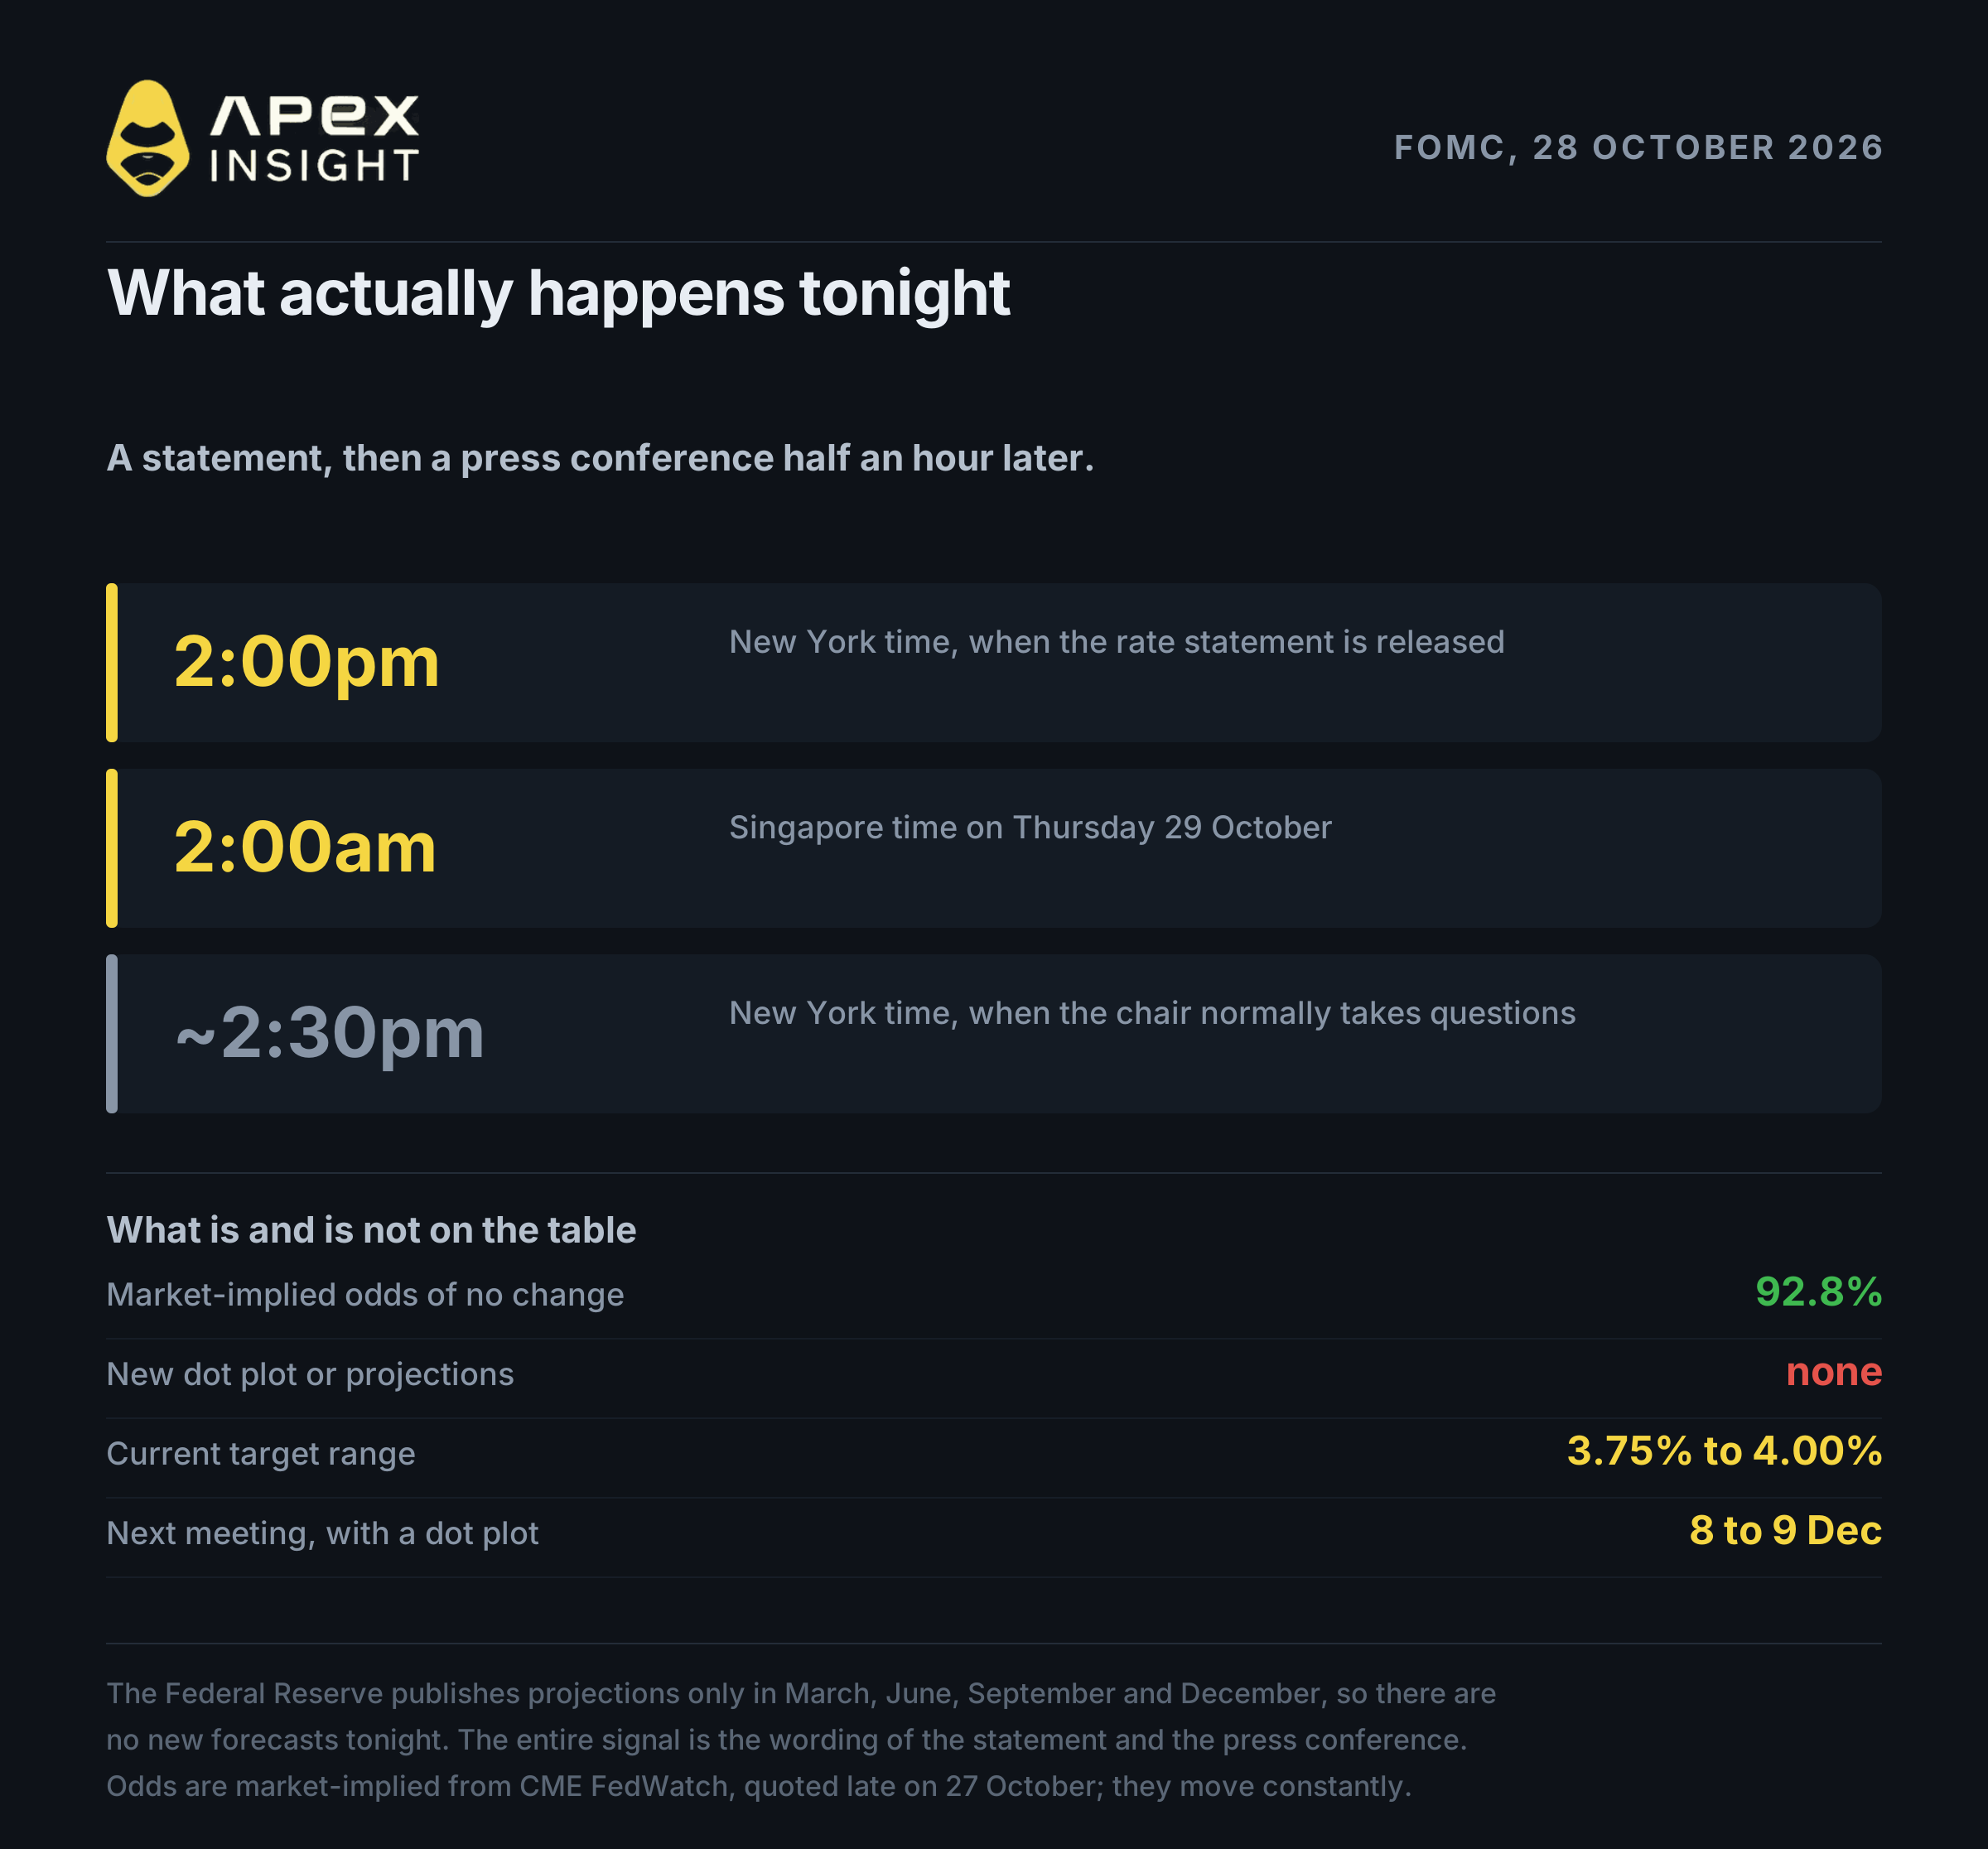
The Federal Reserve announces its interest rate decision at 2pm New York time on 28 October, which is 18:00 UTC.
Almost nobody expects the rate to change. CME FedWatch priced a hold at 92.8% late on 27 October. In rates terms that is as close to settled as these things get.
So the decision is not the story. The story is what the Federal Reserve says about December, and what that does to an asset that has already fallen more than a quarter from its January record while wars broke out around it.
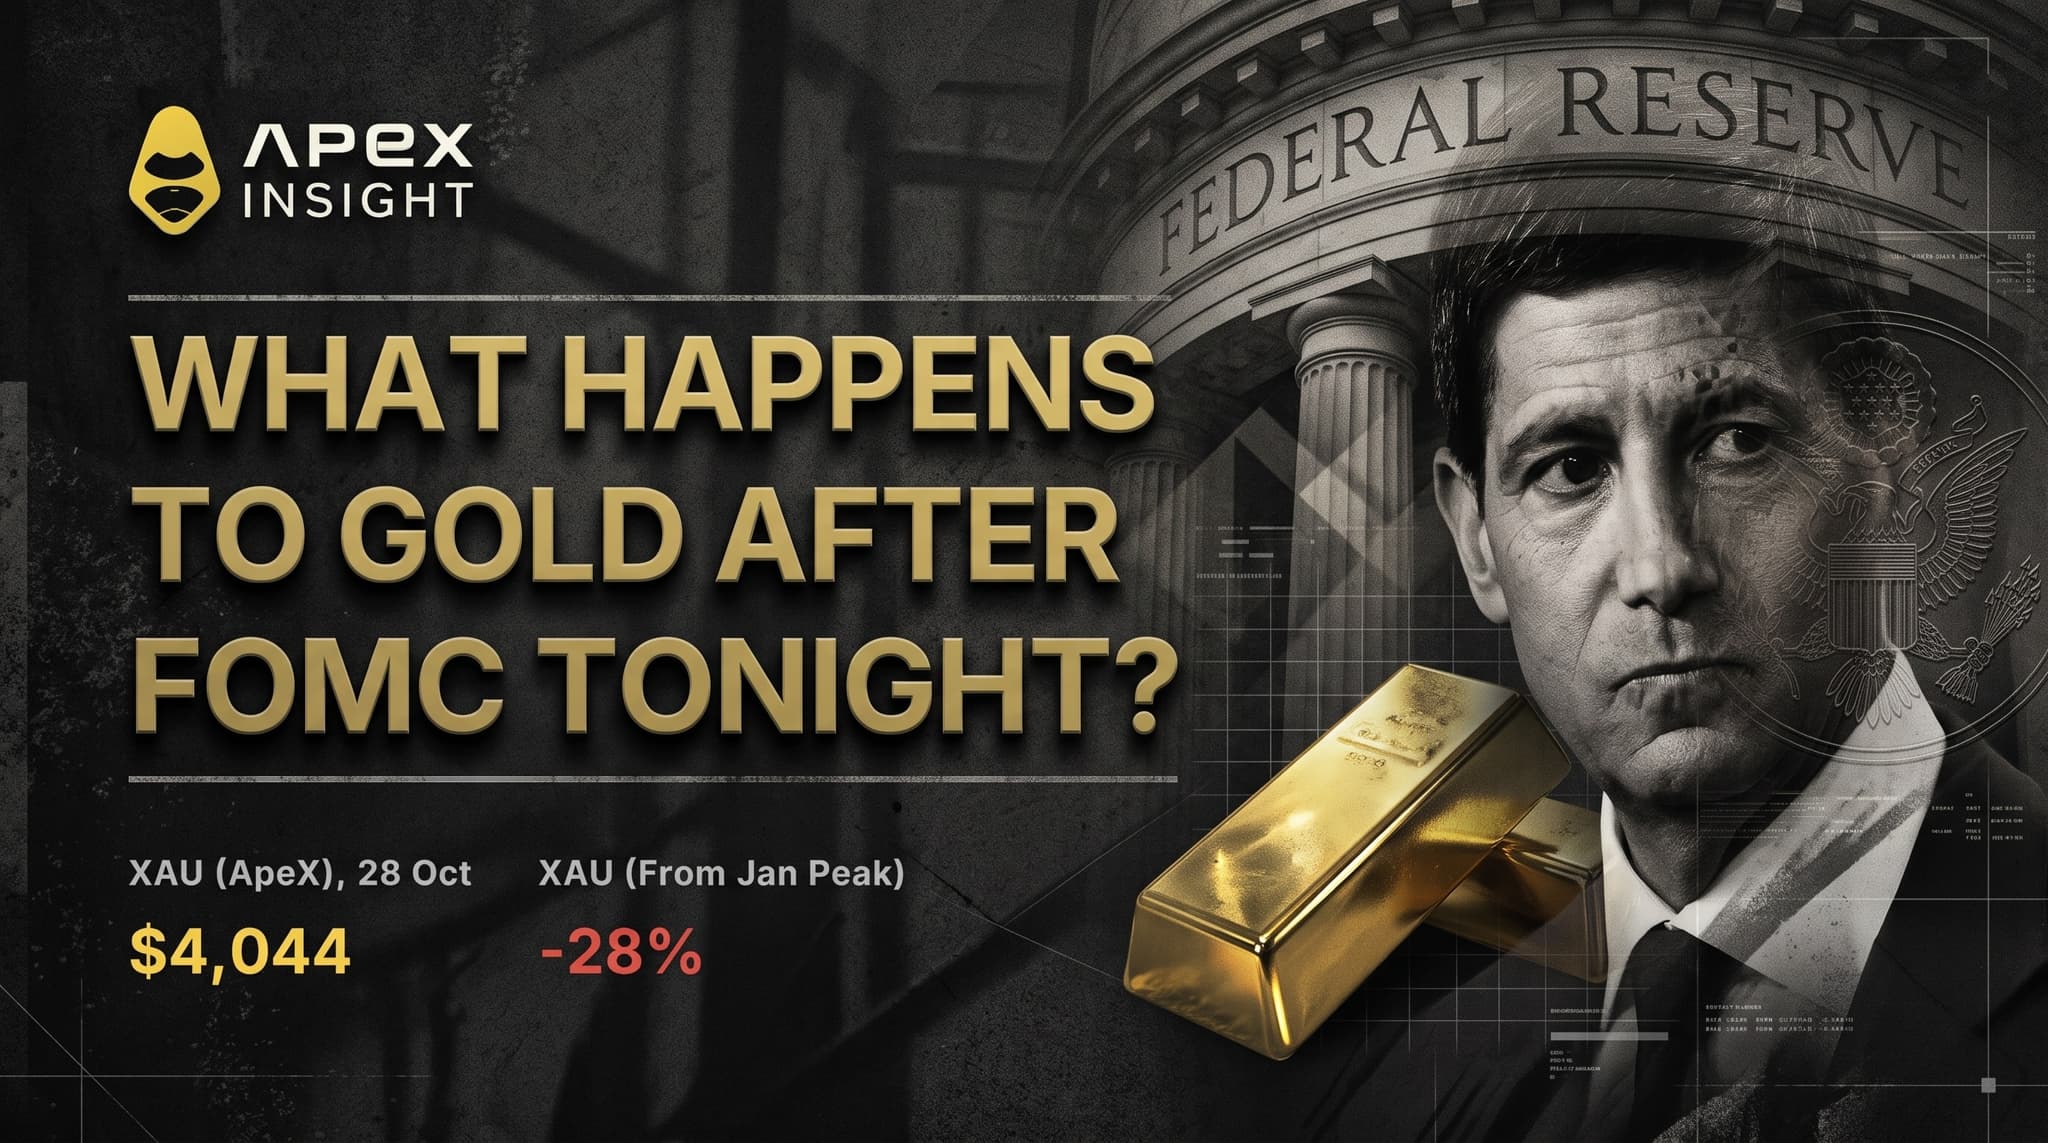
Gold traded near $4,044 on 28 October. On 28 January it printed $5,590. Nine months and roughly 28% separate those two numbers, and the most coherent explanation for the gap runs through the Federal Reserve.
Here are six things worth knowing before the announcement.
1. What actually happens tonight
The mechanics first, because half the confusion around Fed days comes from people watching the wrong thing at the wrong time.
The statement lands at 2pm Eastern time, which is 18:00 UTC. The press conference normally follows half an hour later, at 18:30 UTC.
Two details matter more than usual tonight.
The first is that there is no dot plot. The Federal Reserve publishes its Summary of Economic Projections, the chart of where each official thinks rates are heading, only four times a year: March, June, September and December. October is not one of them. So there will be no new forecasts tonight, no updated terminal rate, nothing numerical to argue about. The entire signal is in the wording of the statement and in what the chair says afterwards.
The second is that this is a two-day meeting that began yesterday, on 27 October, and the committee has been sitting on September inflation data the whole time.
If you are trading the event rather than reading about it afterwards, the practical point is that the statement and the press conference are separate events roughly thirty minutes apart, and they frequently move prices in opposite directions.
2. Tonight is not the meeting that matters
This is the part most previews bury, and it is worth understanding before the announcement.
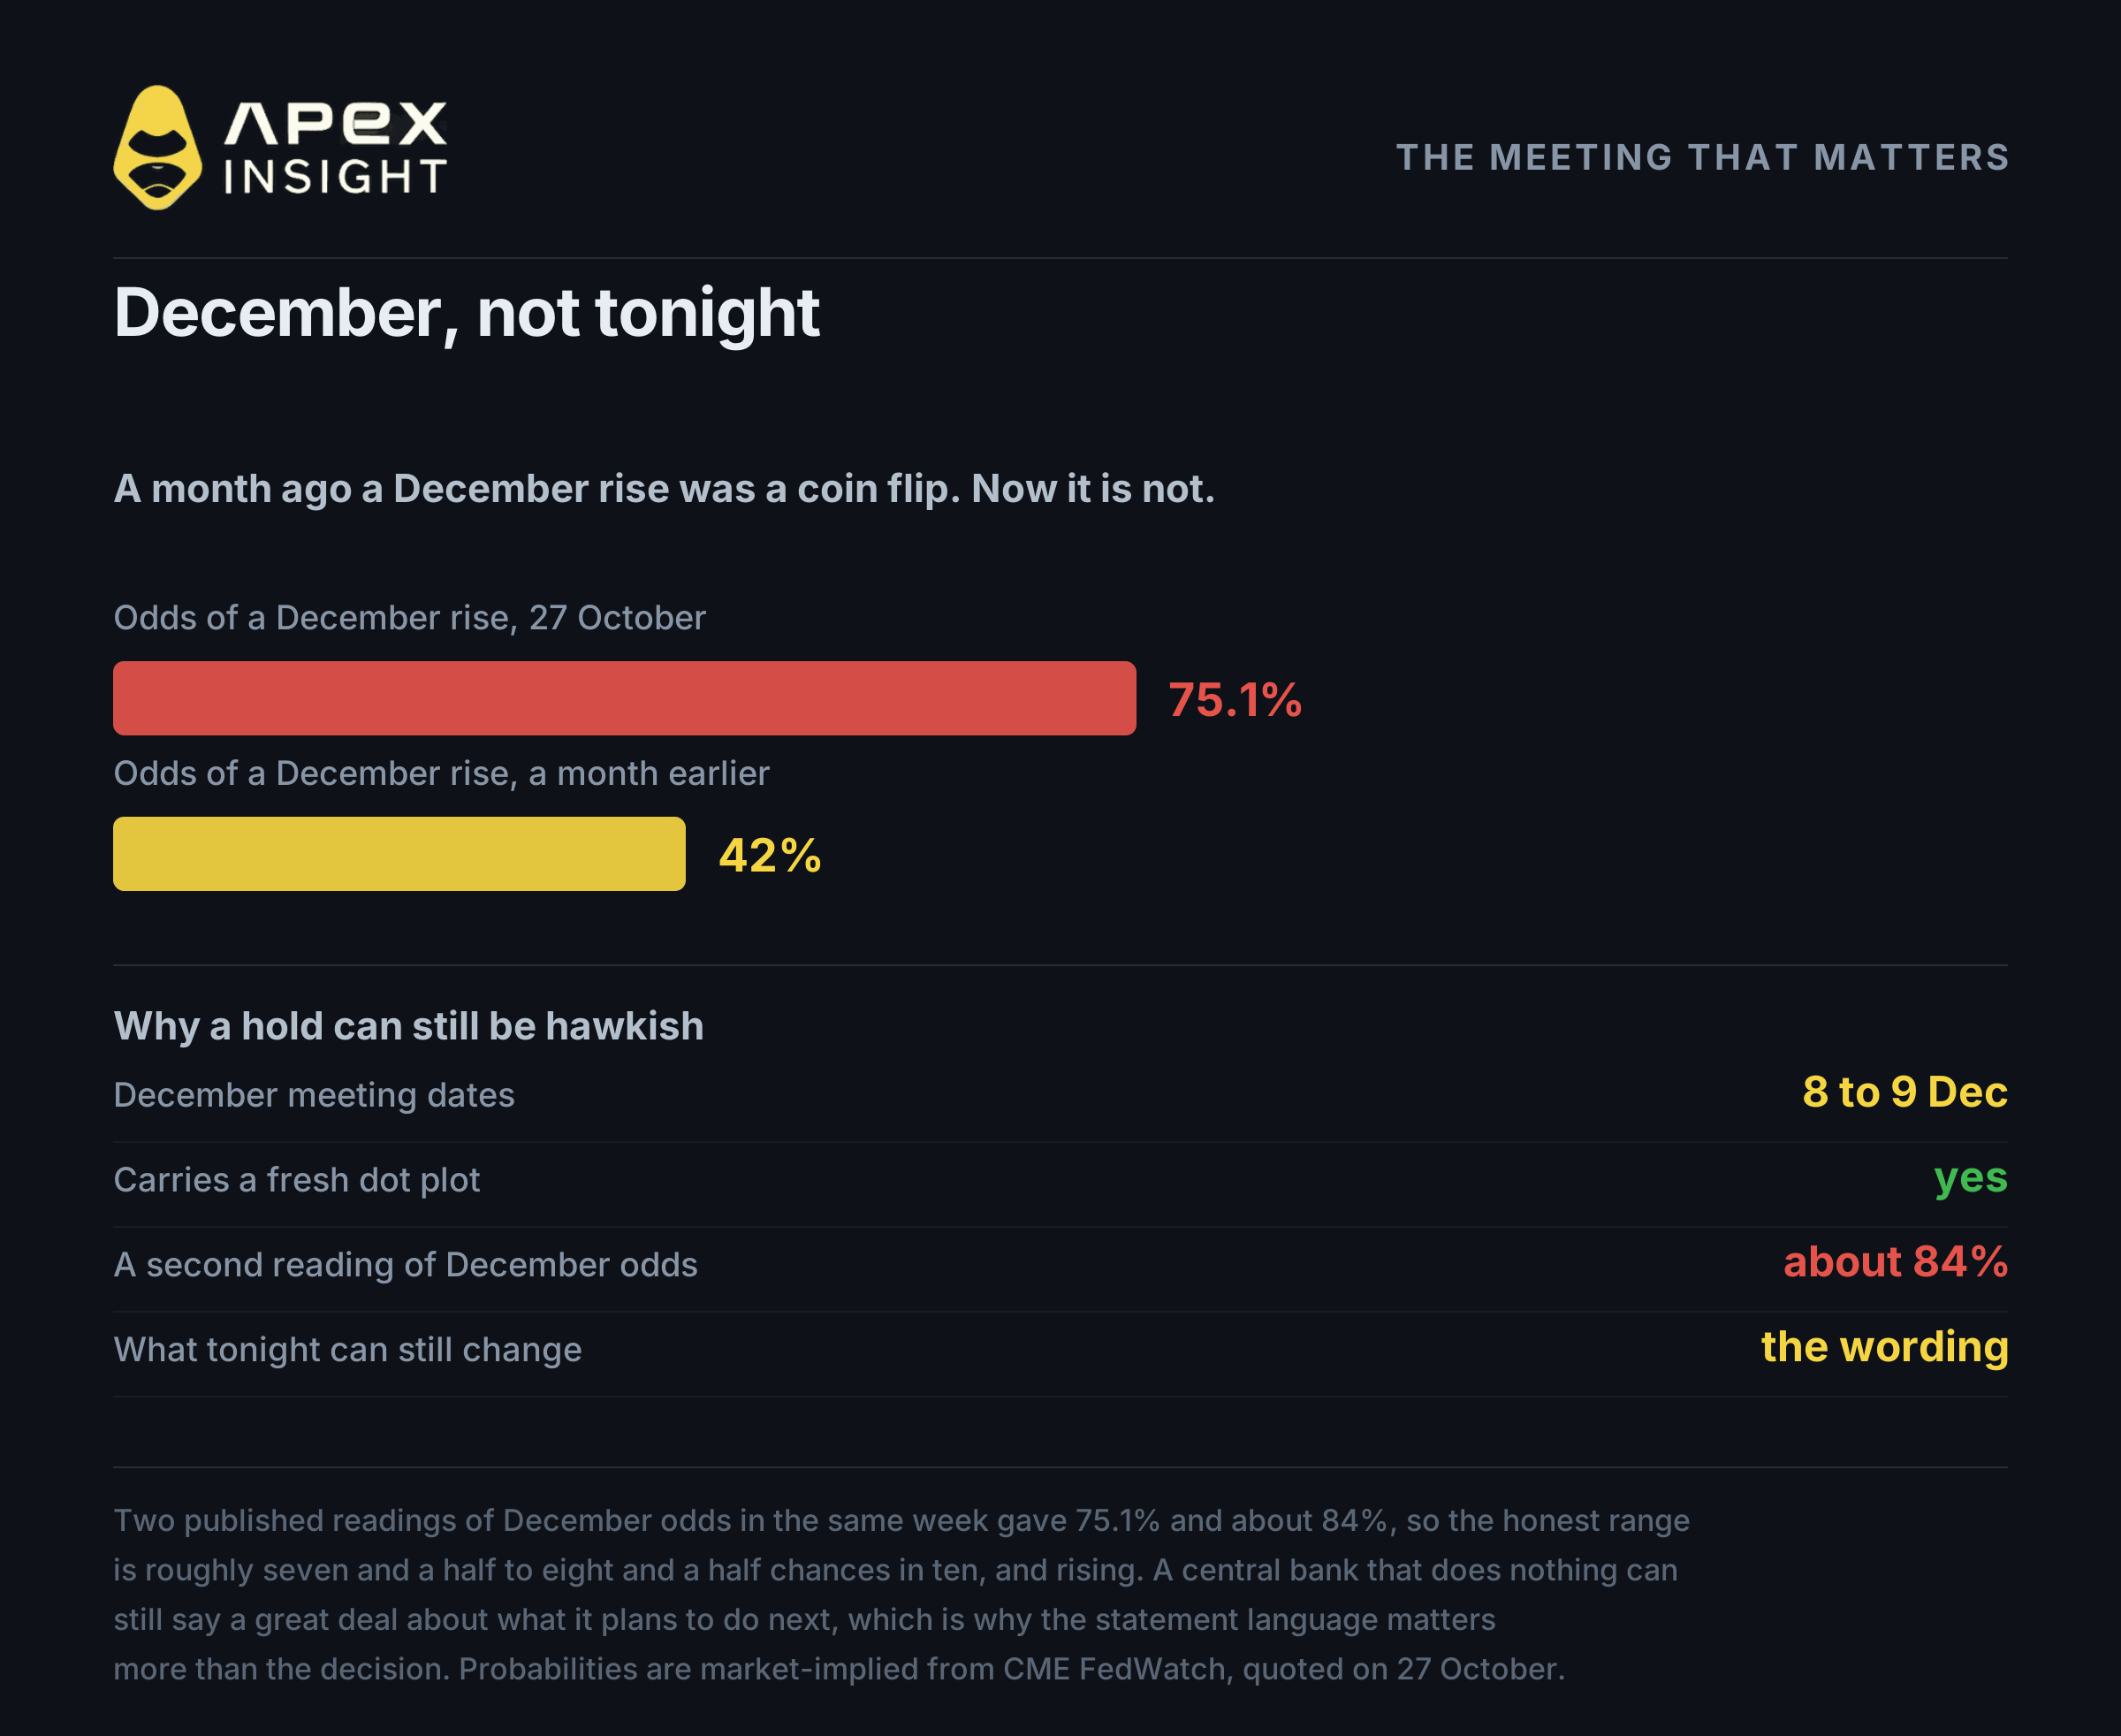
The next meeting is 8 and 9 December, and it carries everything tonight lacks: a fresh dot plot, updated projections, and a live question about whether rates go up again. CME FedWatch put the odds of a December increase at 75.1% on 27 October, up from roughly 42% a month earlier. A second reading that week put it nearer 84%. Call it somewhere between seven and a half and eight and a half chances in ten, and note that it has been rising fast.
That repricing, rather than tonight's decision, is the most coherent explanation for what has been moving gold.
It also explains why a hold can still be hawkish. If the statement drops language about patience, or hardens its description of inflation, the market will read it as a December pre-commitment and price accordingly. A central bank that does nothing can still tell you a great deal about what it plans to do next.
So the question to carry into the announcement is not "will they move". It is "does this make December more likely or less".
3. The three words that explain the whole year
To understand why December is live at all, you have to go back to May, and then to September.
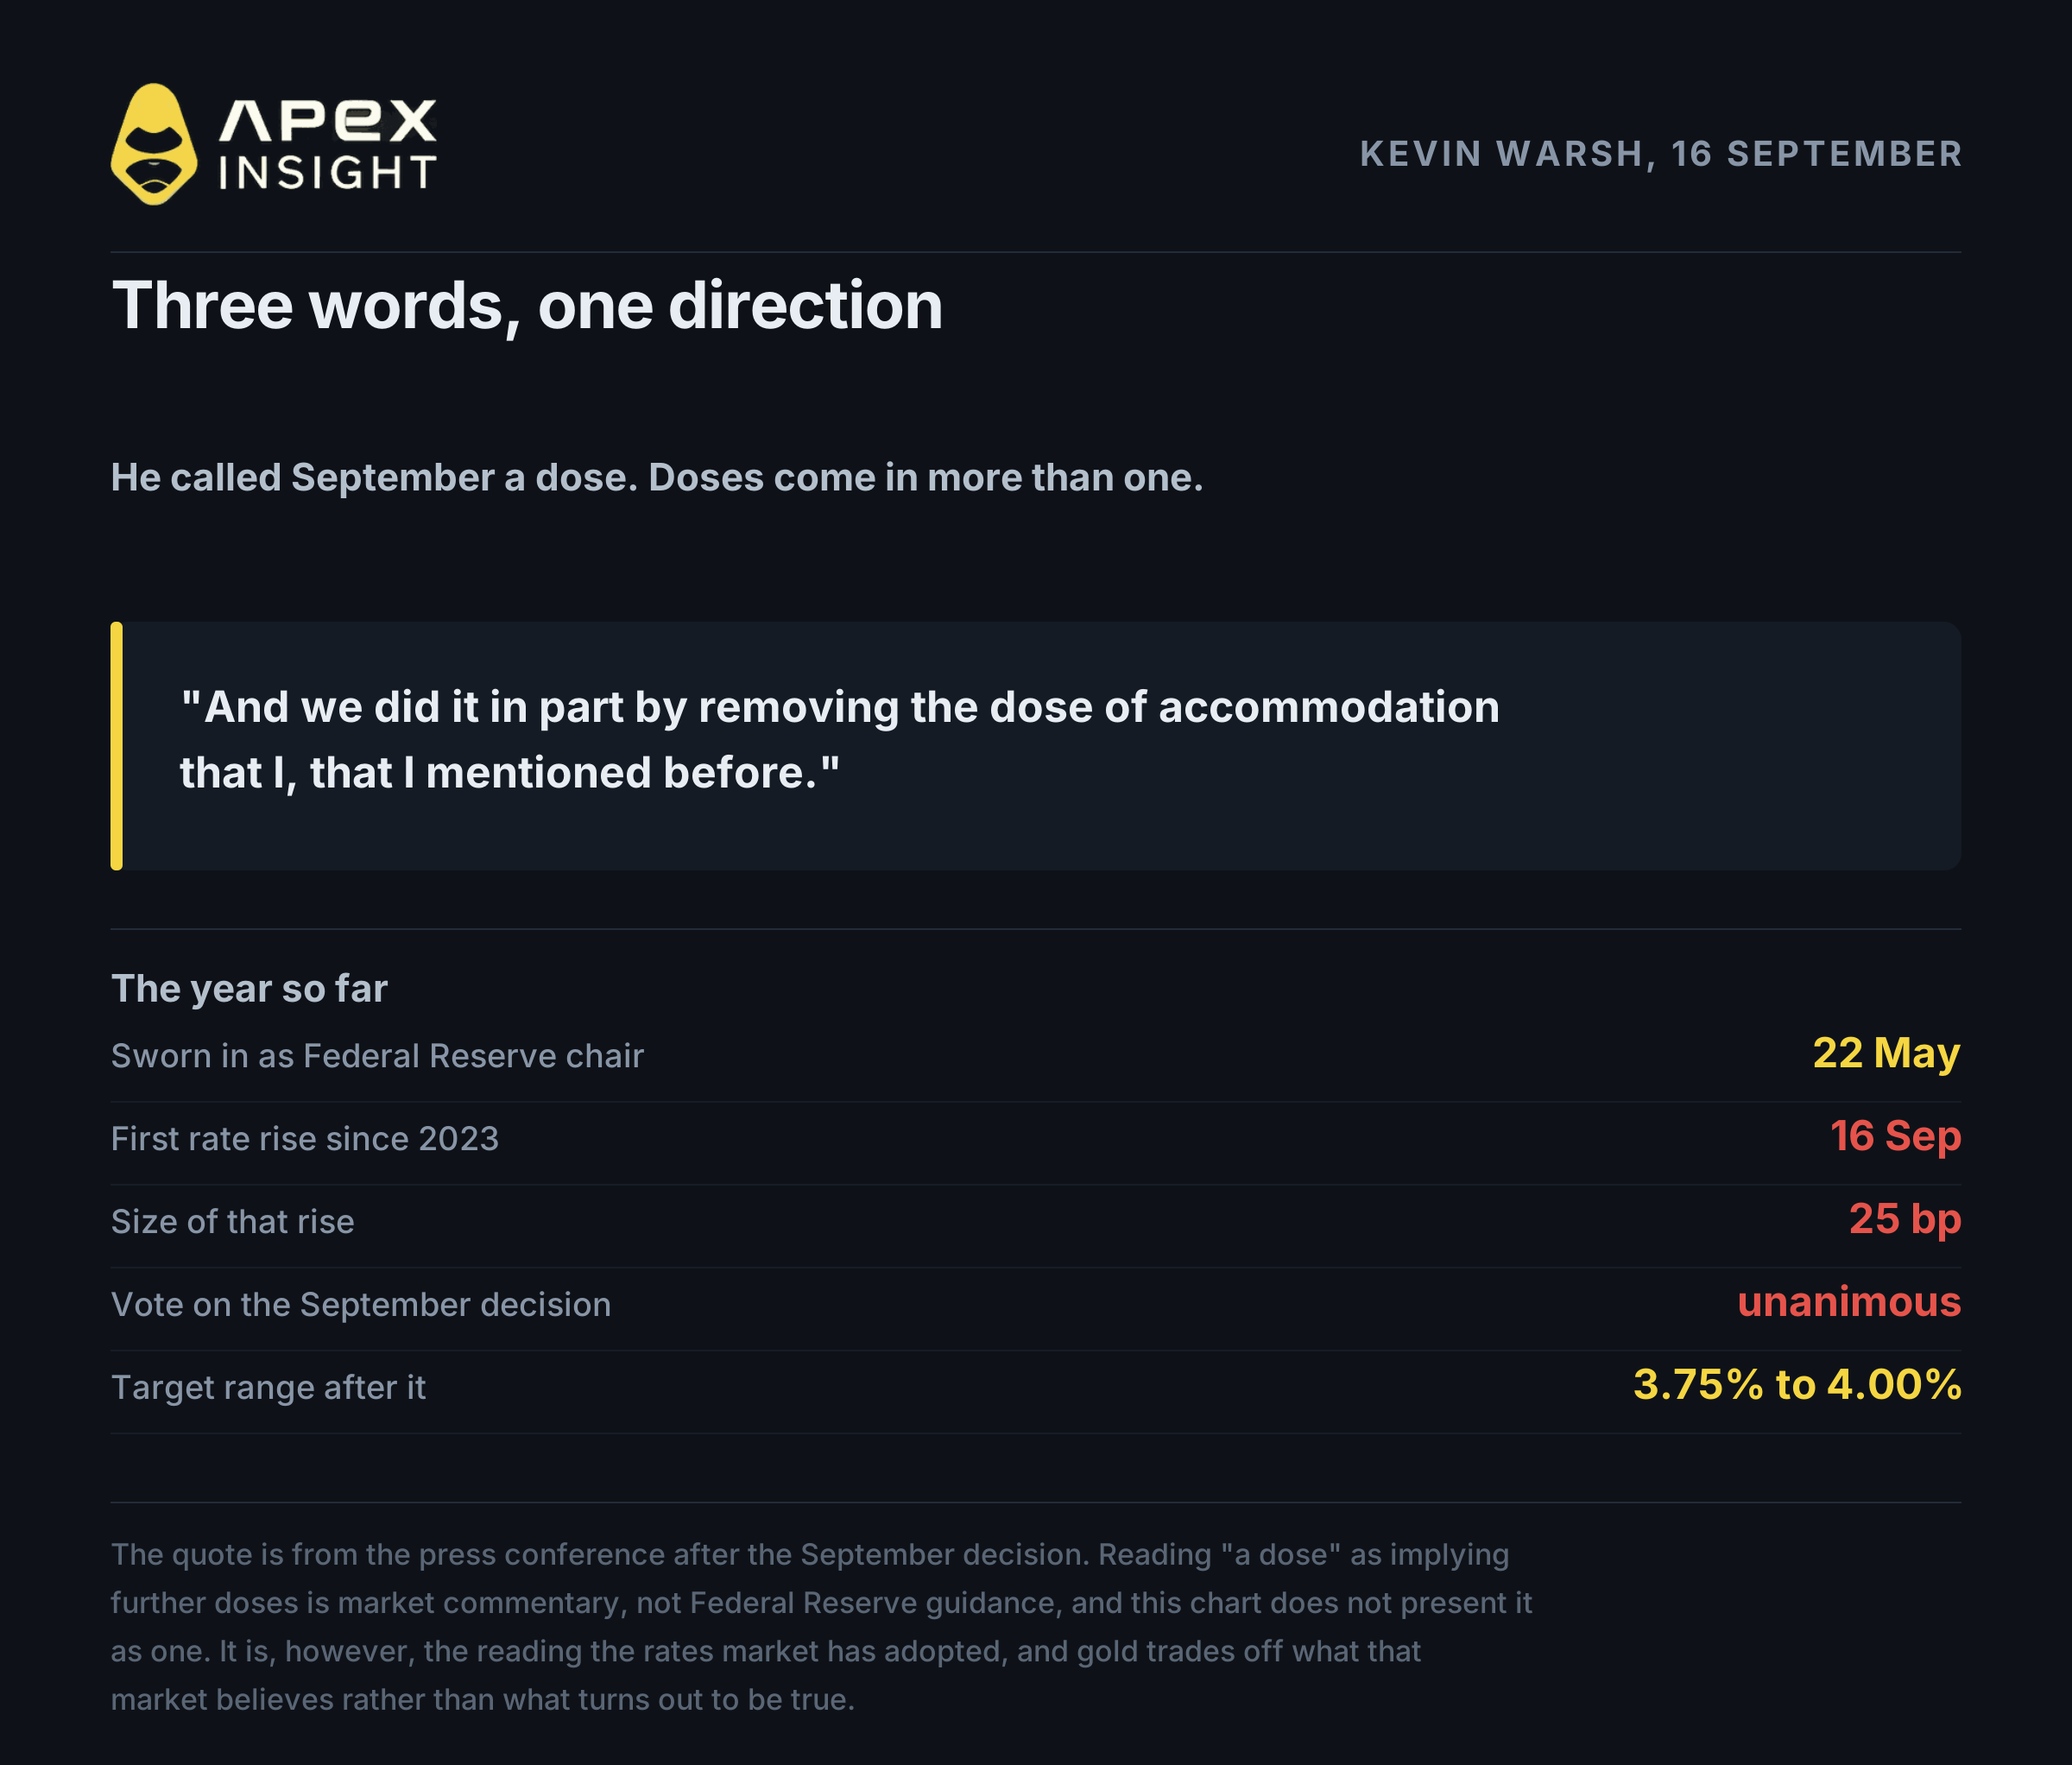
Kevin Warsh was sworn in as chair of the Federal Reserve on 22 May, replacing Jerome Powell. He arrived with a reputation as a hawk and has not spent it carefully.
On 16 September his committee raised rates by 25 basis points to 3.75% to 4.00%, the first increase since 2023, and it did so unanimously. Warsh told reporters that the Federal Reserve had taken "an important step" toward price stability, and then said this:
"And we did it in part by removing the dose of accommodation that I -- that I mentioned before."
Dose of accommodation. Those are the three words, and Wall Street has been chewing on them ever since, for an obvious reason. You do not describe a single move as a dose unless there are more doses available. The word implies policy is not yet where he wants it, and that September was an instalment rather than a conclusion.
That is an interpretation, not a Fed forecast, and it is worth holding loosely. But it is the interpretation the rates market has adopted, and gold trades off what the rates market believes rather than what is ultimately true.
4. Why gold fell while the Middle East escalated
Here is the part that looks wrong and is not, once you follow the sequence.
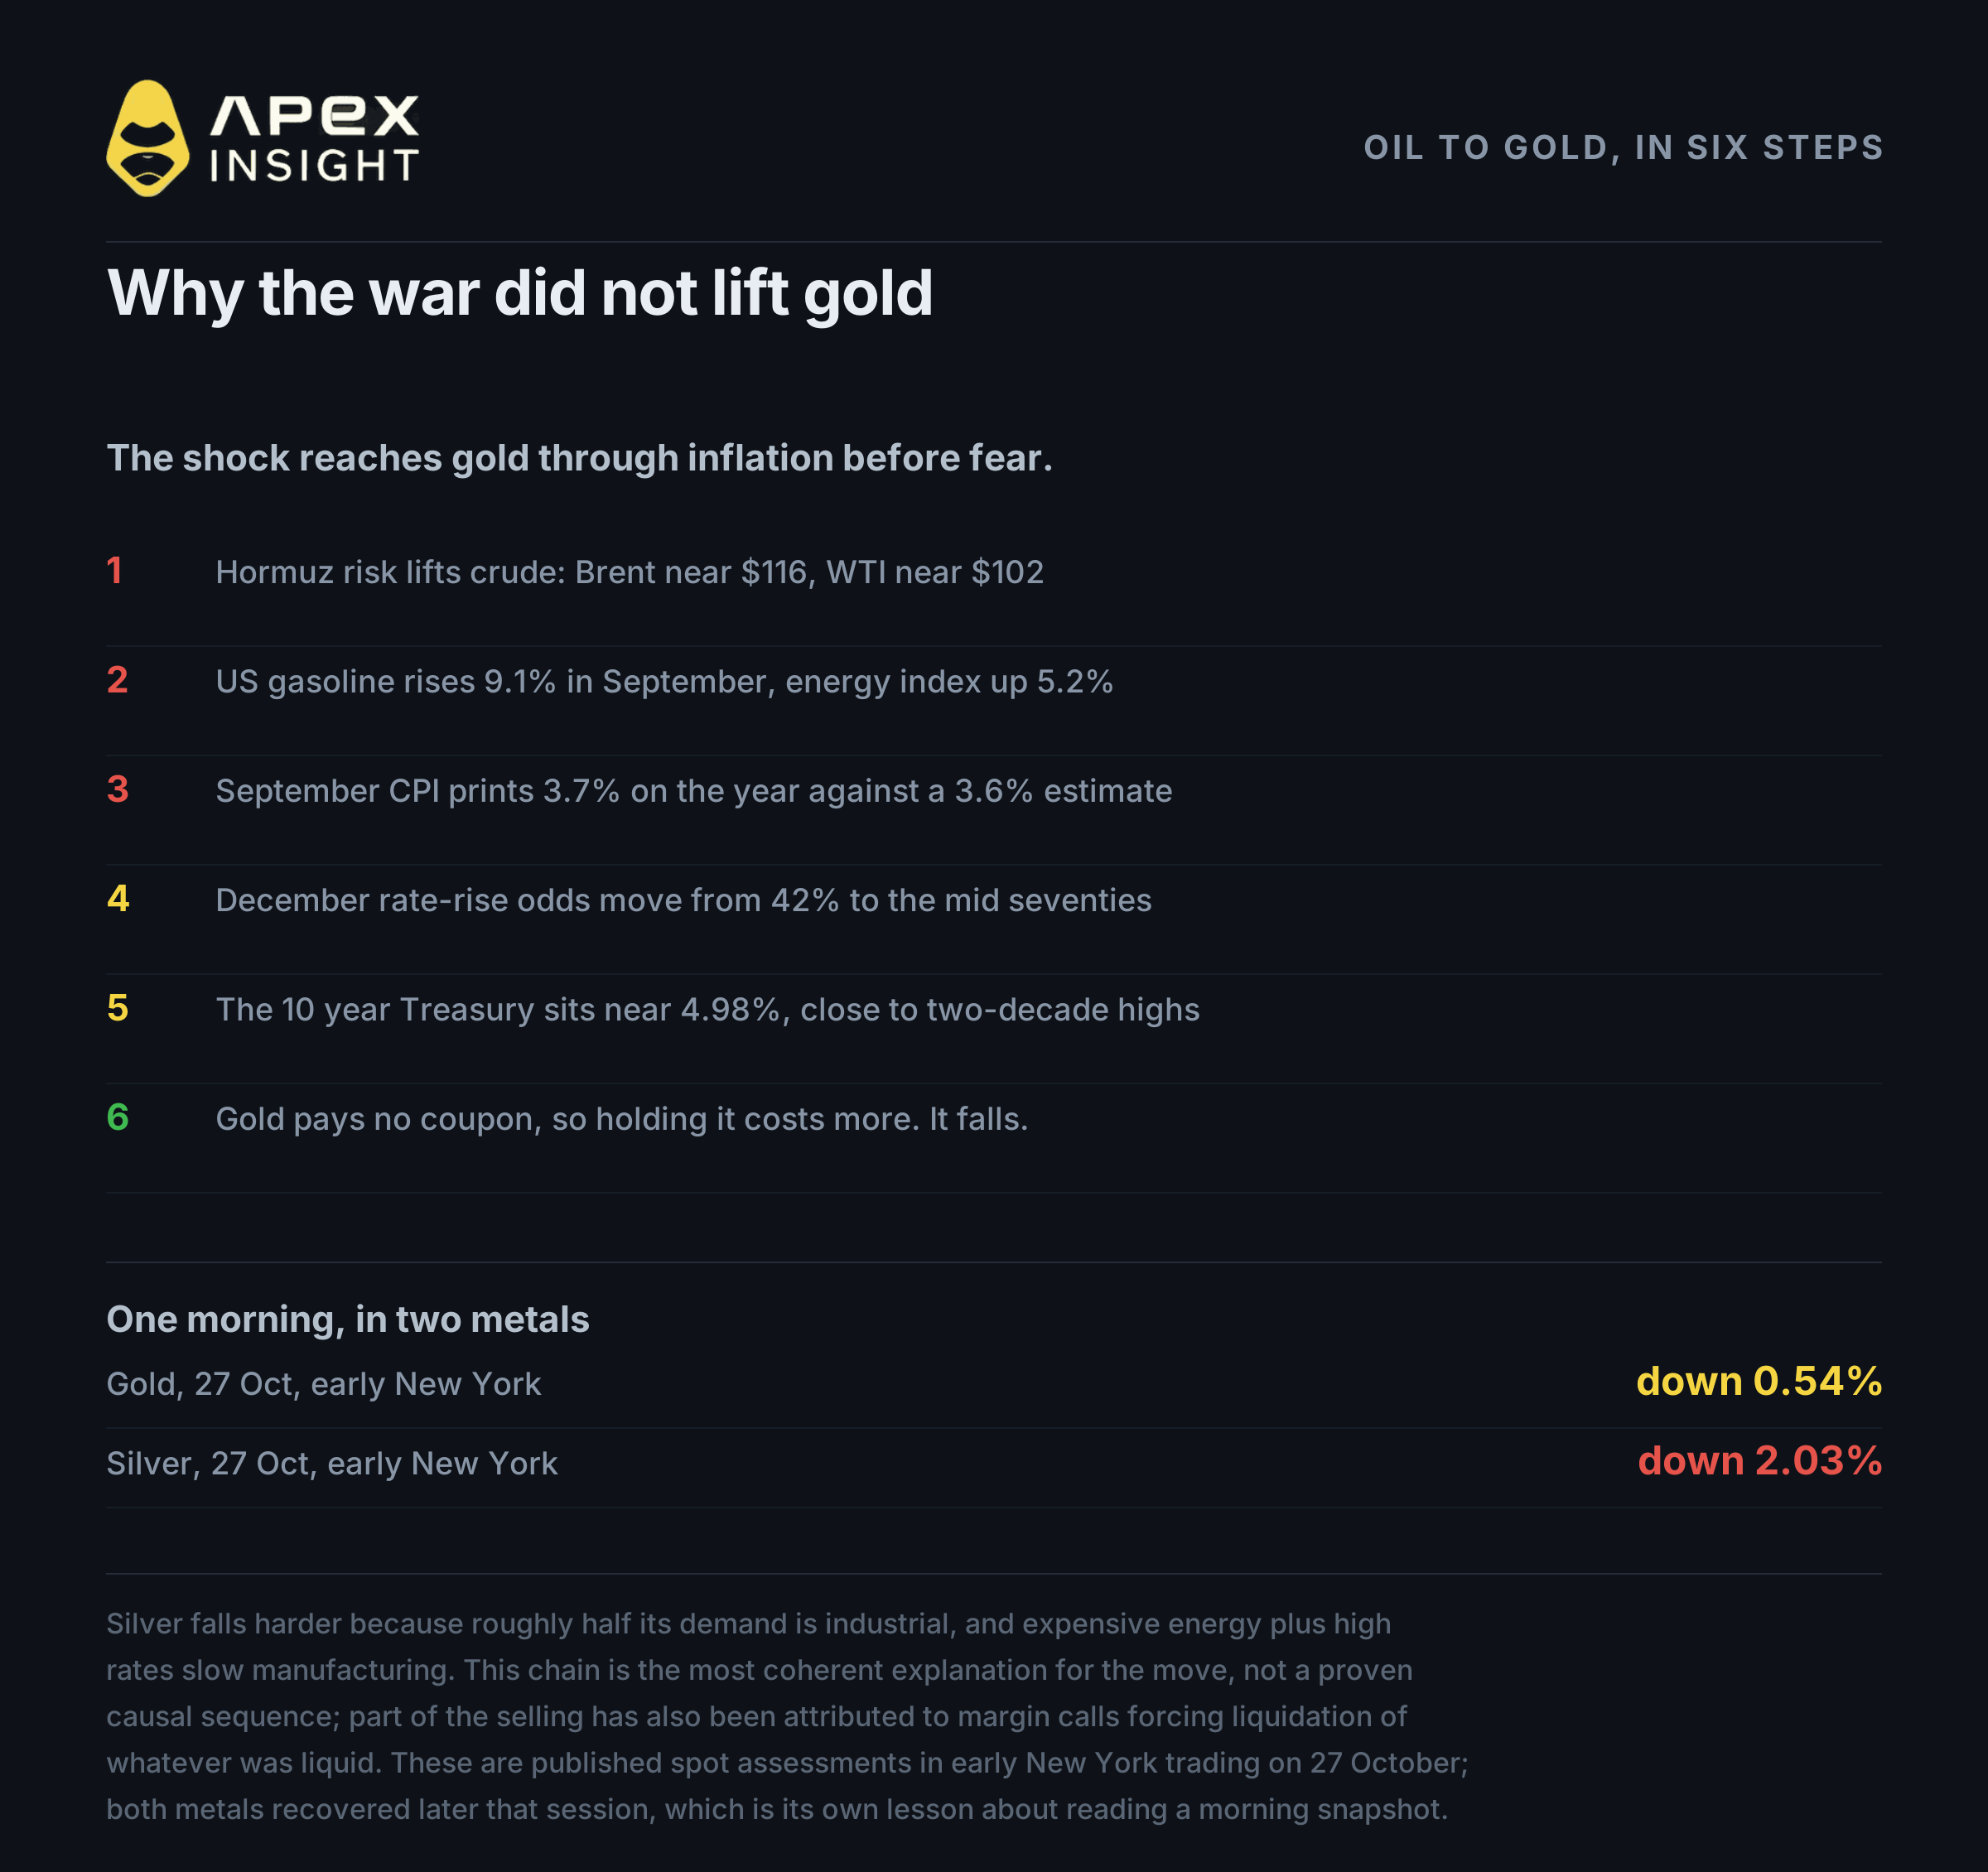
The Strait of Hormuz has been the most closely watched shipping lane in the world for months, and the past fortnight has been among the tensest stretches. Houthi attacks on Saudi targets have continued, shipping has been threatened, and Brent traded near $116.24 with WTI near $102.07 on 27 October. Saudi, Turkish and Pakistani officials met Iranian counterparts in Tehran on 26 October, and no settlement has been announced.
This is the textbook environment for gold to rise. Gold fell.
The chain that explains it runs through the oil price rather than around it:
Oil rises. Hormuz risk lifts crude.
Headline inflation follows. US gasoline prices rose 9.1% in September and the energy index rose 5.2%, after 2.1% in August.
The inflation print lands hot. September CPI, released on 14 October, rose 0.6% on the month and 3.7% on the year, against a 3.6% estimate. Core rose to 2.6% from 2.4%. Producer prices rose 1.3% on the month and 6.3% on the year.
Rate expectations harden. December hike odds move from 42% to the mid seventies in a month.
Yields rise. The 10-year Treasury sat near 4.98% on 27 October, with yields around their highest in about two decades.
Gold pays nothing. Every rise in yields raises the cost of holding an asset with no coupon, and supports the dollar it is priced in.
So a geopolitical shock that would once have been unambiguously good for gold now arrives carrying its own antidote. The war premium is real, but it reaches gold second, after the inflation and interest rate channel has already hit it.
Silver has had the worse version of the same week, because it is half industrial metal. In early New York trading on 27 October, with Hormuz in the headlines, silver was down about 2.0% against gold's 0.54%, on worries that expensive energy and high rates slow manufacturing demand. Both metals recovered later that session, which is its own lesson about reading a morning snapshot as a verdict.
One further mechanical note, offered because it is unglamorous and frequently the real answer. Part of the metals selling has been attributed to forced liquidation: investors facing margin calls on equity positions sell what they can, and liquid gold and silver positions are what they can sell. Not every move has a macro explanation.
5. What gold has actually done, on the tape
Narrative is cheap. Here is the arithmetic, measured on the ApeX gold contract so the numbers match what a trader could actually have transacted.
Measure | Level |
|---|---|
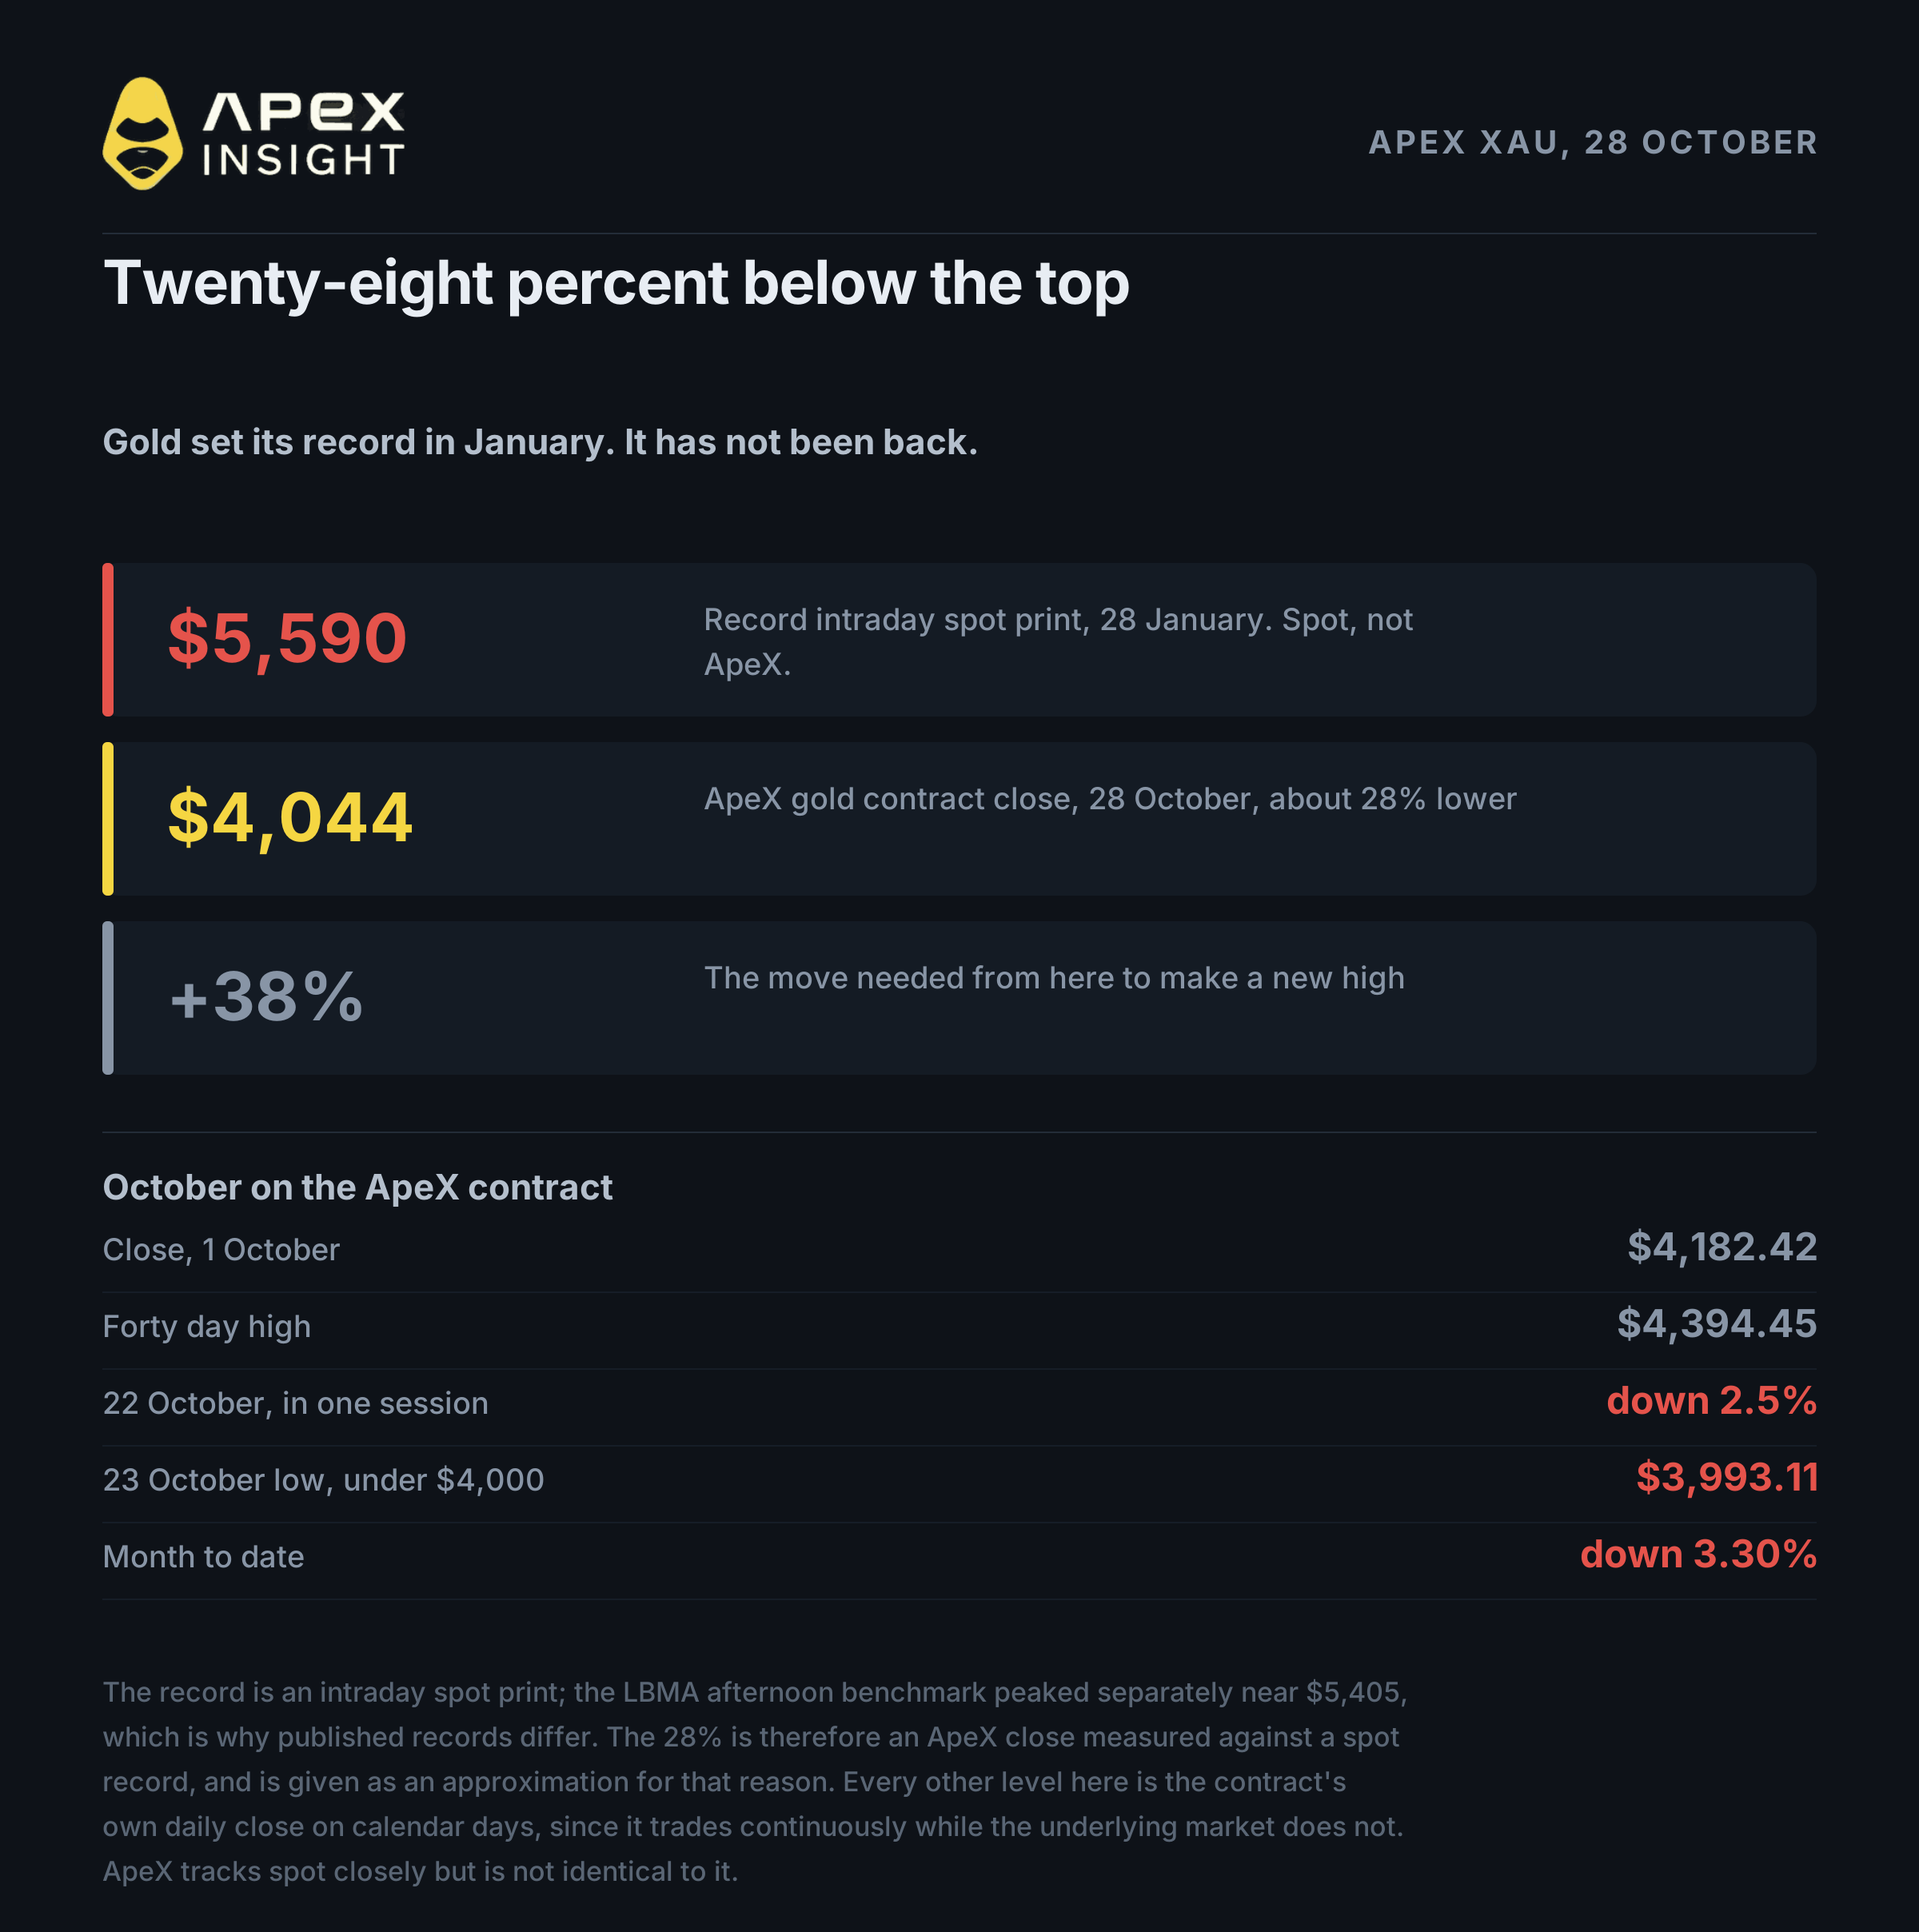
Record spot print, 28 January (spot, not ApeX) | about $5,590 |
ApeX XAU close, 28 October | $4,044.30 |
Below the record | about 28% |
ApeX 40 day high | $4,394.45 |
Below that high | 7.97% |
Close, 1 October | $4,182.42 |
Month to date | 3.30% lower |
The damage was concentrated in two sessions. On 22 October the contract fell from $4,136.04 to $4,033.36, about 2.5% in a day. On 23 October it traded as low as $3,993.11, losing the $4,000 handle for the first time in the period covered here, and spot printed an intraday low of $3,975.23 the same day.
Since then it has stabilised rather than recovered: $3,997.95 on 24 October, $4,007.48 on 25 October, $4,017.84 on 26 October, $4,071.89 on 27 October and $4,044.30 on 28 October.
Two things are worth drawing from that. The first is that gold has spent the past week trading around $4,000 rather than continuing to fall, which is a different market from the one that broke on 22 October. The second is that a 28% drawdown from a record is a bear market by any normal definition, and it has happened during a period most people would describe as frightening. The asset is not behaving the way its reputation says it should.
For scale: from $4,044, gold would need to rise about 38% to make a new high.

6. What to watch tonight, and what each outcome does
No forecast here, because anyone selling you a confident gold price for Friday is guessing. What follows is the decision tree the market will actually trade.
A hold with softened language. The statement acknowledges cooling somewhere, or the chair sounds less committed to further tightening. December odds fall, yields fall, the dollar softens. This is the outcome gold wants.
A hold with hardened language. The statement sharpens its description of inflation, or the chair repeats the language of removing accommodation. December gets priced closer to certain. Yields rise, and gold would be expected to retest the $4,000 area it lost and recovered on 23 and 24 October.
A surprise increase tonight. Priced at about 7% on CME FedWatch, roughly one chance in fourteen, though at least one strategist reading the same tool puts it nearer 10%. It would be the most disruptive outcome on the board, and the one least reflected in current pricing.
Three further things to keep on the screen.
Thursday's inflation data. The Federal Reserve's preferred measure, PCE, is due on 29 October, the day after the decision. A hot print does more damage to gold than anything said tonight, because it feeds December directly.
The oil price. Section four is a chain, and oil is the first link. If Hormuz de-escalates and crude falls, headline inflation cools, December odds fall and the pressure on gold lifts. The gold trade this quarter is partly an oil trade wearing a disguise.
Where the forecasters sit. For what professional estimates are worth, a Reuters poll on 27 October put the median 2027 gold price at $4,650, up from $4,610 a month earlier. Metals Focus has modelled an average nearer $5,330 and UBS has pointed to roughly $5,400 by September 2027, while Intesa Sanpaolo expects something closer to $4,200 for several quarters. That is an enormous spread, and the honest reading of it is that the professionals disagree violently about whether this is a pause in a bull market or the end of one.
Trade the markets in this article
Everything discussed here is tradeable on ApeX Omni as a TradFi perpetual, settled in USDT, up to 50x, long or short, with no KYC.
The contract at the centre of it:
XAUUSDT, gold
The metal with the same macro driver and more industrial sensitivity:
XAGUSDT, silver
And the first link in the chain from section four, if your view is really about the oil price:
TradFi contracts on ApeX settle against an index rather than the underlying asset, and ApeX lists them separately from its crypto perpetuals in its own contract data. Check promotion terms before trading one to qualify for a volume campaign.
Race to the Top 50 is live
ApeX is running a trading competition with a prize pool of up to 10,000 USDT, split across the Top 50 on the leaderboard.
Full rules, the campaign period, how points are scored and the complete prize table are in the Race to the Top 50 announcement.
Race to the Top 50 is live
Trade your way up the leaderboard. A prize pool of up to 10,000 USDT, split across the Top 50.
Trading perpetual contracts carries a high level of risk and can result in the loss of your entire position. Leverage increases both gains and losses. Central bank decisions move prices violently in both directions within seconds of release, and spreads widen around scheduled announcements. Nothing in this article is financial advice. Do your own research and never risk more than you can afford to lose.
If you need any help, feel free to reach out to our team on Discord.
Website: https://www.apex.exchange
Twitter: https://twitter.com/OfficialApeXdex
Telegram: https://t.me/ApeXdex
Prices in this article carry the dates given. The record gold figure of about $5,590 is an intraday spot print from 28 January 2026; the LBMA PM benchmark fix peaked separately near $5,405, which is why published records differ, and both are quoted here as what they are. The spot figures in this article are the $5,590 record print, the $3,975.23 intraday low on 23 October, the Brent and WTI levels, and the gold and silver percentage moves on 27 October. Every other gold level in section five is the ApeX contract's own daily close, and the two bases are labelled where they appear. The Brent and WTI levels quoted in section four are published front-month prices on 27 October; the ApeX BZ and CL contracts settle against their own indices and trade at different levels, BZ materially below front-month Brent, so the two should not be compared directly. Levels attributed to the ApeX gold contract are its own daily closes. The 28% figure measures an ApeX close against a spot record and is given as an approximation for that reason. ApeX tracks spot closely but is not identical to it. Daily figures for gold are calendar day closes, since the ApeX contract trades continuously while the underlying market does not. December rate probabilities are market-implied and were quoted on the dates given; they move constantly and will have changed by the time you read this. The interpretation of the chair's "dose of accommodation" remark is market commentary, not Federal Reserve guidance, and is labelled as such. The chain described in section four is the most coherent explanation available for gold's behaviour this month, not a proven causal sequence.