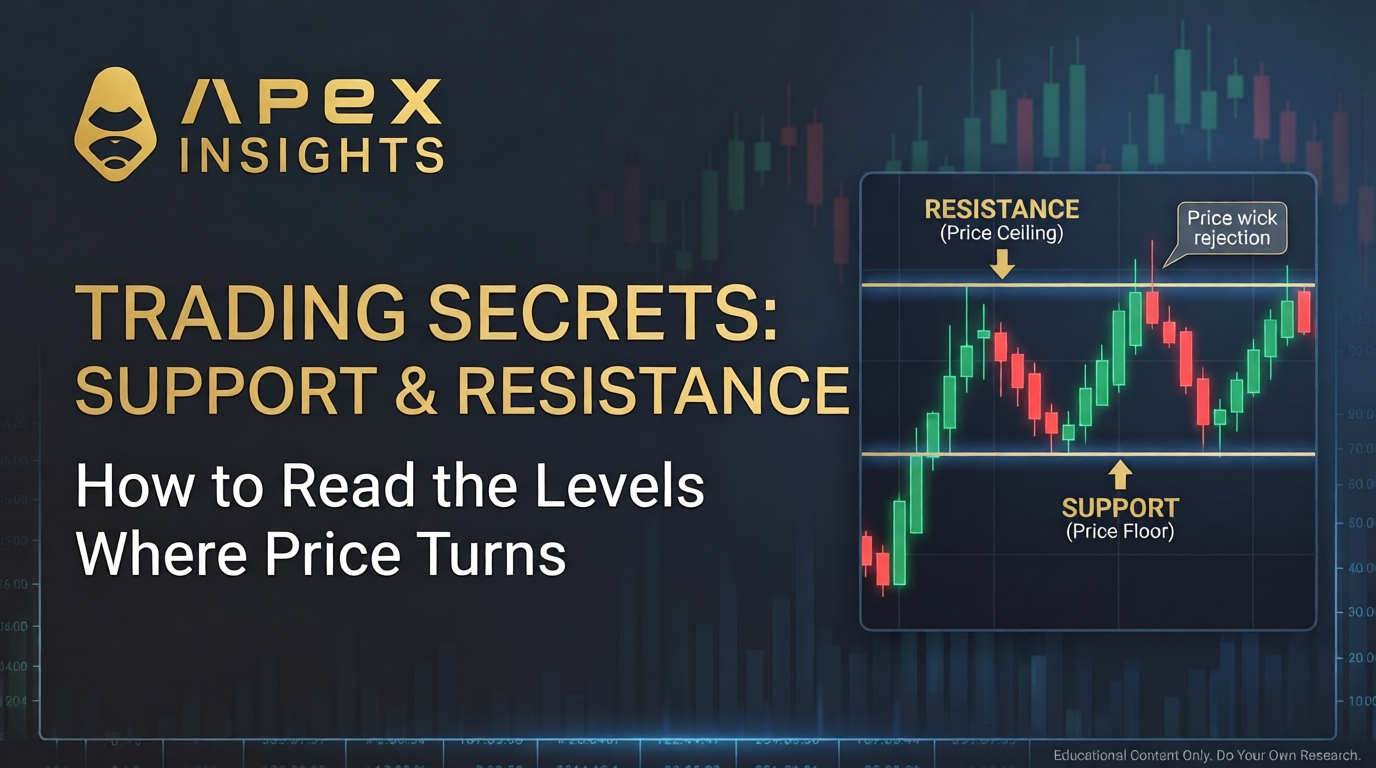
Watch a stock climb toward a round number like $100 and you will often see the same thing happen. It speeds up, stalls, stutters, and turns back, as if it hit a ceiling nobody drew. That ceiling is resistance. Turn it upside down and you have support, the floor where a falling price tends to catch and bounce.
Support and resistance are the single most useful idea in chart reading, and, unusually for technical analysis, one of the few with real research behind it. This installment is hands-on: how to spot a level, how to tell a genuine break from a trap, how your candlestick skills fit in, and, briefly, what the evidence actually proves.
What a level is
A level is a price where the balance of buyers and sellers has flipped before and is likely to flip again. Support is "the price level at which demand is thought to be strong enough to prevent the price from declining further." Resistance is where "selling is thought to be strong enough to prevent the price from rising further" (StockCharts). Floor and ceiling. Price tends to travel in the range between them until one finally gives way.
Keep the hedge in those definitions: demand is "thought to be" strong enough. A level is a zone of probability, not a magic wall.
Watch a level work
The fastest way to understand levels is to walk through one. Here is a stock that keeps running into trouble at 100, by the numbers:
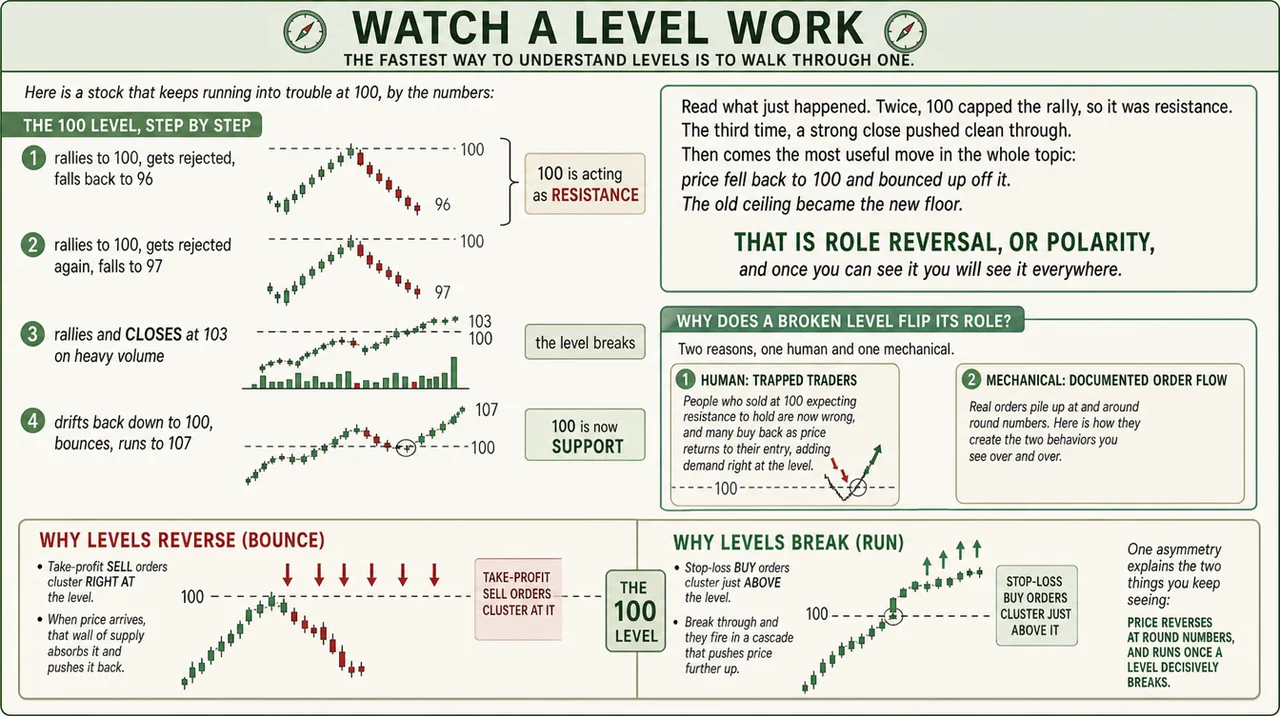
Read what just happened. Twice, 100 capped the rally, so it was resistance. The third time, a strong close pushed clean through. Then comes the most useful move in the whole topic: price fell back to 100 and bounced up off it. The old ceiling became the new floor. That is role reversal, or polarity, and once you can see it you will see it everywhere.
Why does a broken level flip its role? Two reasons, one human and one mechanical. The human one is trapped traders: people who sold at 100 expecting resistance to hold are now wrong, and many buy back as price returns to their entry, adding demand right at the level. The mechanical one is documented order flow, and it is the most interesting fact in the topic.
Real orders pile up at and around round numbers. Take-profit orders cluster right at the level, so when price arrives, that wall absorbs it and pushes it back, a bounce. Stop-loss orders sit just beyond the level, so the moment price breaks through, those stops trigger in a chain reaction that accelerates the move. One asymmetry explains the two things you keep seeing: price reverses at round numbers, and runs once a level decisively breaks.
Where the levels actually are
Levels are not scattered at random. A handful of kinds show up over and over, and knowing them tells you where to look:
Prior swing highs and lows. The simplest and strongest levels are just the places price turned before. A peak that capped the last rally is the resistance to watch on the next run at it; a trough that held is the support.
Round numbers. Whole figures like $50, $100, or 1.2000 in a currency pull price because that is where orders concentrate, the pile-up you just saw.
Flipped levels. A broken support becomes resistance and a broken resistance becomes support. A level that has played both roles, like our 100, has proven itself twice and is worth the most.
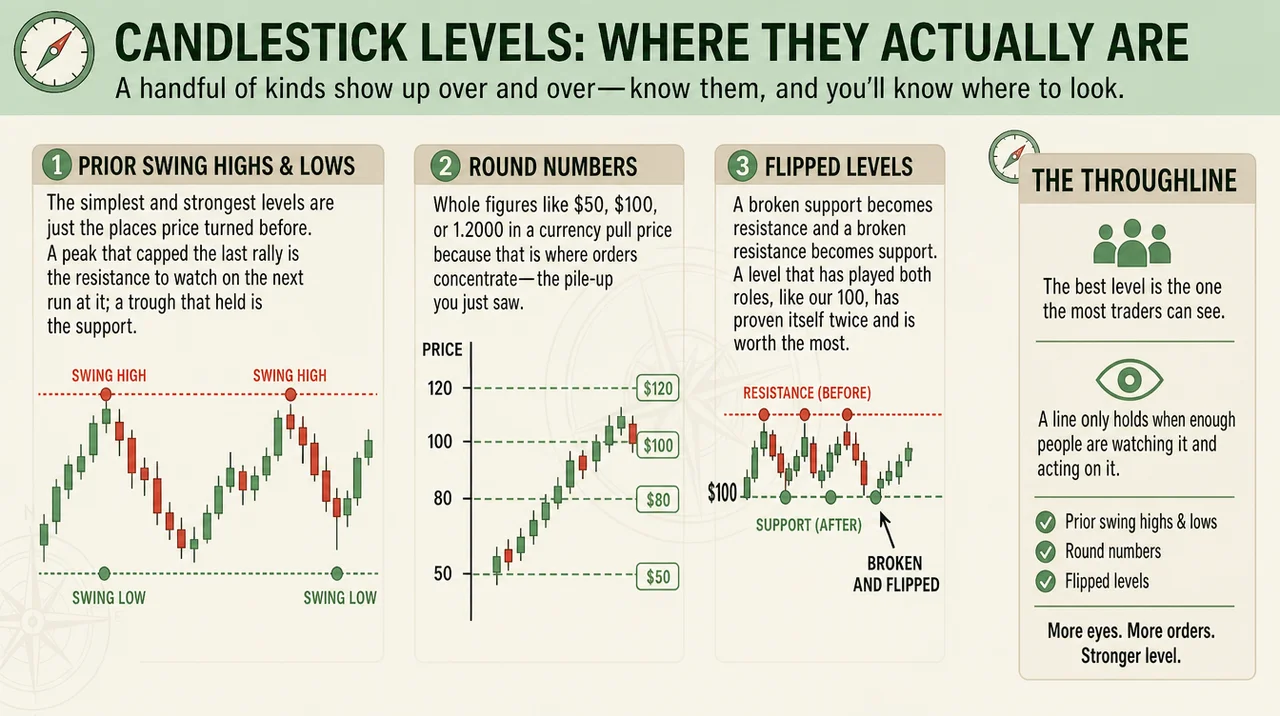
The throughline: the best level is the one the most traders can see. A line only holds when enough people are watching it and acting on it.
How to read a level
Spotting levels is a craft with a few rules that keep you honest.
Draw zones, not hairlines. Technical analysis "is not an exact science," and price overshoots and undershoots. A level is a band a few ticks wide, not a single price.
Count the touches. The more times a level has turned price back, the more it is worth (Wikipedia). One touch is a guess; three is a level.
Favor the obvious. Prior major highs and lows, and round numbers, are the levels the most traders can see, which is exactly why they matter.
This is where your candlestick skills pay off. A single candle is close to a coin flip on its own, but at a level it gains context. A long lower wick rejecting support, or a bullish reversal pattern forming right at a prior low, is a real signal because the level tells you where the orders are waiting. Candlesticks "can confirm or mark support," and a bullish reversal at support says demand is showing up to defend it (StockCharts).
It is also your defense against the most common trap at any level: the false breakout. Price pokes past the line, sucks in everyone chasing the move, then snaps back and traps them. The tell is volume. A genuine break comes with a clear surge in volume and a firm close beyond the level; a low-volume poke that cannot close beyond is usually a fakeout (Capital.com). Picture the two cases side by side:
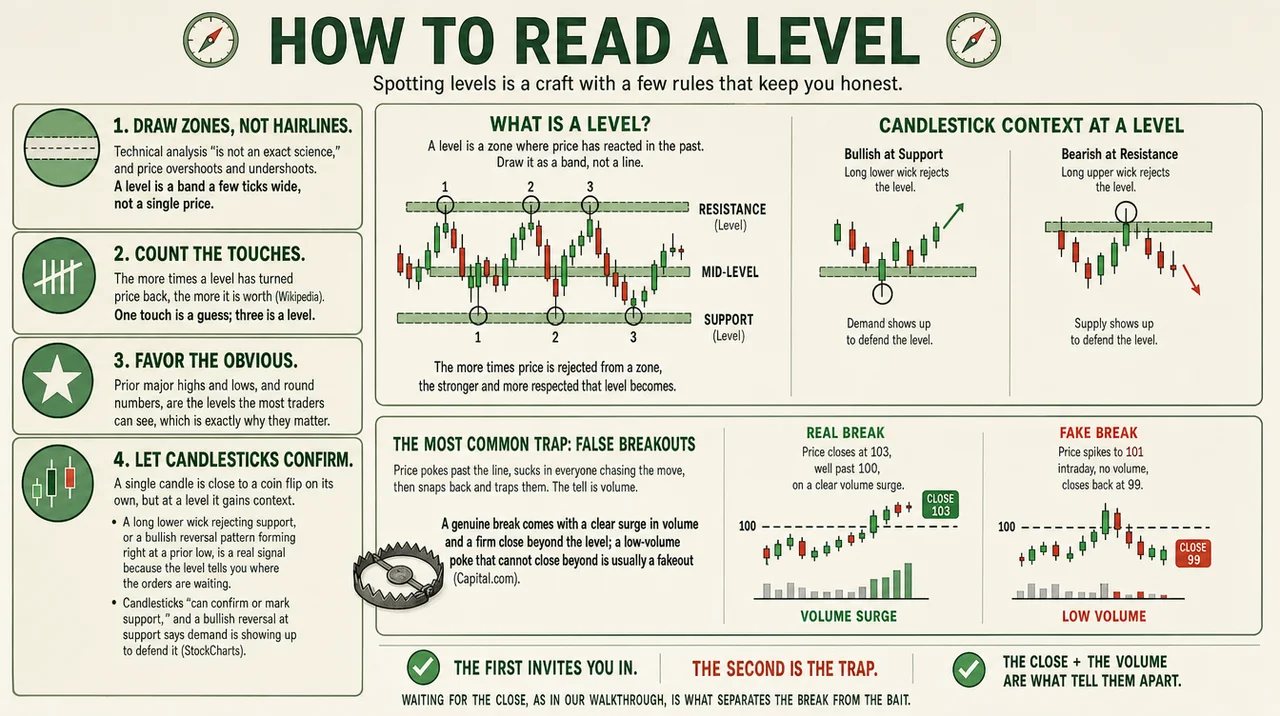
The first invites you in; the second is the trap, and the close plus the volume are what tell them apart. Waiting for the close, as in our walkthrough, is what separates the break from the bait.
Does it actually hold up?
Most chart lore falls apart when somebody tests it. Support and resistance mostly survives, which is what makes it worth your time.
The best evidence comes from the Federal Reserve. Economist Carol Osler took the actual support and resistance levels that six currency-trading firms published to clients and checked them against real price data. Her finding: "strong evidence that the levels help to predict intraday trend interruptions" (Osler, FRBNY). Price stalled and turned at those published levels more often than at randomly chosen ones. The edge was real but modest and varied by market, so think tilt, not certainty. And it rests on the order-clustering machinery from our walkthrough, which Osler documented directly, showing that "currency stop-loss orders contribute to rapid, self-reinforcing price movements, or price cascades" (Osler 2005).
There is one popular tool that flunks the test: Fibonacci retracements. Tested across the Dow, NASDAQ, and DAX, a 2022 study found "no support for the use of Fibonacci levels," with price no more likely to bounce at a Fibonacci level than at any random one (Tsinaslanidis et al.). The 61.8% line looks scientific and behaves like a coin toss. Use the levels everyone can see, not the ones a calculator invents.
One honest boundary: the strongest research is intraday foreign exchange from the late 1990s, so treat the principle as sound while not assuming the exact edge transfers to your daily stock or crypto chart.
Lined up, it is the series' usual split: the levels everyone can see earn their reputation, the ones a calculator draws do not.
Tool | What traders are taught | What the evidence shows |
Support/resistance levels | Price obeys them to the tick | A real but modest edge: price turns there more often than at random |
Round numbers | Psychological magnets | Documented: real take-profit and stop orders pile up there |
Fibonacci retracements | Hidden math the market respects | No standalone edge, no better than a random level |
Common mistakes
Treating a level as an exact price. Use a zone. A hairline gets pierced by normal noise and shakes you out.
Trading the touch instead of the confirmation. Entering the instant price reaches a level is how you get caught in fakeouts. Wait for the candle to close, as in the walkthrough.
Drawing twenty lines. If everything is a level, nothing is. Mark the handful that are obvious and well-tested.
Trusting Fibonacci precision. It tests no better than random. Do not give it authority it has not earned.
The bottom line
A level is a place where price has turned before and is likely to turn again, a floor or a ceiling you can see coming. Watch it the way we walked through it: note where price keeps stalling, wait for a close to confirm a break, and remember that a broken ceiling often becomes the next floor. The reason it works is not mysticism but a real pile-up of orders at the prices everyone is watching.
Get this and your candles snap into focus, because a candle at a level is worth ten candles in open space. Next in this series we add the gauge that told us our breakout was real in the first place: volume, the measure of whether the crowd actually showed up for the move.
Explore more from this series: Part 1 | Part 2 | Part 3 | Part 4 | Part 5 (Coming Soon)
This article is for educational and informational purposes only and is not financial, investment, or legal advice. Do your own research and consult a licensed professional before investing.