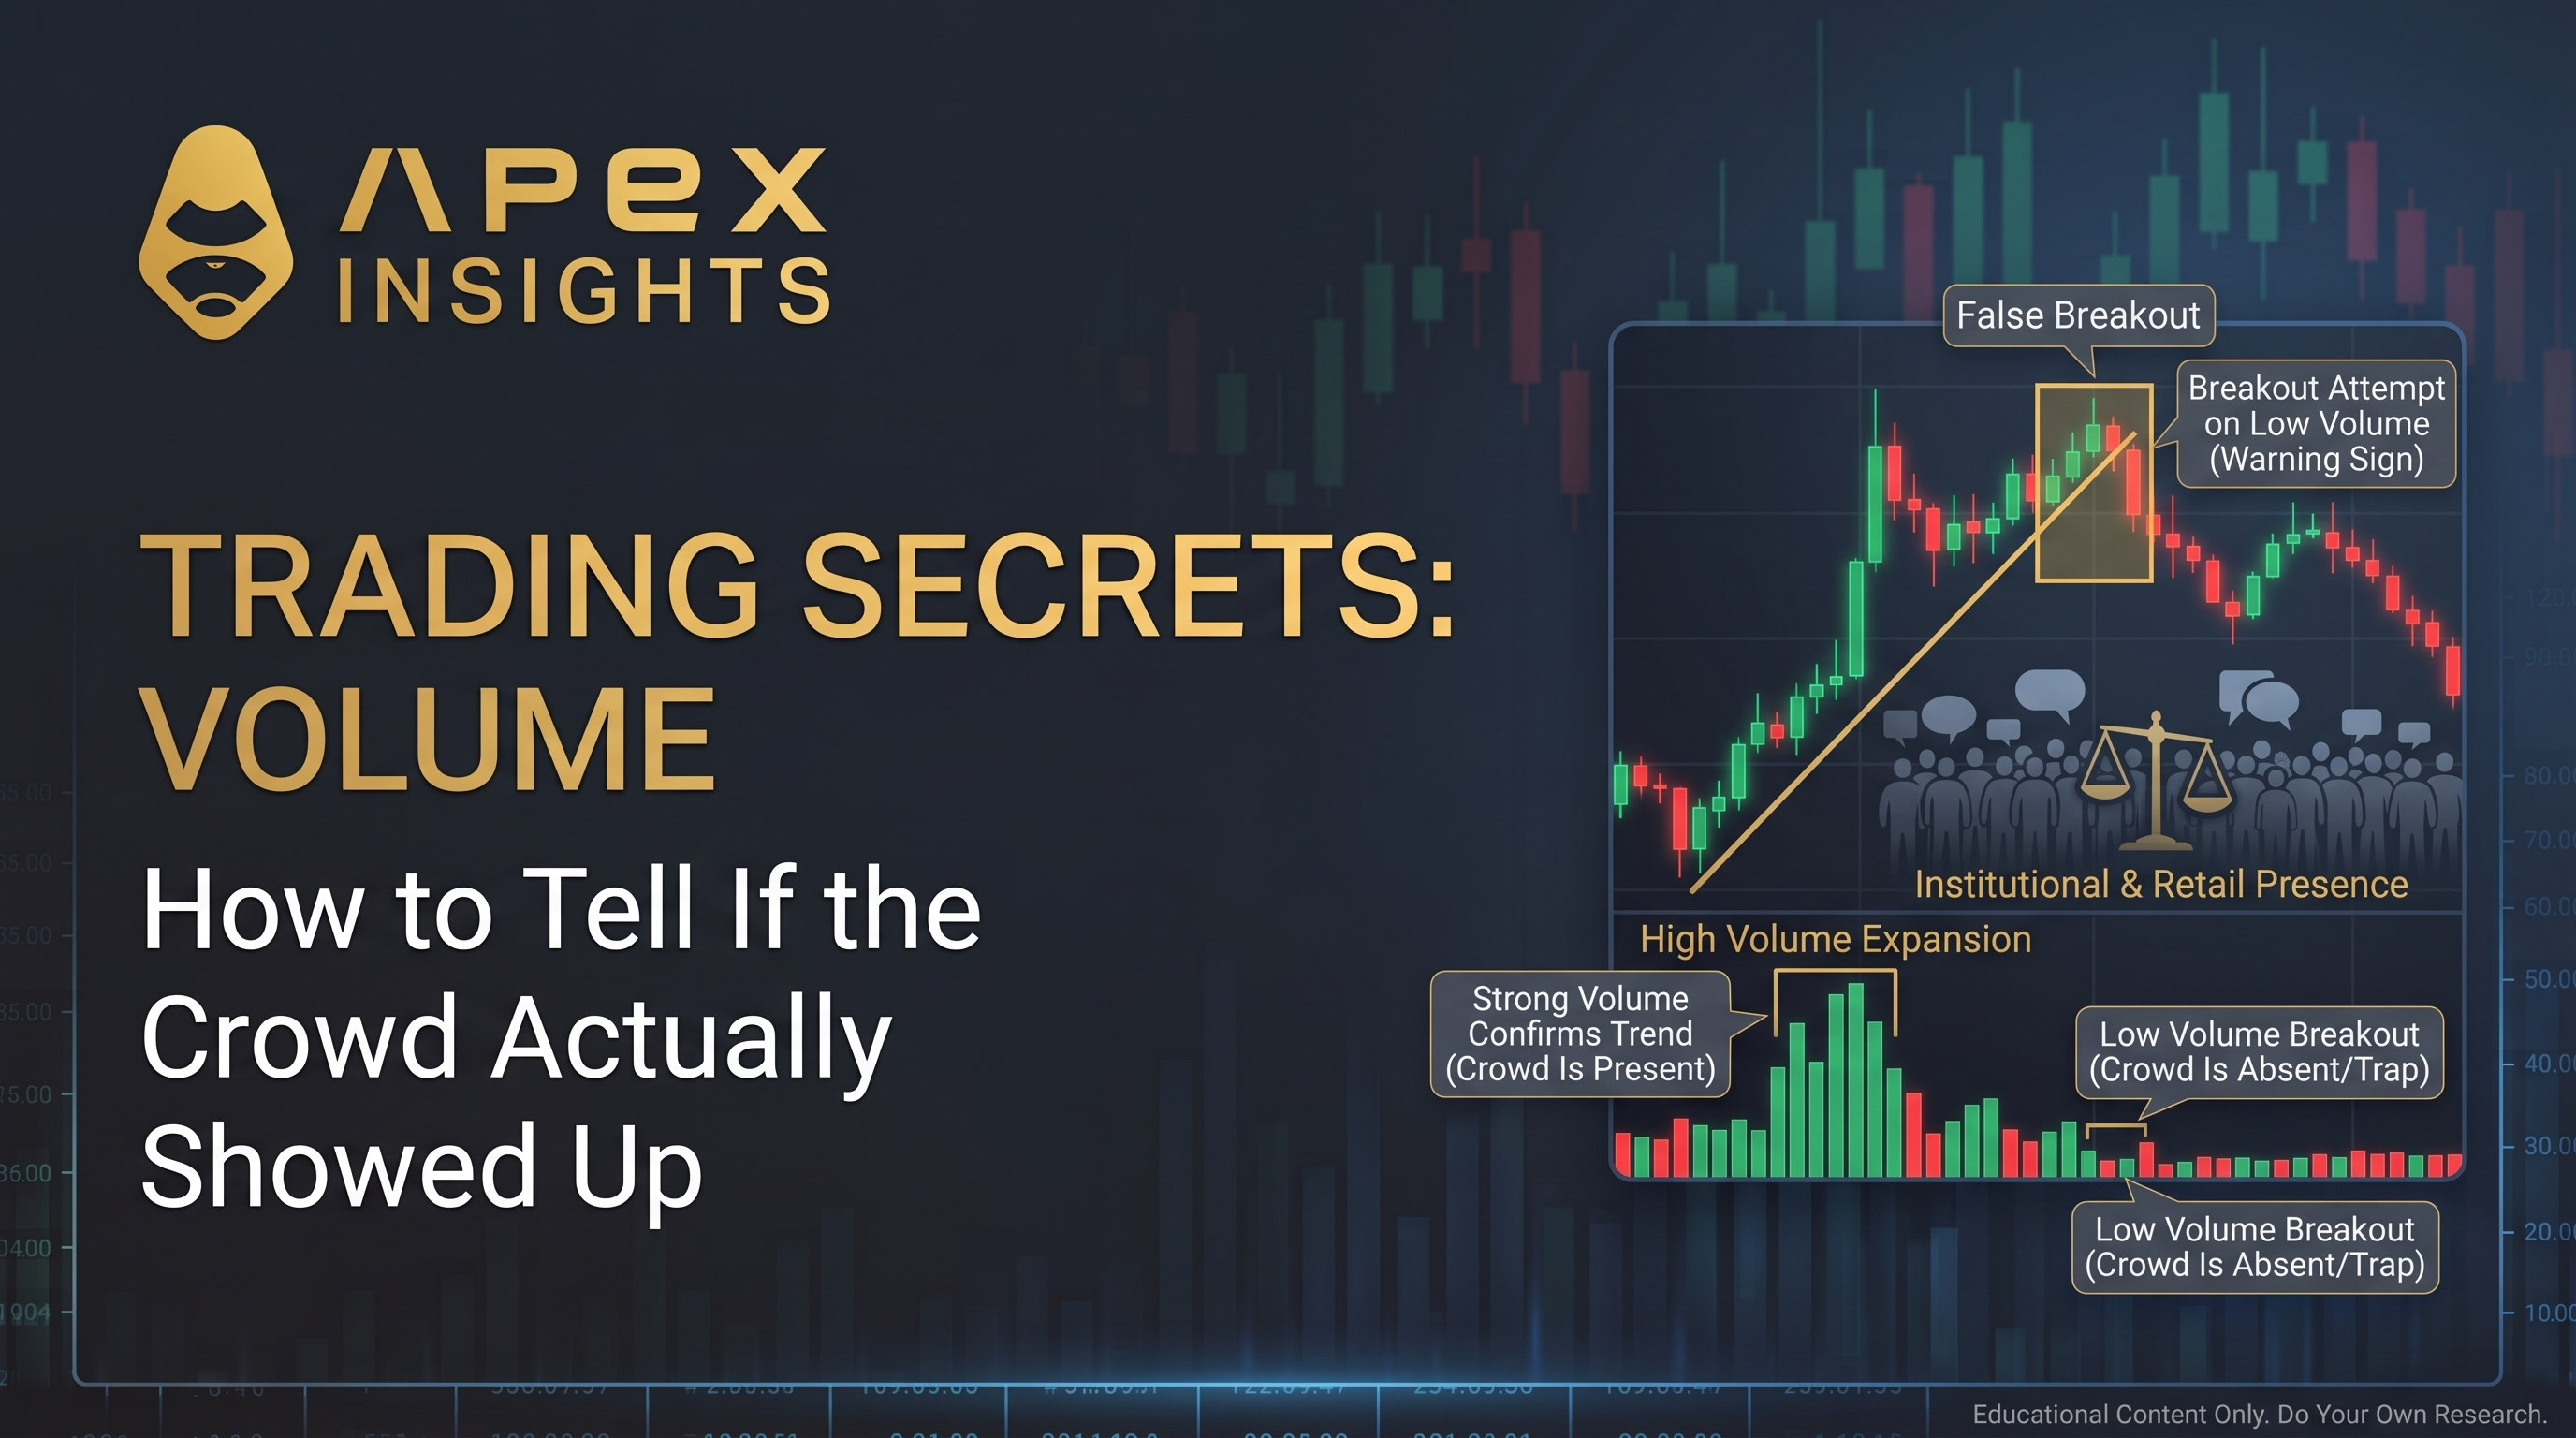
Two stocks break above the same $100 ceiling on the same day. They look identical on the price chart: same candle, same close at 103, same clean break. A week later one is at 112 and the other is back at 96, having trapped everyone who chased it. What separated them was not on the price line at all. It was underneath, in the volume.
Volume is the attendance count of the market: the number of shares or contracts that actually changed hands. Every part of this series so far has leaned on it as the unspoken tiebreaker. Part 3's breakouts, Part 4's real-versus-fake break, Part 5's trend confirmation all said "watch the volume" without ever explaining what it is or whether it works. This installment fixes that, and the honest answer has a twist: volume tells you a lot about how big a move is, less about which way it will go, and on some markets the number itself is a lie.
What volume actually is
Volume is simply the quantity of a security traded in a period, the number of shares for a stock or contracts for a future (Corporate Finance Institute). It is drawn as a row of bars beneath the price chart, one bar per candle, often colored to match the up or down candle above it.
One thing it is not: a count of trades. Five buyers taking one share each and one buyer taking five shares both print as five units of volume. What volume measures is participation, how many hands were involved, which is why traders treat it as a rough gauge of conviction behind a move (StockCharts). A move on heavy volume had a crowd behind it. A move on thin volume was a few people in an empty room.
Watch volume work
Here is the difference between our two breakouts, by the numbers, using the same 100 level from the support-and-resistance installment:
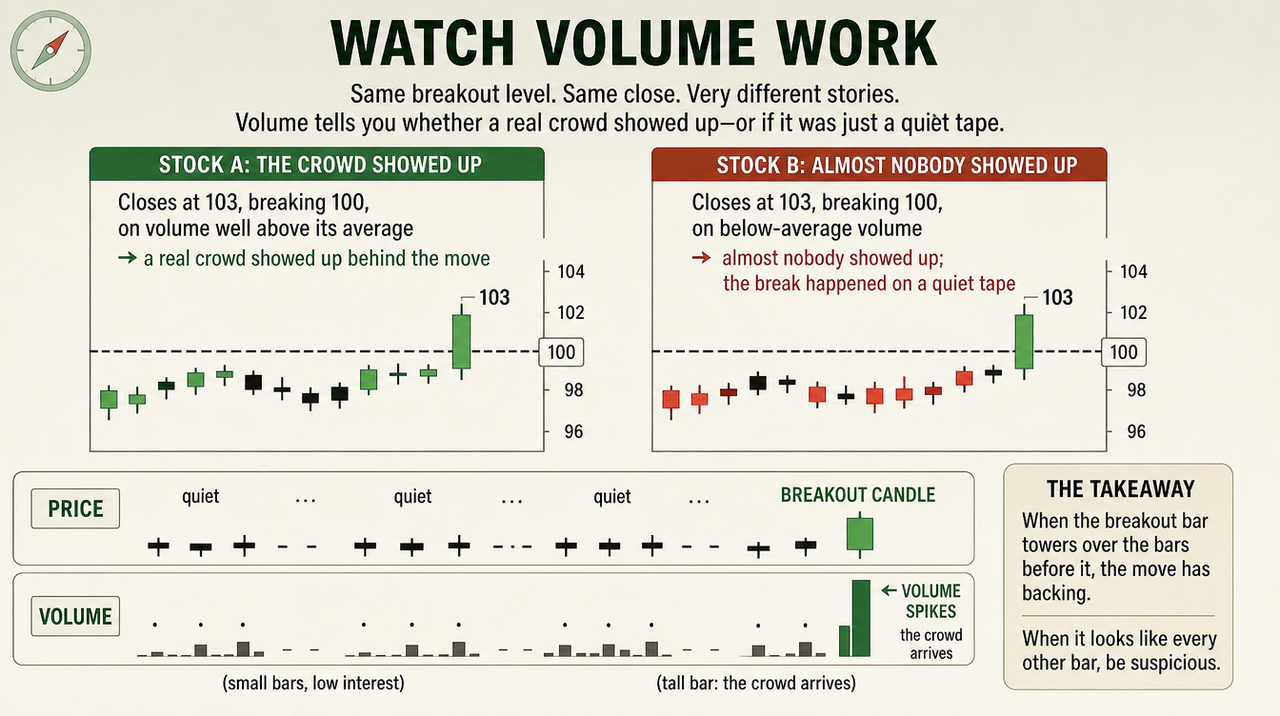
Same price, very different participation. This is the single most useful thing volume does for a chart reader: it tells you whether a move was backed by a real crowd or was just a few orders pushing price through a quiet tape. By convention, traders trust the heavy-volume break more, though that is a rule of thumb rather than a guarantee: quiet breaks sometimes run, and loud ones sometimes trap. Picture it stacked under the price:
When the breakout bar towers over the bars before it, the move has backing. When it looks like every other bar, be suspicious. That is the grain of truth behind "wait for volume to confirm the break," and it is exactly the tell that separates a real break from the fakeout we met in Part 4.
What volume can and cannot tell you
Now the evidence, because this is where folklore and fact part ways.
The most robustly documented fact about volume is not glamorous. In his canonical 1987 survey of the research, Jonathan Karpoff established that volume is positively related to the magnitude of a price change, and in stock markets also to the signed change itself, meaning volume tends to run heavier on up-moves than down-moves (Karpoff, 1987). Read that carefully: the iron law is that volume tracks how big a move is, the volatility, not reliably which direction comes next. Volume measures the size of the fight, not who wins it.
Volume does carry some directional information, but it is subtler than the folklore. Lee and Swaminathan, studying decades of US stocks, found that past trading volume predicts both the strength and the durability of price momentum (Lee & Swaminathan, 2000). The counterintuitive part is the one worth tattooing on your monitor: high-volume winners tend to reverse faster. A monster volume spike on a rally is as easily a sign of exhaustion, the last buyers piling in at the top, as a sign of strength. "Huge volume means the trend has fuel" is precisely backwards as often as it is right.
The same idea extends to a trend, which is how Part 5's confirmation is meant to work in practice. The convention is that a healthy uptrend carries heavier volume on its up-legs than on its pullbacks, and that volume quietly drying up while price keeps climbing is a warning the move is running on fewer and fewer participants. Useful as a rule of thumb, but hold it loosely: that is the conviction idea pointed at direction, and the evidence for the conviction idea is softer than the evidence for volume simply tracking the size of moves.
So the honest verdict: volume genuinely confirms participation and tracks the size of moves, but it is a far weaker predictor of direction than trading lore implies. "Every real breakout needs a volume spike" is a sensible habit, not a tested law. Plenty of real moves start quietly, and plenty of loud ones are exhaustion.
The volume toolkit, and what is folklore
Traders have built dozens of indicators on top of volume. Three you will meet constantly:
Relative volume (RVOL) compares the current bar to its recent average, so an RVOL of 3 means three times normal participation. This is the most honest of the bunch because it just quantifies the "is this bar busy?" question.
On-Balance Volume (OBV), created by Joseph Granville in his 1963 book Granville's New Key to Stock Market Profits, runs a cumulative tally, adding the day's volume on up days and subtracting it on down days, on the theory that the line reveals hidden accumulation before price moves (StockCharts). It is popular, but it rests on Granville's rules of thumb, not on the tested evidence base behind the price-volume relation. Treat its signals as suggestive, not proof.
VWAP (volume-weighted average price) is the average price weighted by volume over a session (Wikipedia). It is genuinely useful, but mostly as an execution benchmark, the price big institutions measure their fills against, not as a crystal ball that predicts the next move.
The pattern by now is familiar: the simple, descriptive uses of volume hold up, and the more an indicator promises to predict direction, the thinner the ground gets.
Is the volume number even real?
There is a problem the textbooks built before crypto never had to face: the volume figure itself can be fabricated. In 2019, the asset manager Bitwise analyzed reported bitcoin trading and told the SEC that roughly 95% of it was fake or non-economic, with real volume concentrated on about ten exchanges (Bitwise, SEC filing 2019). Treat that exact figure with care: Bitwise was applying for a bitcoin ETF, the number was disputed, and exchanges have since cleaned up their reporting. But the direction held up under independent scrutiny. A peer-reviewed study later found that wash trading averaged more than 70% of reported volume on unregulated crypto exchanges (Cong et al., NBER 2022).
The lesson generalizes beyond crypto: volume is only as trustworthy as the venue reporting it. On a regulated exchange it is a hard, audited number. On an unregulated one it can be theater. Before you read anything into a volume bar, make sure it counts real trades.
Reputation versus evidence
Claim about volume | What traders are taught | What the evidence shows |
Volume as conviction | High volume confirms the move | Convention; volume tracks the size of moves more than their direction |
Breakout needs a volume spike | No volume, no real break | Sensible habit, not a tested law; some genuine breaks are quiet |
A volume spike means strength | The trend has fuel | Can mean exhaustion: high-volume winners reverse faster |
OBV and volume indicators | Hidden accumulation signals | Popular but built on rules of thumb, thin tested support |
The reported volume number | A fact you can trust | On unregulated crypto venues, much of it has been fake |
Common mistakes
Chasing a low-volume breakout. A break on thin volume is the classic trap. If the crowd did not show up, the move often does not last.
Reading a volume spike as bullish. Volume is directionless. A huge bar can be aggressive buying or panic selling or exhaustion at a top. Read it with the candle and the trend, never alone.
Trusting volume indicators as signals. OBV and its cousins describe what already happened; they do not reliably foresee what is next. Use them as context, not triggers.
Trusting raw crypto volume. Until you know the venue counts real trades, treat the number as marketing.
The bottom line
Volume is the attendance record behind the price: it tells you how many people cared about a move, which is genuinely useful for separating a real break from a hollow one. What it is not is a direction-finder. The documented core is that volume tracks the size of moves, leans heavier on up-days in stocks, and flags momentum that may be running out of road, while the popular promise that volume predicts which way price goes next is mostly convention. And always check that the number is real before you trust it at all.
That makes volume the perfect confirmation tool and a poor oracle. With it in hand, you now have the full price-action toolkit: the candle, the pattern, the level, the trend, and the participation behind them. Next we put them to work on the big shapes those tools combine into, the classic chart patterns like head-and-shoulders, double tops, and triangles, and we find out, with the numbers, which of them actually earn their fame.
Explore more from this series: Part 1 | Part 2 | Part 3 | Part 4 | Part 5 (Coming Soon)
This article is for educational and informational purposes only and is not financial, investment, or legal advice. Do your own research and consult a licensed professional before investing.