




Published 18 November 2026
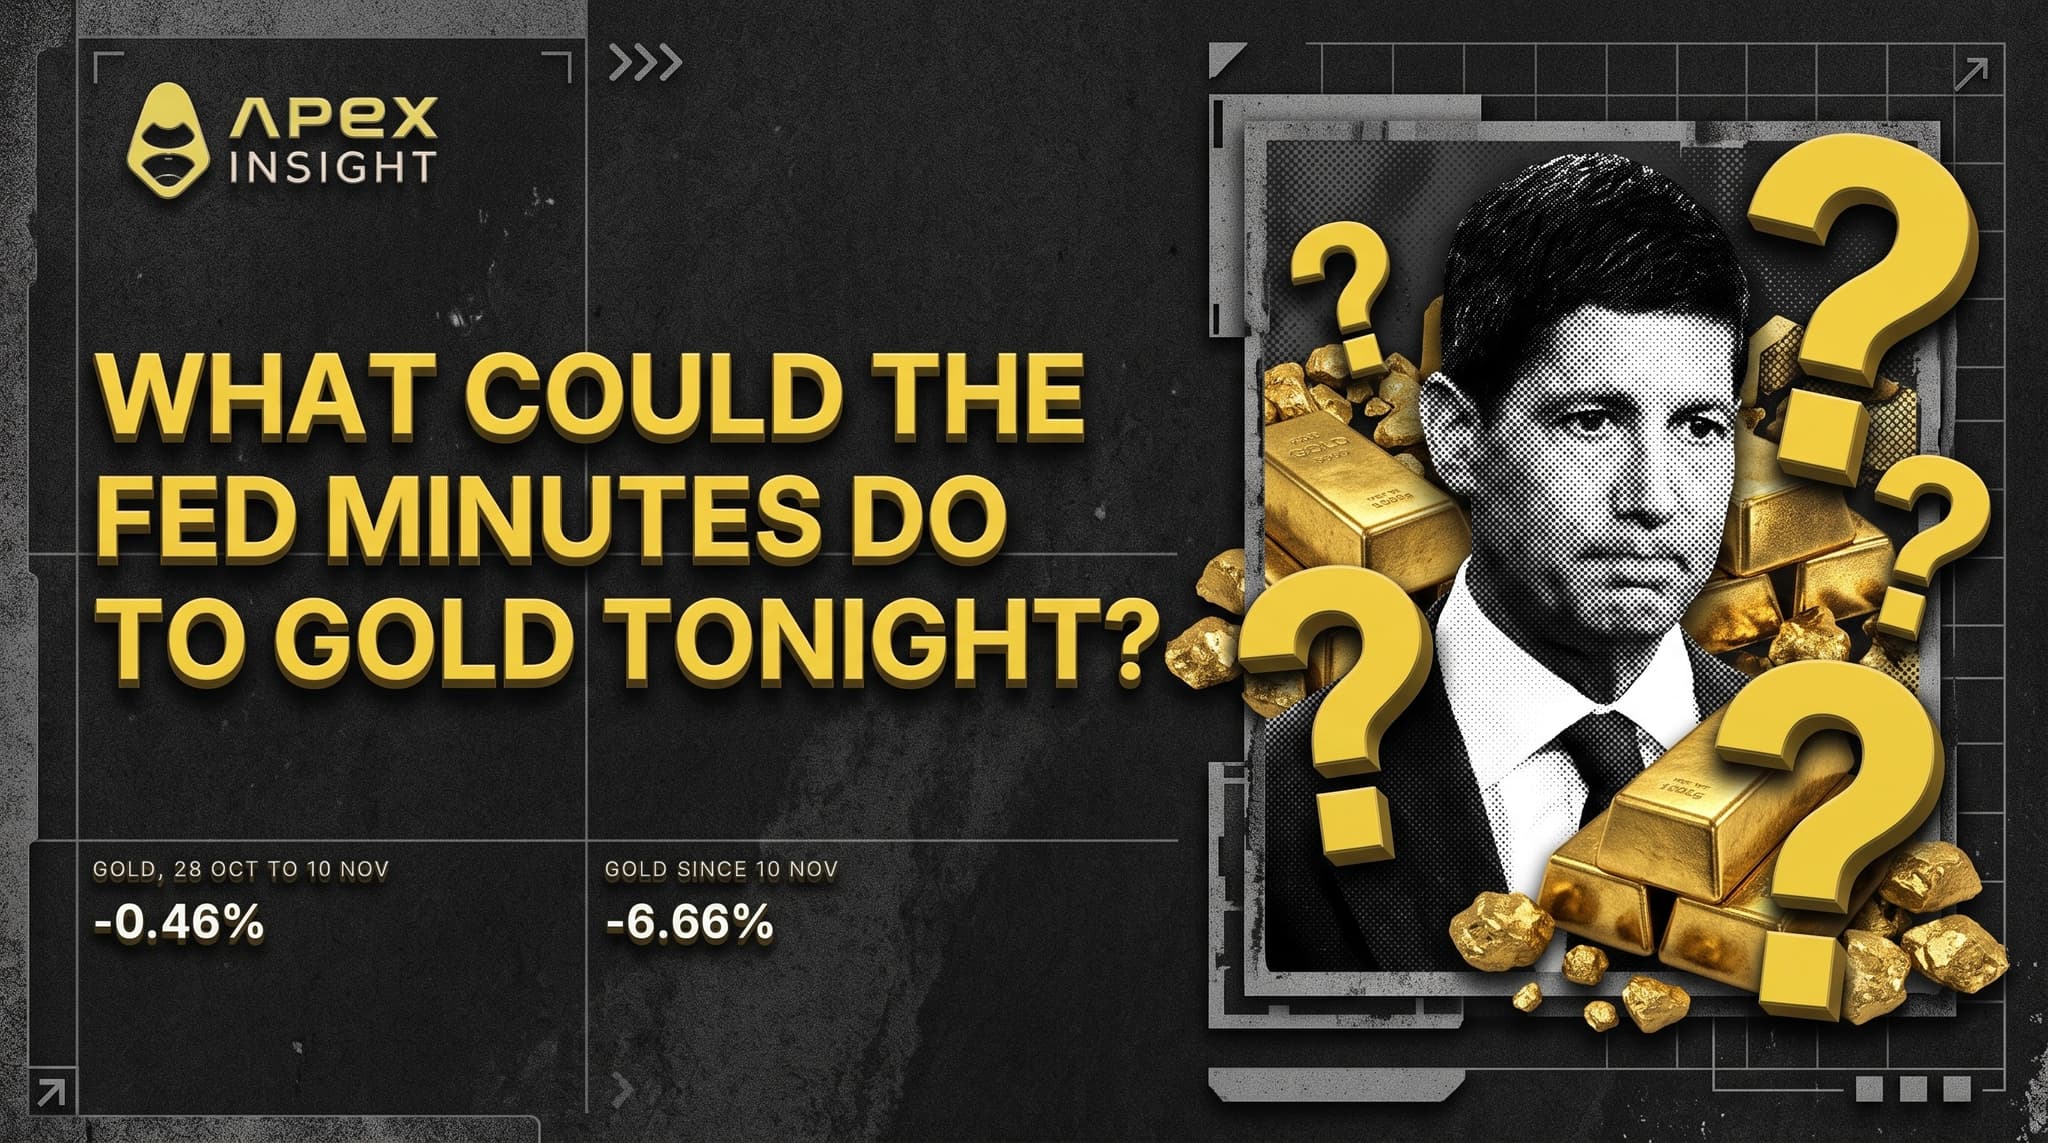
The Federal Reserve publishes the record of its October meeting at 19:00 UTC tonight, two hours before the US cash close. It is a three-week-old document describing a decision that has since been overtaken by a jobs report, an inflation print and a governor floating a half-point rise. On most days that would make it a minor release.
Gold is the reason it is not. Gold is at a one-year low, down 7.09% on the ApeX contract since the committee met, and the way it got there matters more than the level. For the first fortnight it did not fall at all. It only broke when the expected path of the policy rate changed, which is a different thing from investors becoming frightened, and it is the channel tonight's minutes arrive through.
So the question is narrower than it looks. Not whether the minutes are hawkish, but whether gold is still the asset that answers to them. The evidence comes first, because without it tonight's release is just another headline.
Every contract here is lower since the Fed held
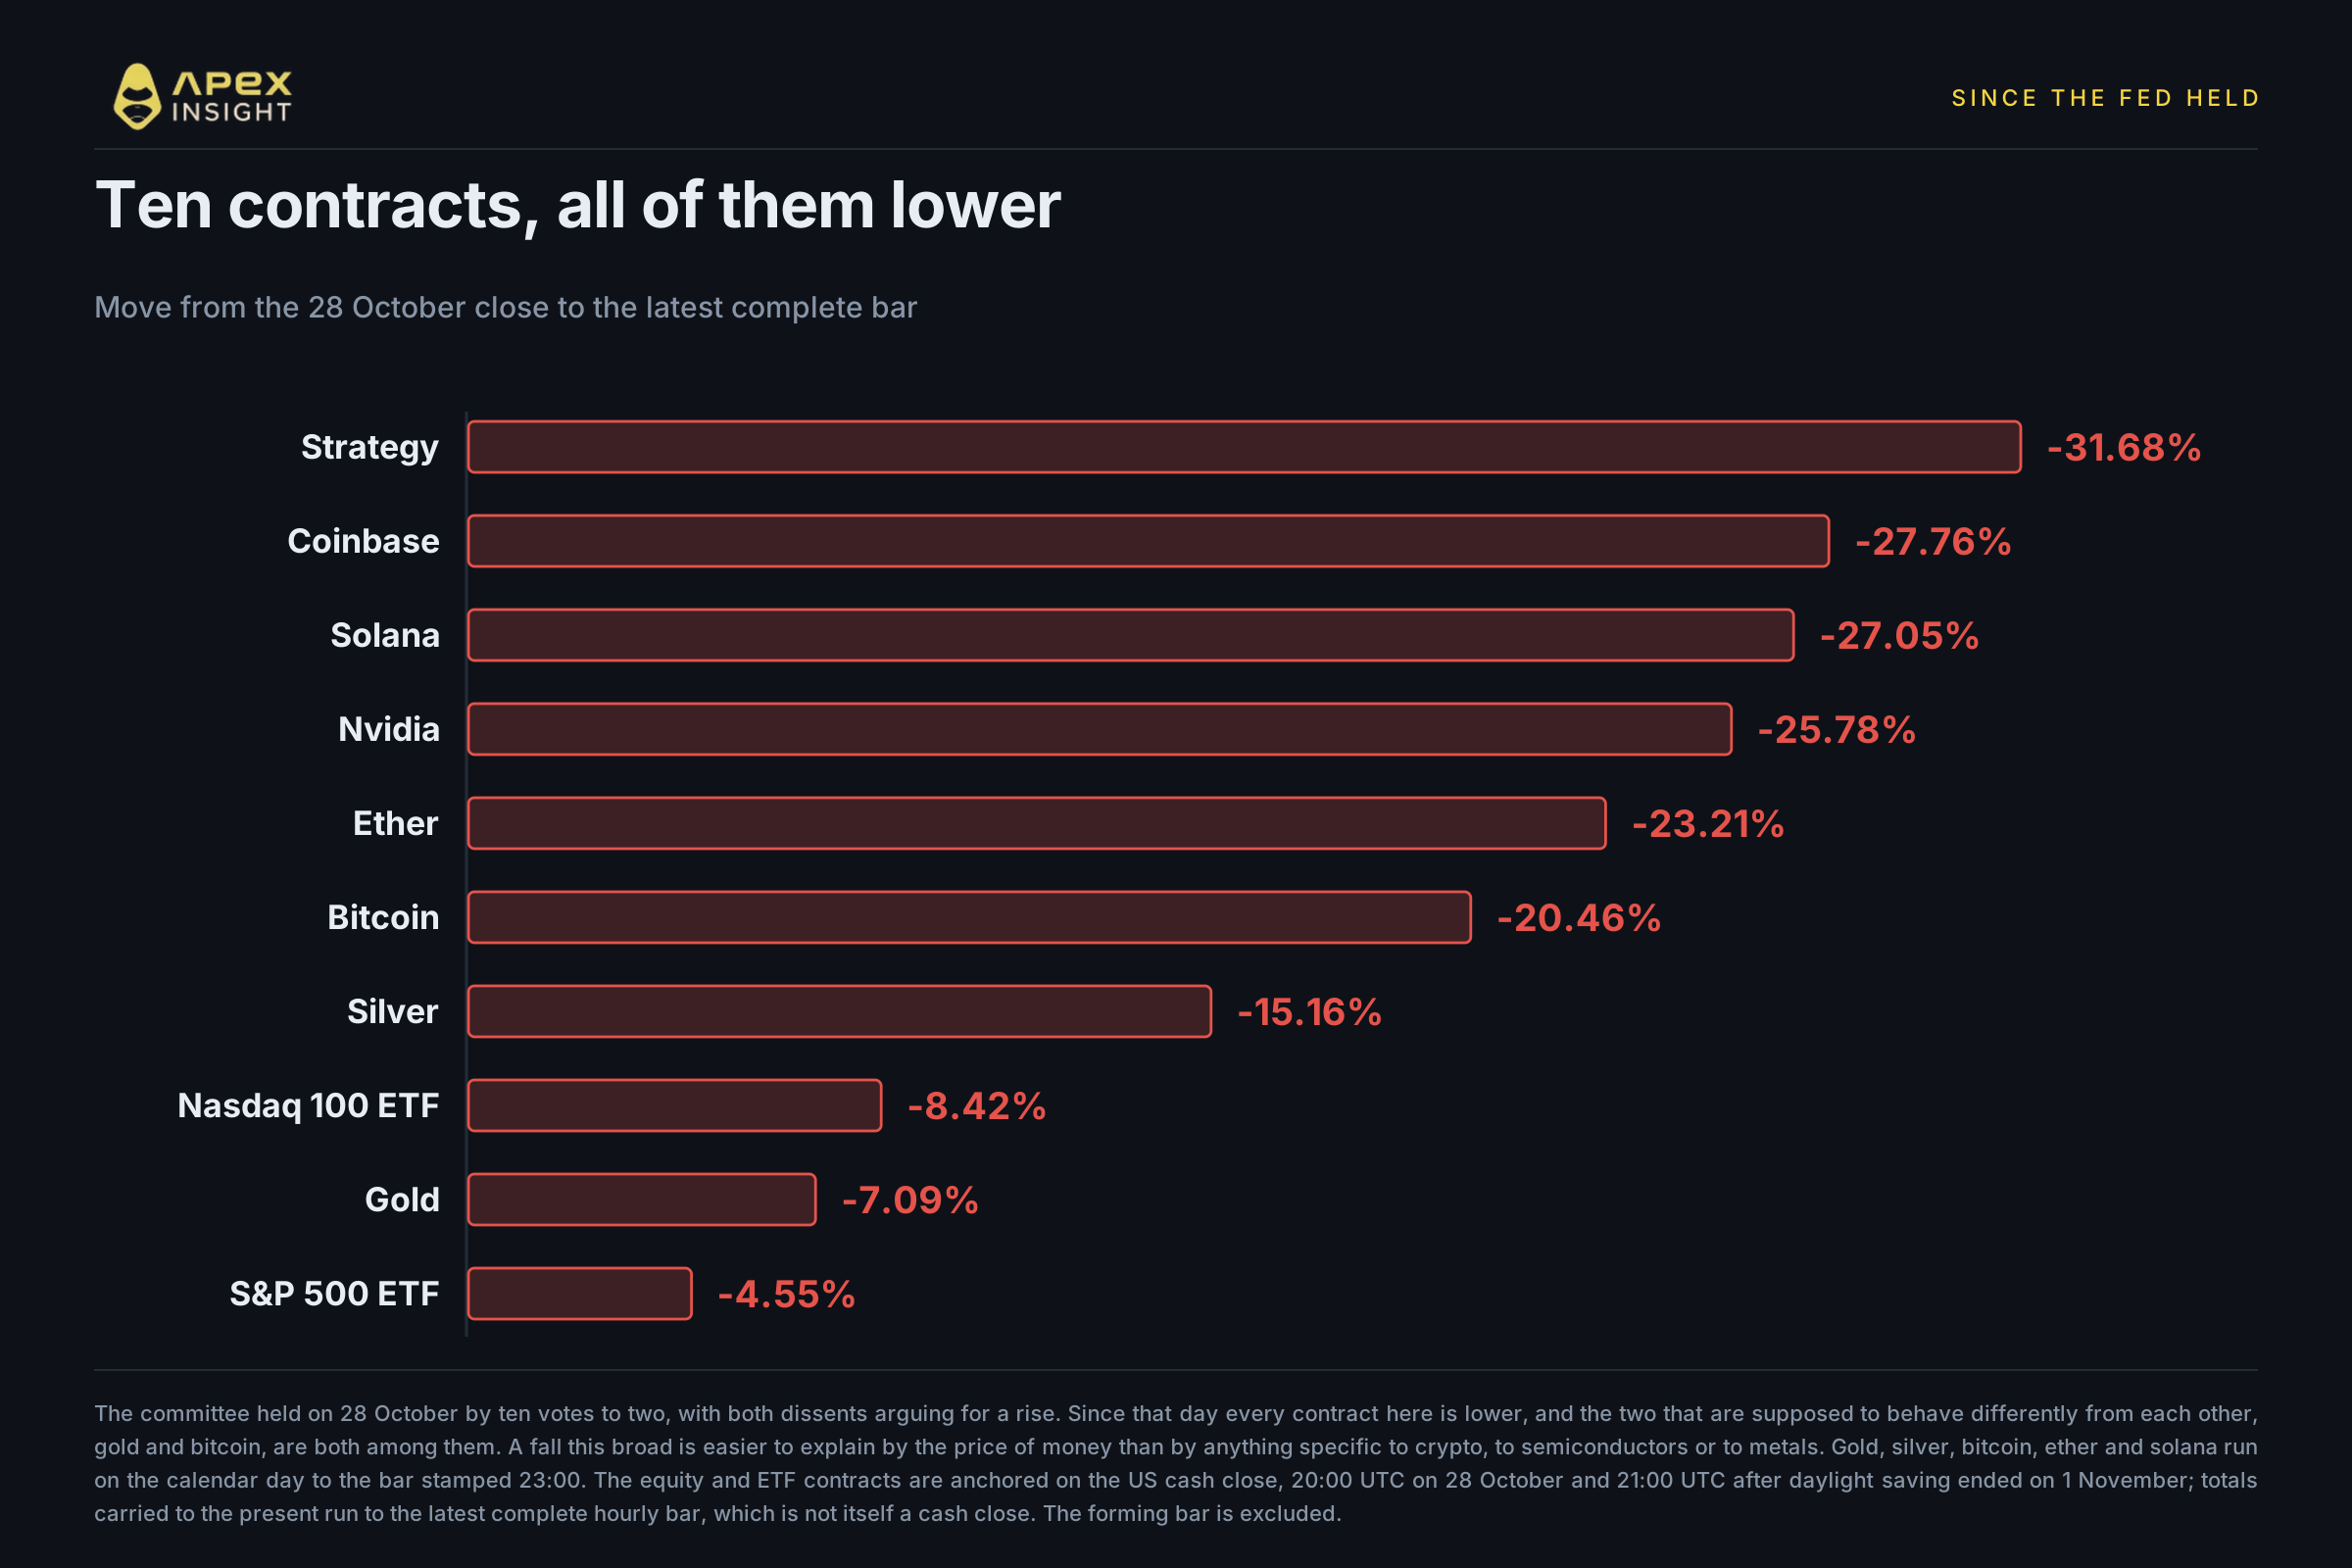
The Federal Open Market Committee met on 27 and 28 October and left its target range at 3.75% to 4.00% by ten votes to two. The two dissents are the part worth holding on to. Governor Lisa Cook and Cleveland Fed President Beth Hammack both wanted a quarter-point rise. Not a cut, and not a hold. That is a committee arguing about how fast to tighten.
Measured from that day's close to the latest complete bar, every contract in this article is down. The metals and crypto contracts run on the calendar day while the equity and ETF contracts are anchored on the US cash close, so these ten are close to like for like rather than exactly so. Strategy is the worst at 31.68%, Coinbase at 27.76%, Solana at 27.05%. The S&P 500 contract has lost the least at 4.55%. Gold sits at 7.09%.
A fall that broad is a clue in itself. When one sector breaks, the damage is concentrated and you can name the cause. When metals, crypto, large-cap technology and the two broad index contracts all move the same way over three weeks, the common factor is more likely to be the price of money than anything specific to any of them.
But a list of totals hides the thing that matters, because it flattens the order in which they fell.
Gold held its ground, then broke
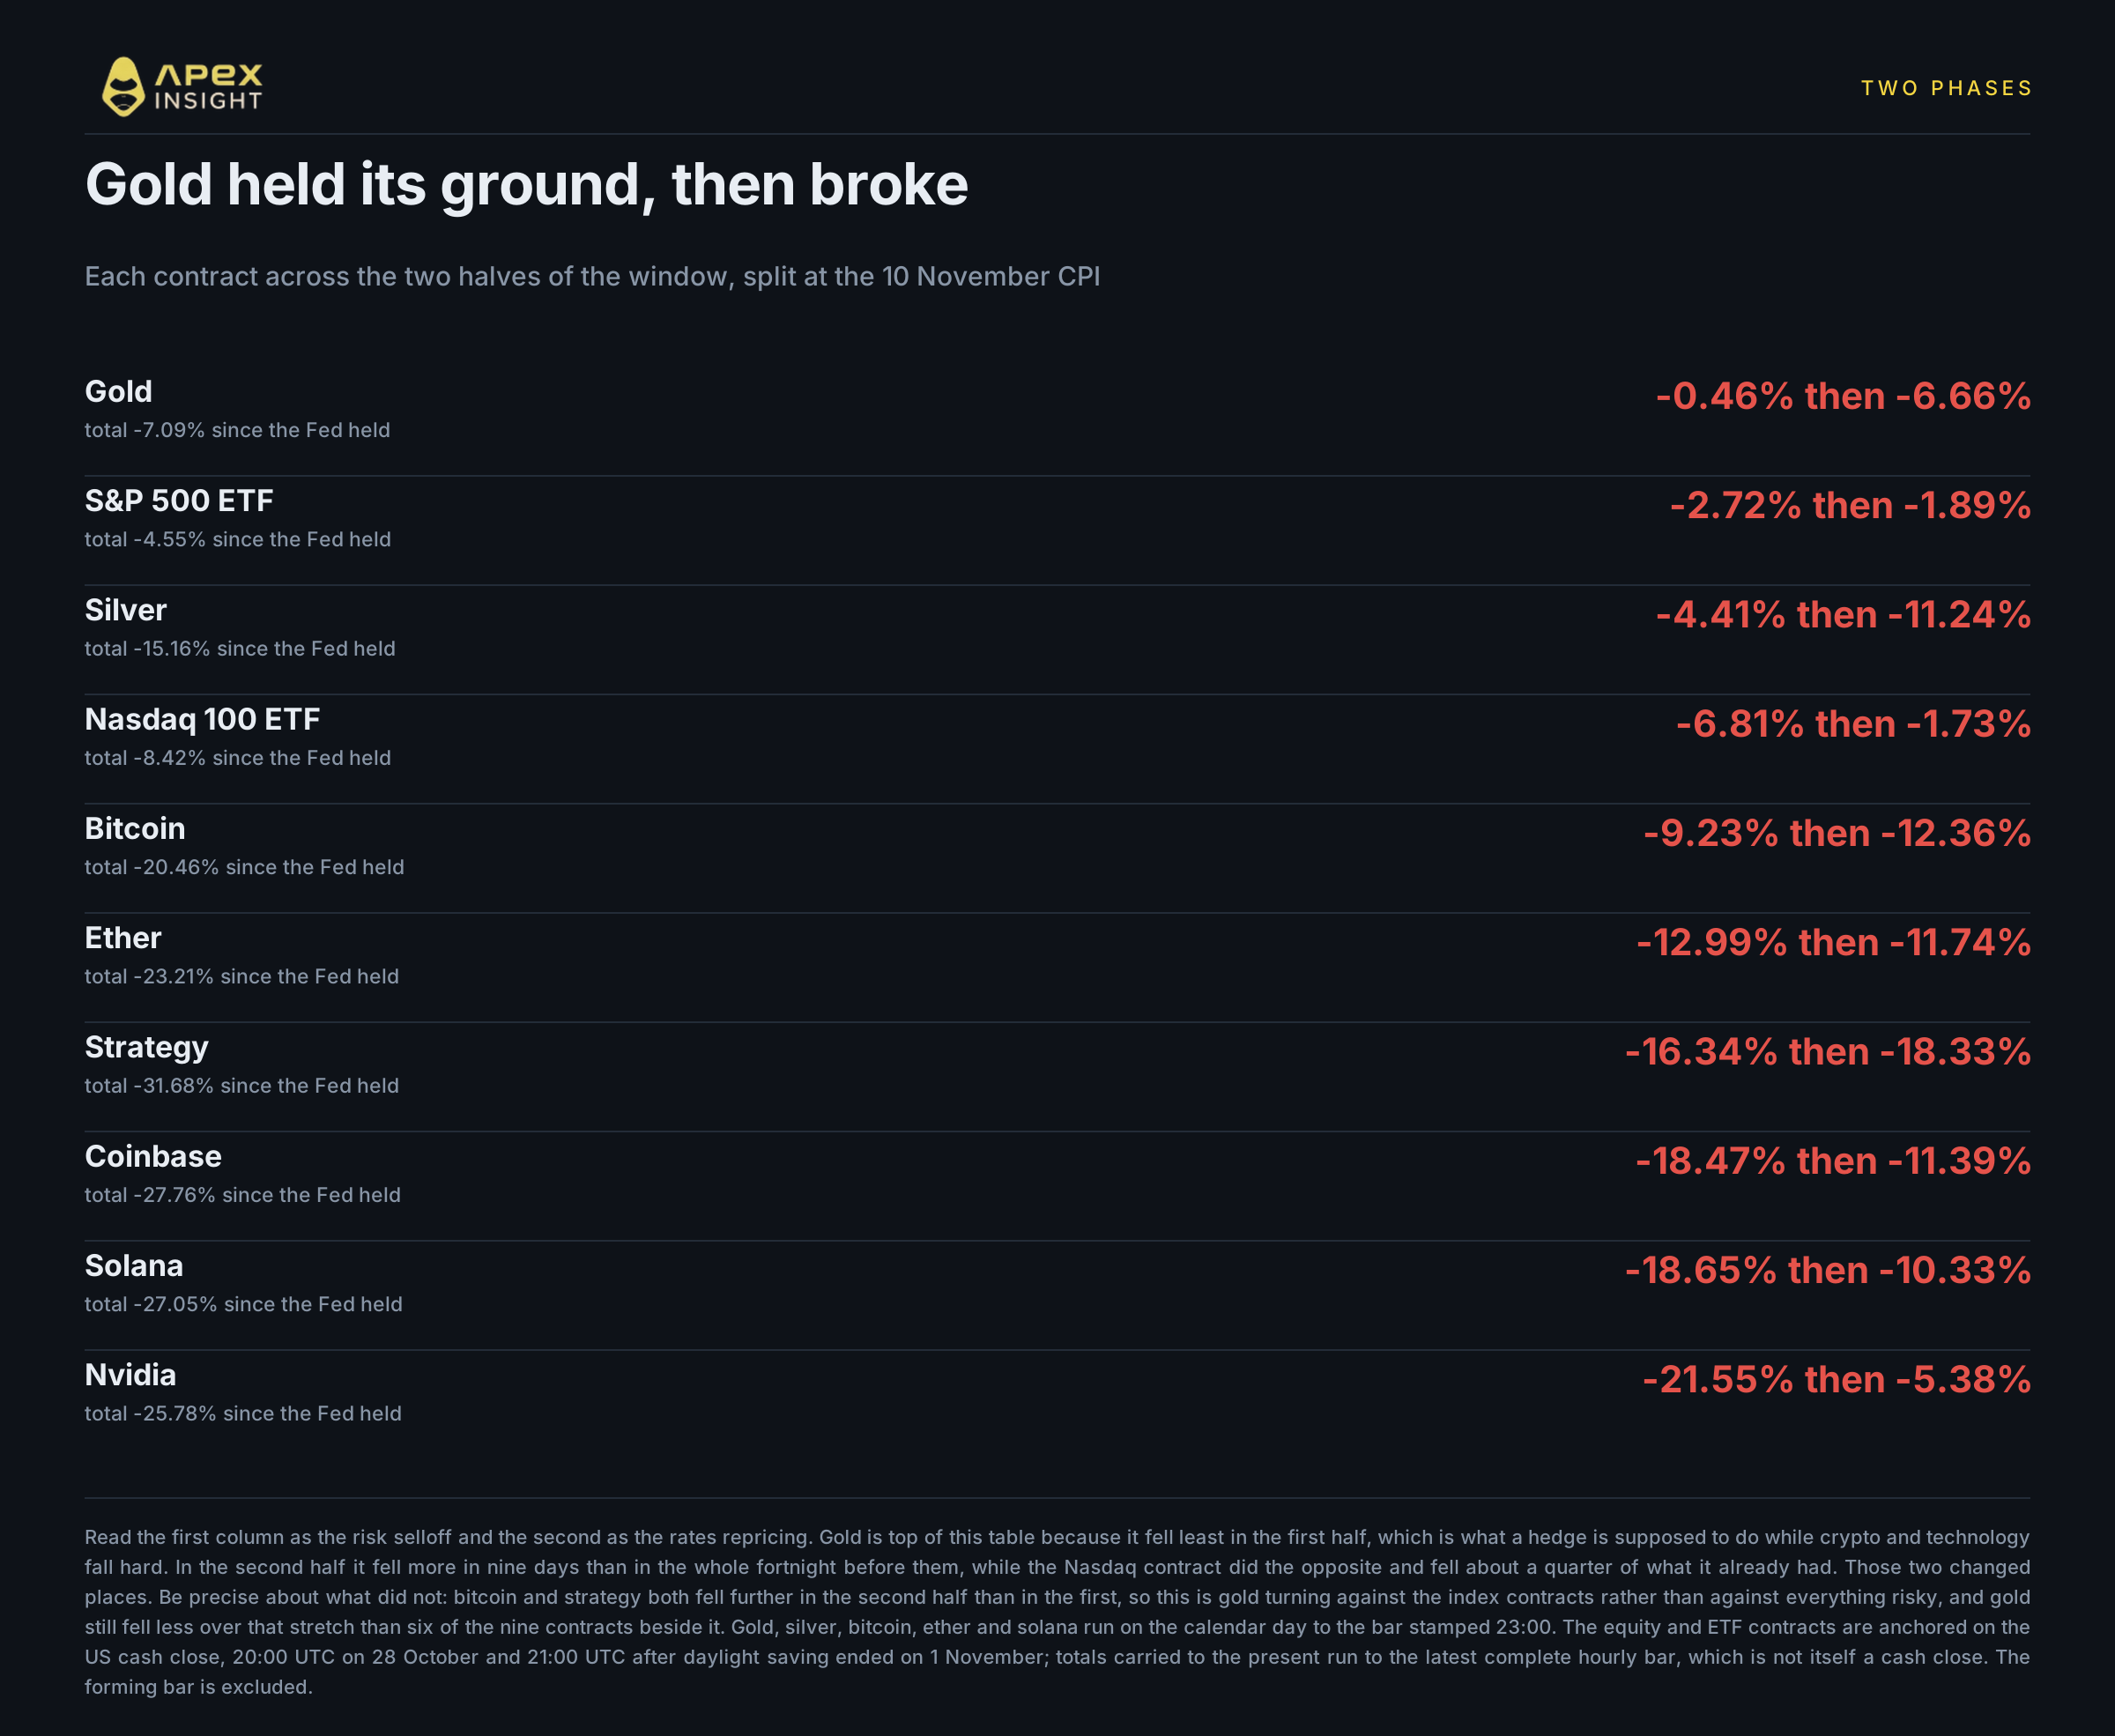
Split the window at 10 November and the single number becomes two, and they do not tell the same story.
In the first half, from the Fed's hold to the 10 November close, gold fell 0.46%. Over the same thirteen days bitcoin fell 9.23%, ether 12.99%, Nvidia 21.55% and the Nasdaq contract 6.81%.
That is not gold failing to notice. That is gold doing precisely what it is held for. A hedge is supposed to hold its value while risk assets are being sold, and for a fortnight it did, through a crypto drawdown and a sharp fall in technology.
In the second half gold fell 6.66%, more in those nine days than in the whole fortnight before them. The Nasdaq contract went the other way, falling about a quarter of what it already had. The two changed places.
That is the part a pure risk-appetite story struggles with. If investors had simply become more frightened after 10 November, gold should have gone on holding up against equities rather than reversing against them. Instead the asset that had been holding up started falling hard just as the two broad index contracts that had been falling steadied.
Be precise about what did and did not reverse, because the table above contains the test. This is gold turning against the index contracts, not against everything risky. Bitcoin fell 12.36% in the second half against 9.23% in the first, and Strategy 18.33% against 16.34%; both accelerated downwards. Gold still fell less over that stretch than bitcoin, ether, Strategy, Coinbase, silver and solana. What changed is not that gold became the worst thing to own. It is that it stopped being a refuge from the things it is held against.
Gold was higher on 9 November than when the Fed met
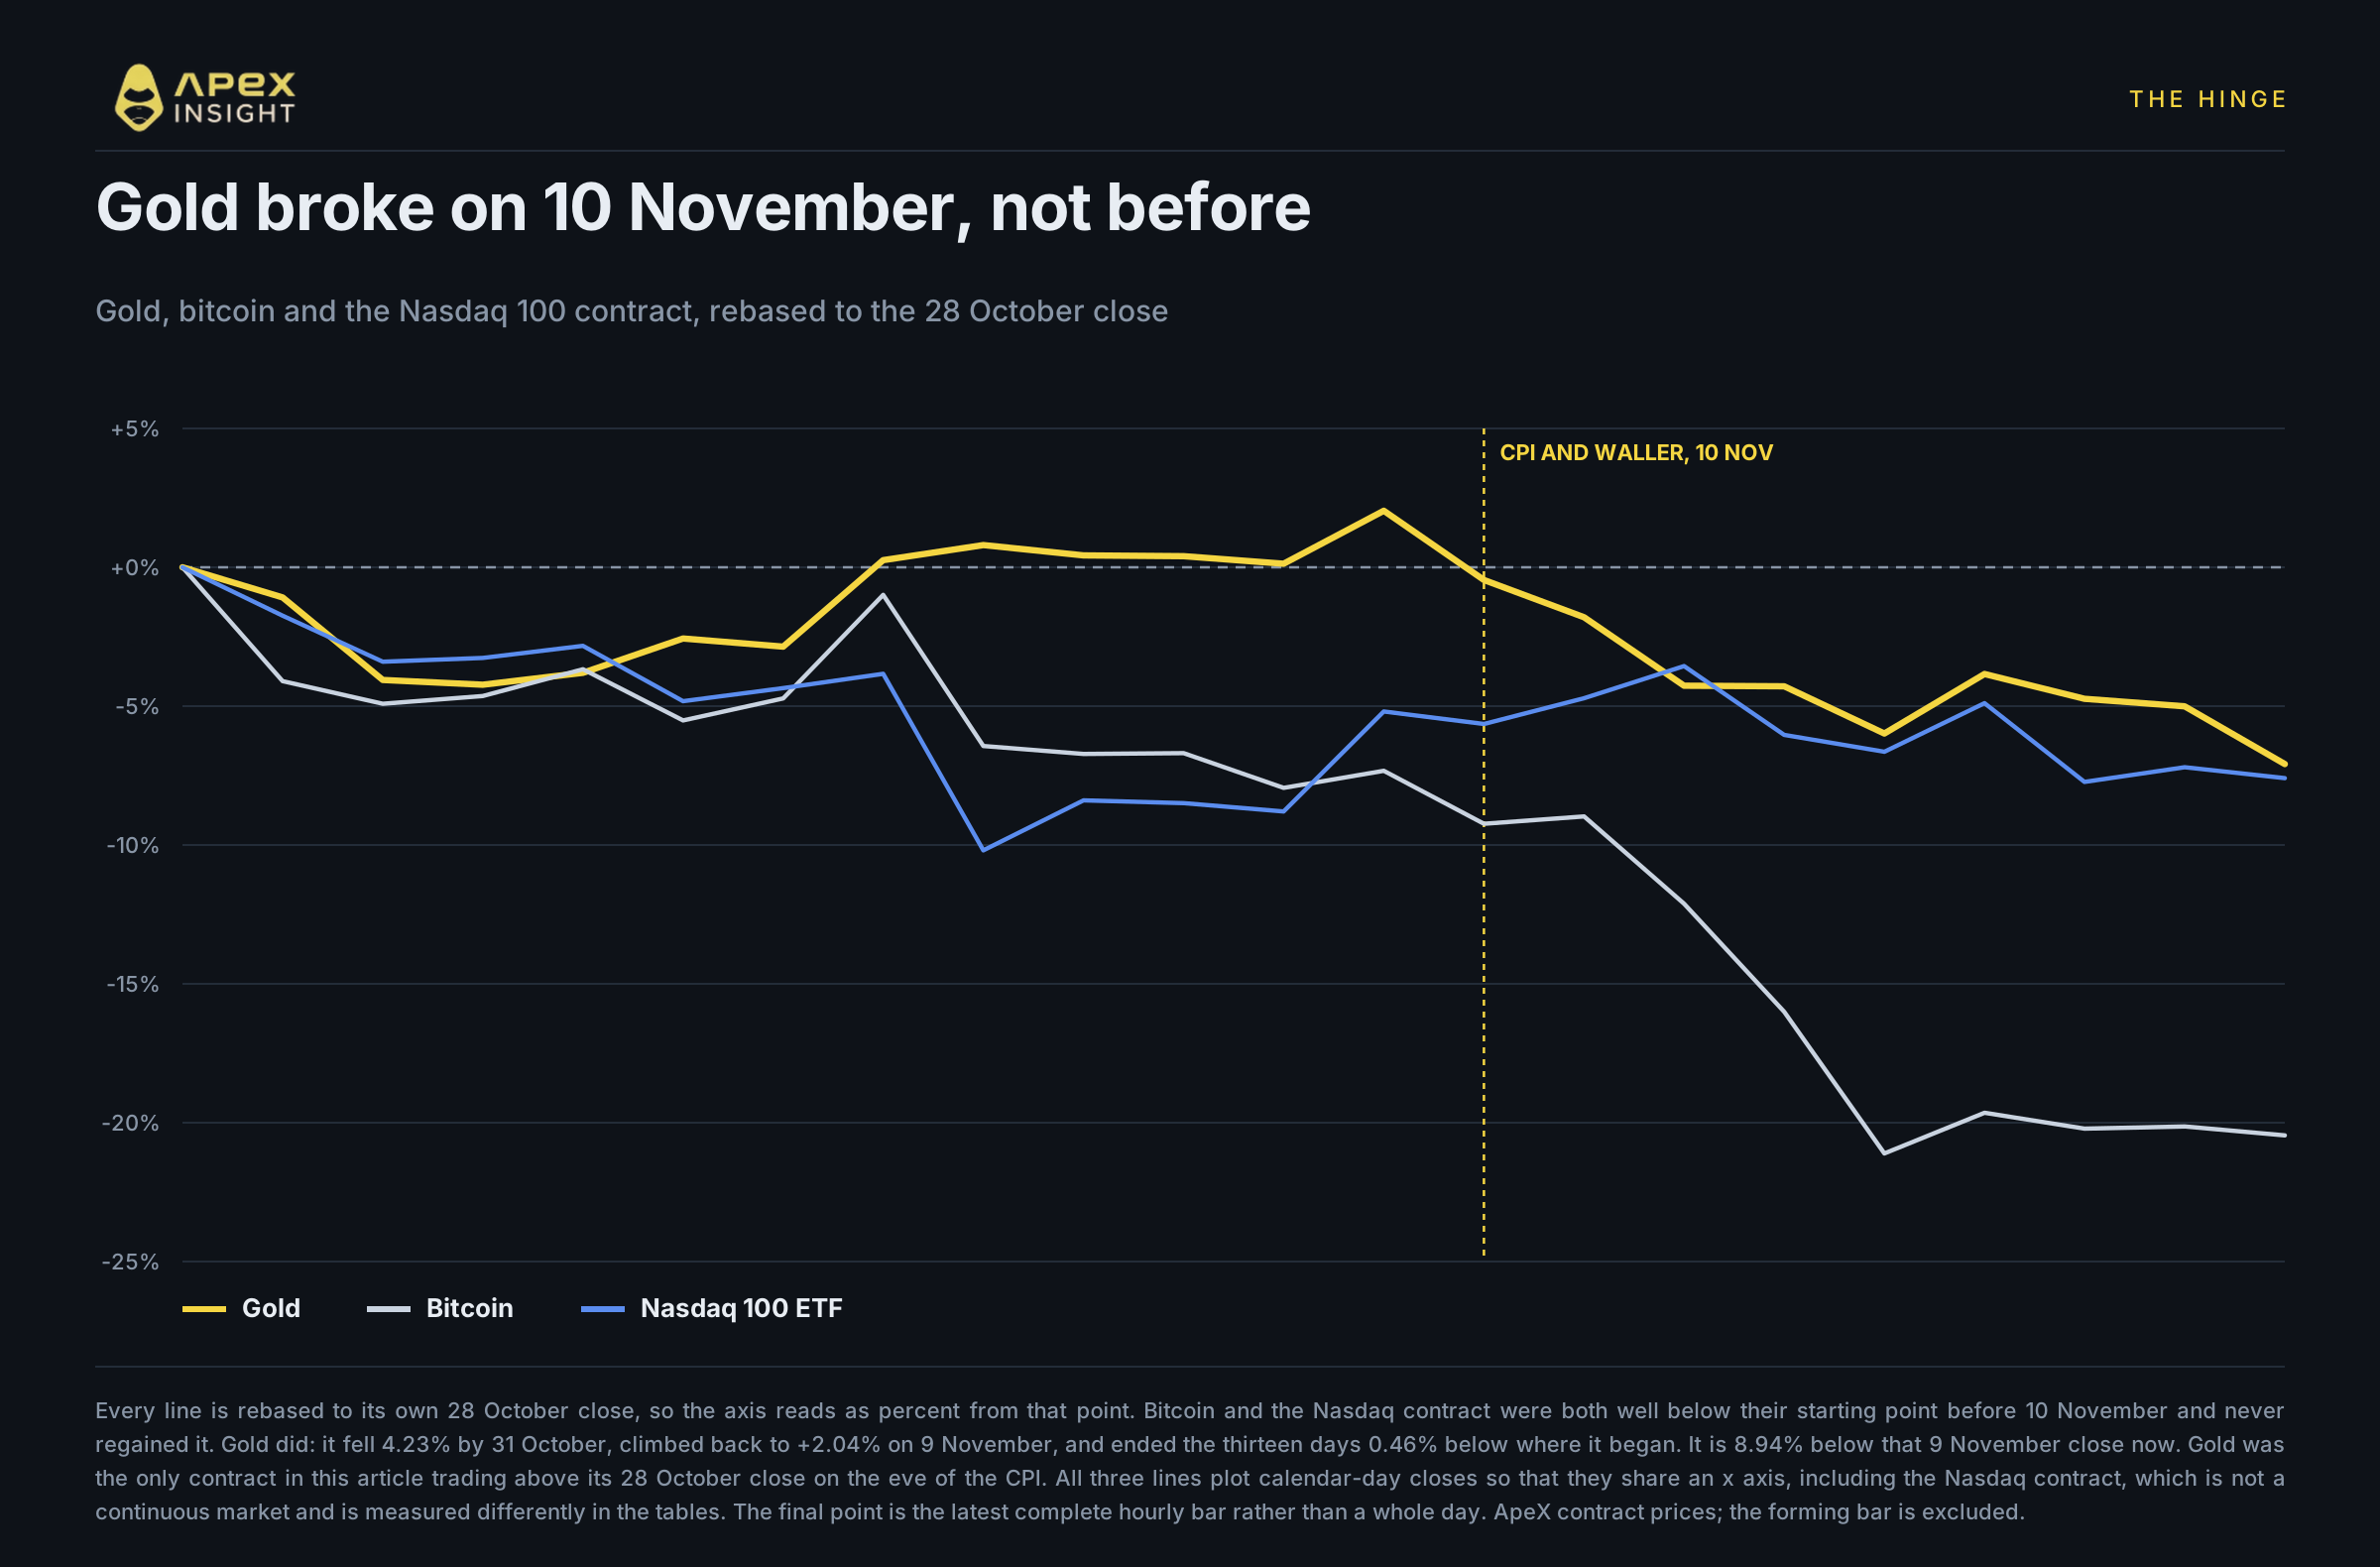
The daily path makes the timing exact, and it is sharper than the fortnight total suggests.
Gold did not simply drift sideways. It fell 4.23% by 31 October, climbed all the way back, and by the close of 9 November was 2.04% above where it stood when the committee held. On the eve of the CPI it was the only contract in this article trading above its 28 October close. Everything else was below the line that day, and only ether had been above it at all, briefly, on 4 November.
From that 9 November close, gold is down 8.94%.
So the honest version of the headline is not that gold has been falling for three weeks. Gold was winning this period as late as the evening of 9 November. What happened next happened in nine days, and it started on a day with two events on it.
A line was drawn before breakfast and crossed before lunch
On the morning of 10 November, Fed Governor Christopher Waller spoke at the Bank of England Watchers' Conference in London, hours before the October CPI was due. He said he would support a quarter-point rise in December even if inflation improved. Then he set a threshold. If core CPI came in around 0.3 percent or even higher, he said, "a 50 basis point hike in the policy rate should be considered at the December meeting," adding that "hiking only 25 basis points would put our credibility at risk."
At 8:30 in New York, core CPI printed at exactly 0.3%, the third month running at that pace, with the headline at 0.4% against the 0.3% economists expected.
A governor named the number that would put a half-point on the table, and within a few hours the data printed that number. Four days earlier, payrolls had come in at 165,000, much better than expected, with unemployment at 4.1%. The labour market was not giving the committee a reason to wait either.
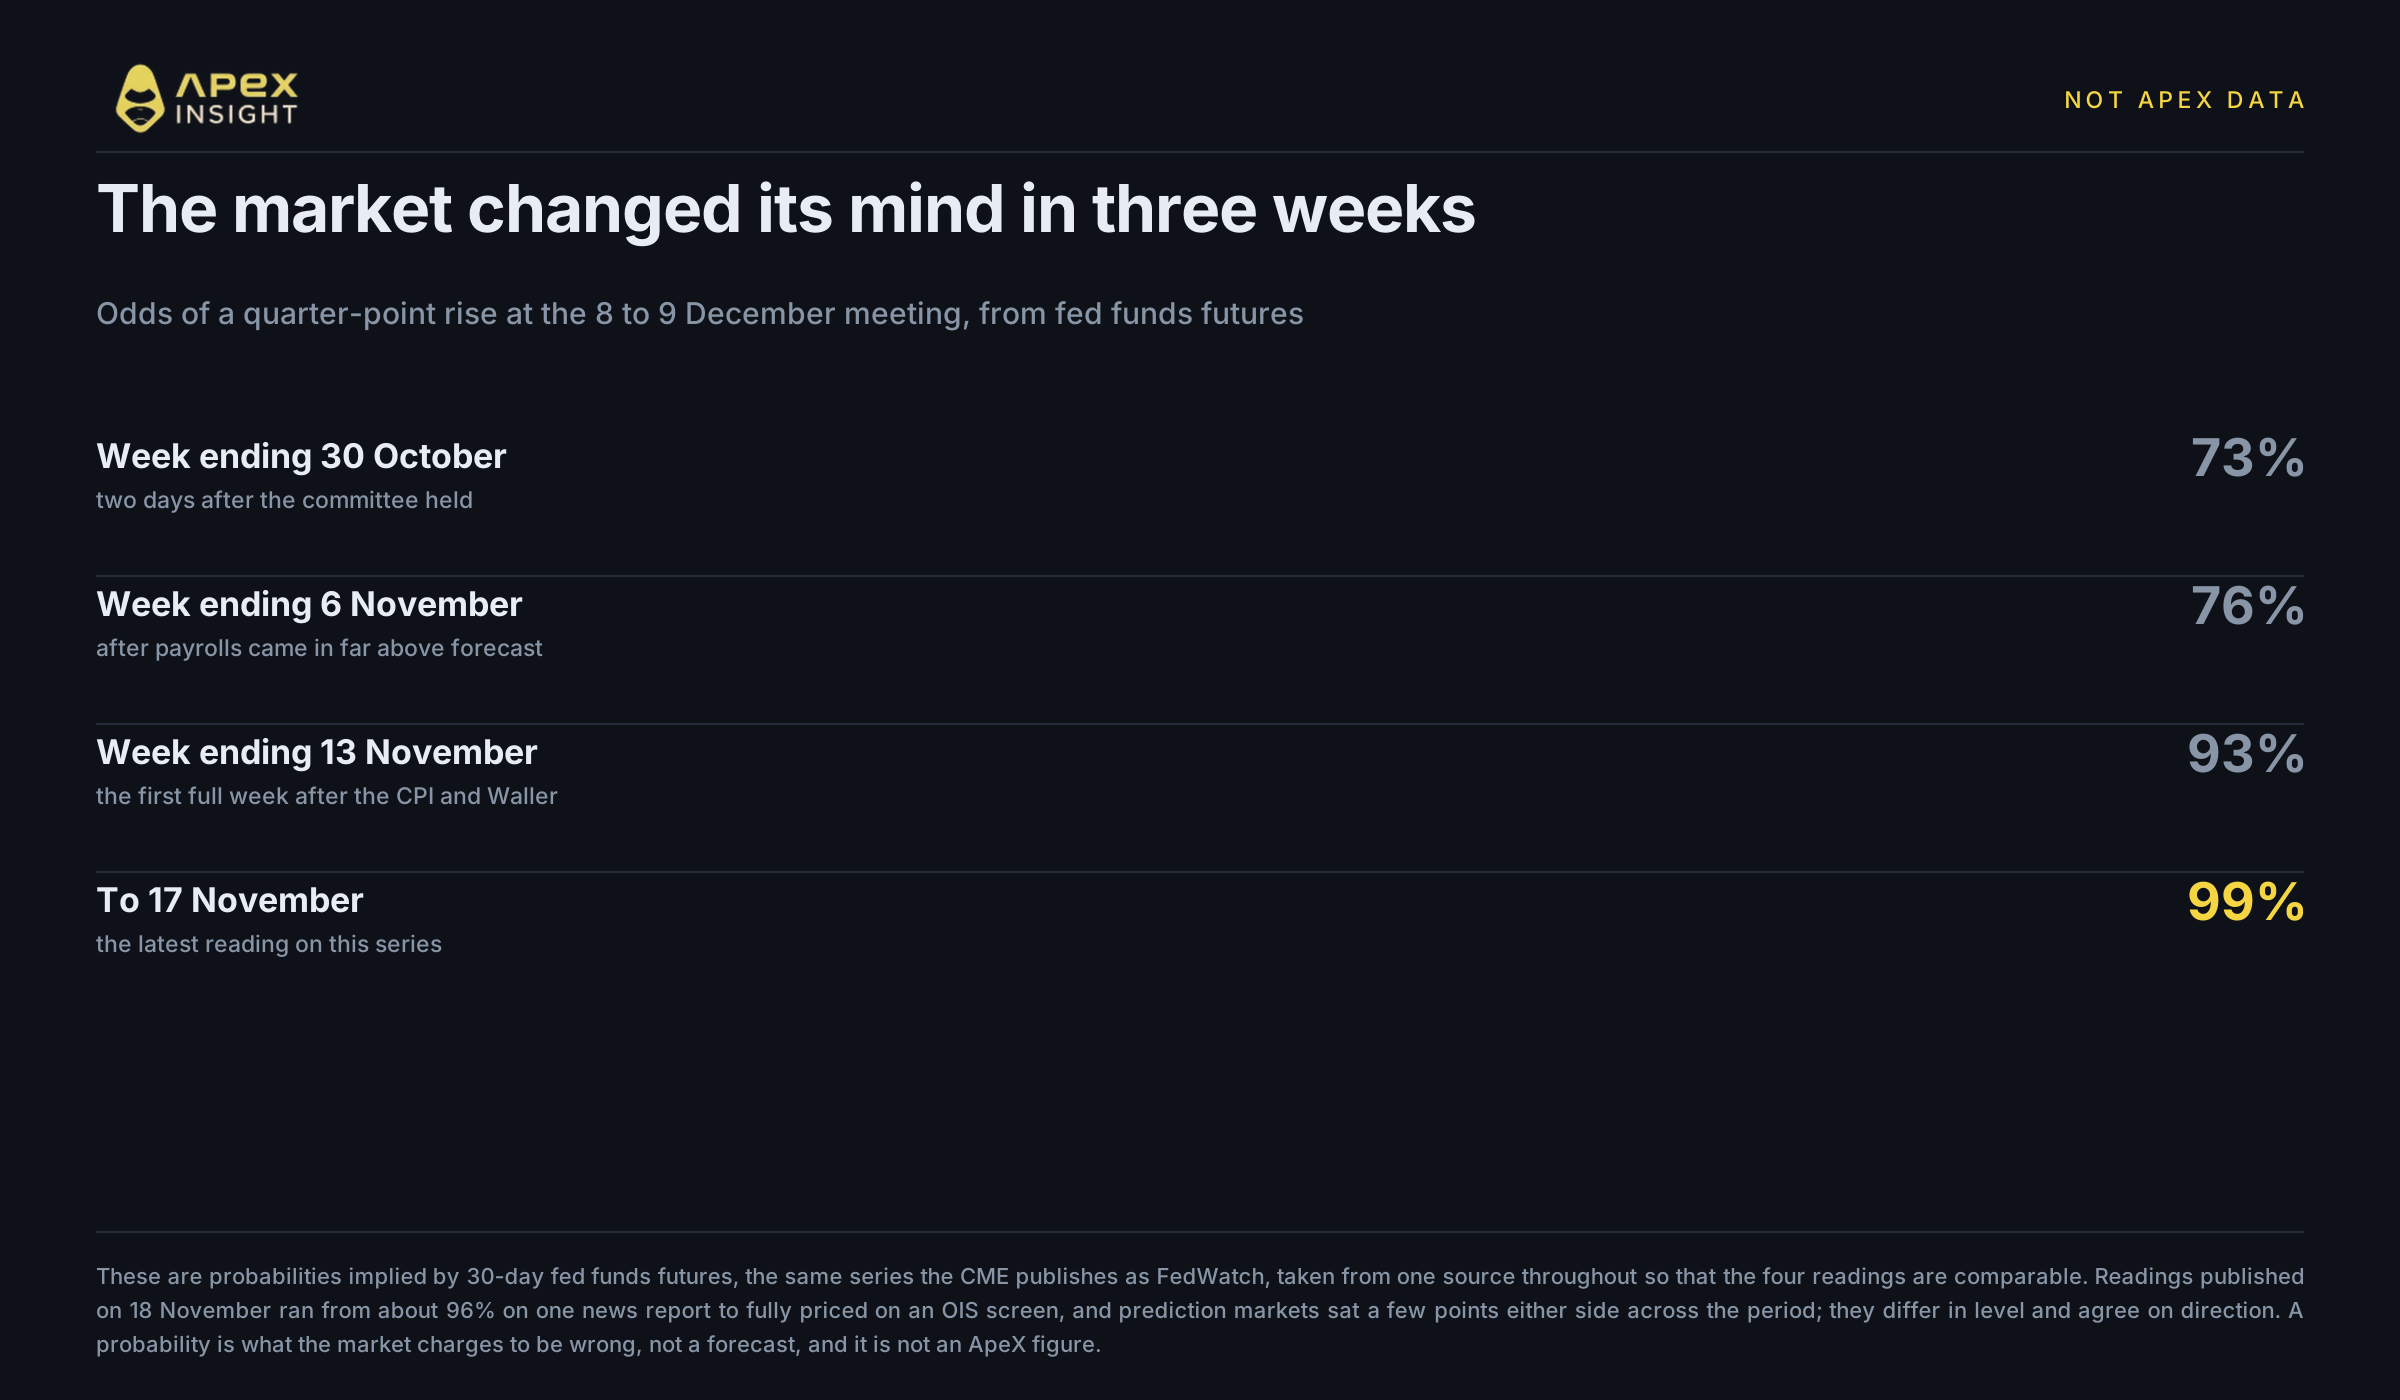
The repricing shows up cleanly in futures. Odds of a quarter-point rise in December ran at 73% in the week to 30 October and 76% in the week to 6 November. In the first full week after the CPI they were 93%, and by 17 November 99%. Readings published on 18 November ran from about 96% to fully priced depending on the venue and the instrument; they differ in level and agree on direction.
One detail is worth keeping in view. The October CPI carried no twelve-month rate at all, because the previous year's government shutdown meant October 2025 prices were never collected. And the November CPI is not published until 10 December, after the meeting ends. The committee is tightening into a data set with a hole in it, and the October print was the last one it will see.
Rates and risk do different damage, and gold can tell them apart
Gold pays nothing. That is the whole of it. Its competition is the real yield on a government bond, so when the expected path of the policy rate rises and long yields rise with it, the cost of holding an asset that produces no income goes up. Over this window the ten-year yield pushed back above 5% and the dollar index reached a nineteen-month high. Both make gold worse to own in a way that has nothing to do with fear.
This is why the sequence is worth more than the totals. Risk aversion and rising rates both push equities and crypto down, so in the first half of the window you cannot tell them apart from those contracts alone. Gold separates them. Rising fear should support it. Rising real yields should not. For thirteen days gold behaved as though the first force was dominant, and it held. From 10 November it behaved as though the second had taken over.
The caution worth stating plainly: this is a pattern consistent with a rates repricing, not proof of one. A week is a short sample, three weeks is not much longer, and gold at a one-year low has plenty of other things going on, including a stronger dollar that is itself partly a rates story. What can be said is narrower and still useful. The explanation has to account for gold rising into 9 November and falling hard afterwards, and "everyone got scared" does not.
The minutes tonight describe the meeting before all of this
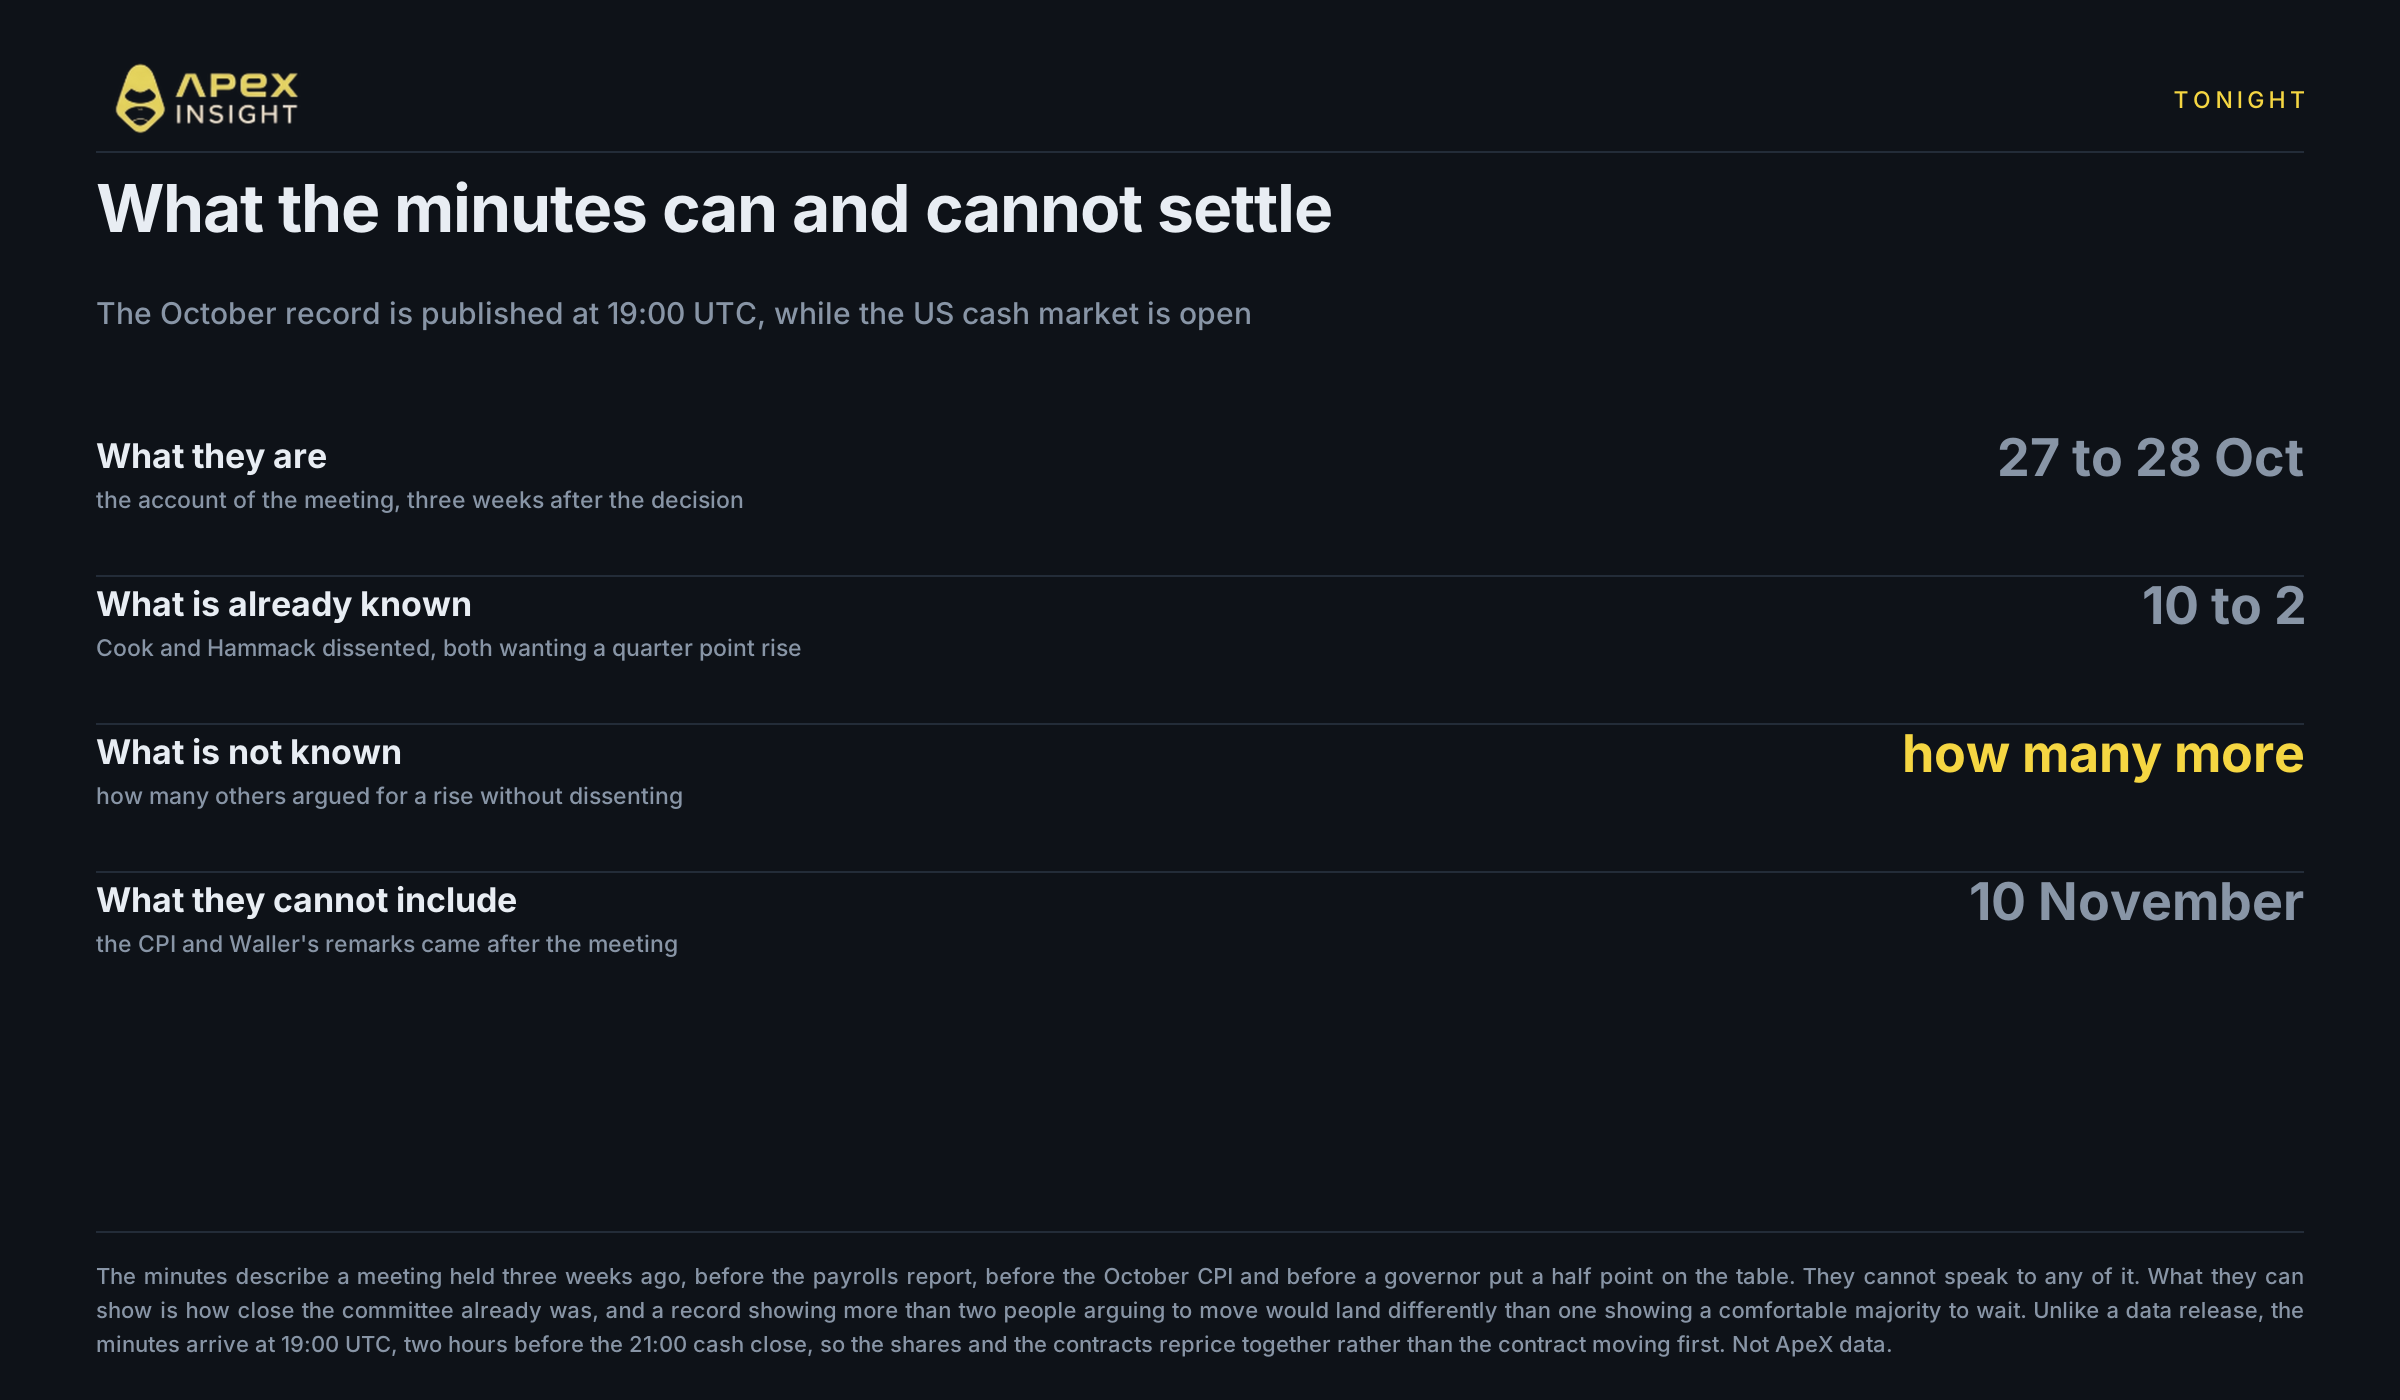
The record of the 27 to 28 October meeting is published at 19:00 UTC today, three weeks after the decision, which is the committee's standard interval.
It is worth being clear about what that document can and cannot do. It describes a meeting held before the payrolls report, before the October CPI and before Waller put a half-point on the table. None of that is in it. What is in it is the argument behind a 10 to 2 vote, and the useful question is how close the rest of the committee was to the two who dissented. A record showing several more participants pressing to move, without formally dissenting, reads very differently from one showing a comfortable majority content to wait.
There is also a mechanical point specific to how this trades. Minutes land at 19:00 UTC, two hours before the 21:00 cash close, so the shares and the contracts reprice together. That is unlike a data release at 13:30 UTC, which the TradFi perp prices a full hour before the underlying can open, and unlike an earnings release after the close, which the contract carries alone overnight. Tonight there is no gap to arbitrage. Everything moves at once.
Futures now price a December rise as close to certain, which is a price rather than a verdict. Bank of America has called the October pause a mistake and now treats a December rise as all but locked in, with a rising risk that the next one comes in January rather than March. The decision itself comes on 9 December, with fresh projections attached, and those projections will say more about 2027 than tonight's minutes can say about October.
What to watch tonight
The minutes cannot change what the committee did in October. What they can change is the market's read on how close the other ten were to the two who dissented, and that read feeds the expected path of the policy rate, which is the thing gold has been answering to since 10 November. That is the channel. It is narrower than "the Fed sounded hawkish and gold fell", and it is the reason the evidence above had to come first.
Two conditionals, and they are conditionals rather than forecasts. A record showing several more participants pressing to raise without formally dissenting would push that expected path up, and on the evidence here gold is currently the contract most exposed to it. A record reading softer than the 10 to 2 vote implies would do the reverse.
The asymmetry is the part worth holding on to. A December rise is already priced at or near certainty, so a hawkish record has very little room left to move the December number and would have to work through January and the path beyond it instead. A softer record has more room, because there is almost nothing in the price for it to unwind. That is a statement about where the capacity to surprise sits, not about which way it will go, and anyone who tells you they know the second thing is guessing.
Everything below trades 24/7 on ApeX, which matters tonight only in the sense that the move will not stop when the cash market does.
The one that changed behaviour. XAU-USDT is 7.09% below the 28 October close and 8.94% below its 9 November close. The second figure is the one that describes what actually happened. If the minutes read more hawkish than the vote already implies, this is the contract where it should show first, because it has the cleanest link to the real yield.
The one that amplifies it. XAG-USDT is down 15.16%, more than twice gold, and fell 11.24% in the second half alone. Silver carries the same rate sensitivity as gold plus an industrial demand cycle, which is why it moves further in both directions and why it is the wrong instrument for a pure view on rates.
The one everybody watches. BTC-USDT is down 20.46% and, unlike gold, was falling from the first day. It has been the more sensitive of the two to the liquidity story all along, and it did not need the CPI to tell it.
Trade the move on ApeX
Crypto perpetuals up to 100x and TradFi up to 50x, trading 24/7 including overnight.
Trading carries a high risk of loss, and leverage increases both gains and losses. Gold falling 8.94% in nine days after a fortnight of holding its ground is a reminder that an asset behaving defensively is not the same as an asset that cannot fall, and that a position sized for the first assumption is the one that gets hurt by the second. This is not financial advice and none of it is a recommendation to buy or sell anything. Do your own research and size positions you can afford to lose.
If you need any help, feel free to reach out to our team on Discord.
Website: https://www.apex.exchange
Twitter: https://twitter.com/OfficialApeXdex
Telegram: https://t.me/ApeXdex
Methodology. Contract figures are from the ApeX Omni v3 API, built on 18 November 2026. This article uses two measurement conventions and they are not interchangeable. Gold, silver, bitcoin, ether and solana are continuous markets with no cash session, so they are measured on the calendar day to the bar stamped 23:00, which closes at 00:00. The equity and ETF contracts are anchored on the US cash close; because hourly bars are start-stamped, that close is taken from the bar an hour earlier. The two halves of the window run cash close to cash close, but any figure carried to the present runs to the latest complete hourly bar, which is not itself a cash close. US daylight saving ended on 1 November 2026, so the 28 October cash close is 20:00 UTC and every later one is 21:00 UTC, and this window straddles that boundary. The bar currently forming is always excluded, because a figure measured into an open bar changes on every read and cannot be reproduced afterwards. The rebased chart plots calendar-day closes for all three of its lines so that they share an x axis, which is deliberately not the convention used in the tables, and its final point is the latest complete hourly bar rather than a whole day. The two window halves are split at the 10 November close, a date chosen because the CPI and Waller's remarks both fell on it and not because of how any contract behaved. The FOMC decision and vote, the CPI and payrolls data, Waller's remarks, the futures-implied odds and the Treasury and dollar levels are not ApeX data and are hyperlinked at each claim; the futures odds are taken from one source throughout so the four readings are comparable, and readings published elsewhere on 18 November ran from about 96% to fully priced. Figures are as at the bar stamped 08:00 UTC on 18 November 2026. Nothing here is financial advice.