



Published 13 November 2026
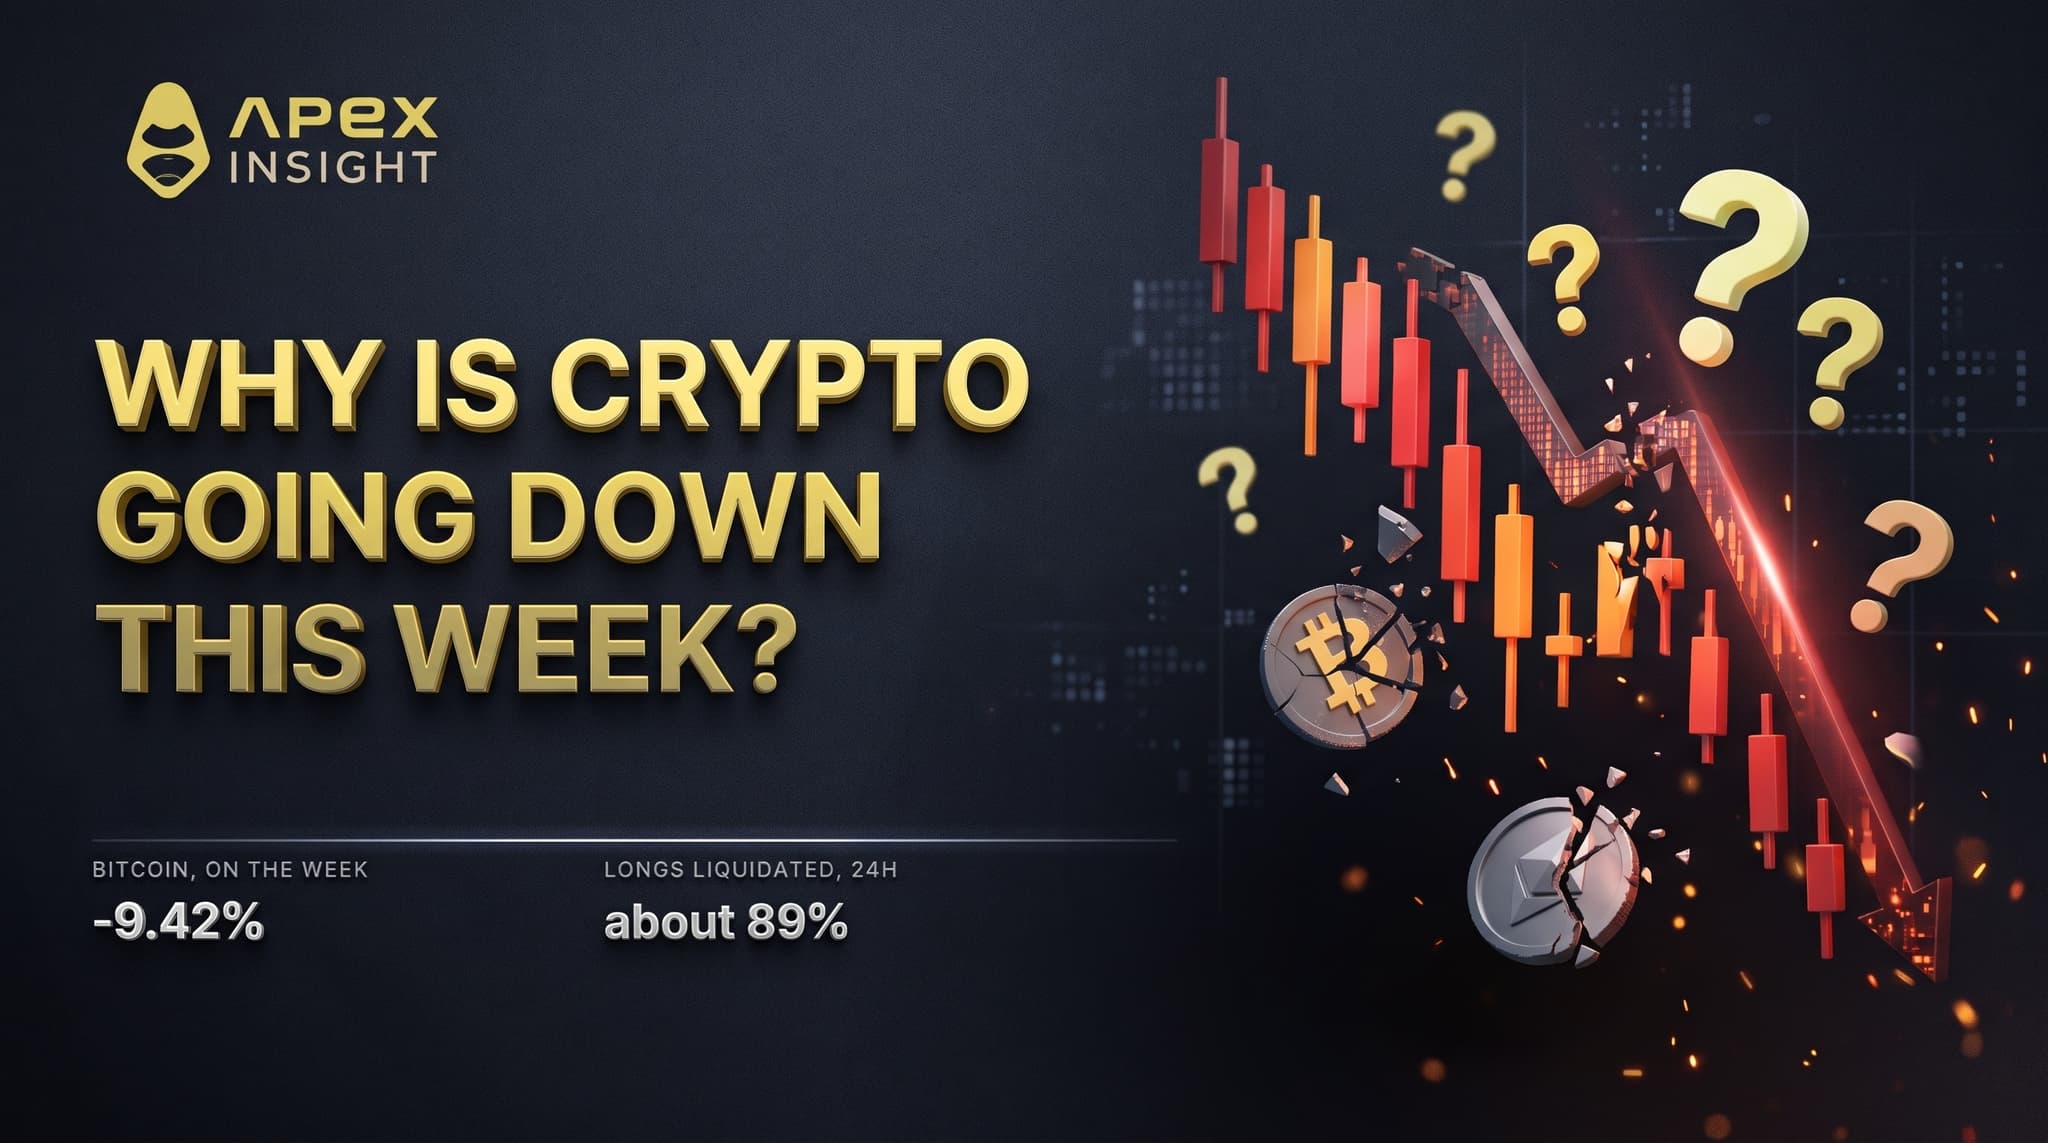
Bitcoin traded below $69,000 in the early hours of Friday, its weakest level since 19 August. On the ApeX contract it is down 9.42% on the week. Ether is down 13.66% and solana 11.56%.
No exchange failed. No protocol broke. No government banned anything.
What happened instead is duller and more useful to understand: a lot of borrowed money was forced to sell at once, into a market where the dollar was rising and the largest buyers had stopped buying. That combination explains most of it.
Here is each piece, measured.
Written on 13 November 2026 while the move was still running. Every contract figure is measured to the bar stamped 08:00 UTC, the last one to have closed; the hour in progress is excluded, because a bar that is still forming gives a different answer every time it is read.
1. How far it actually fell
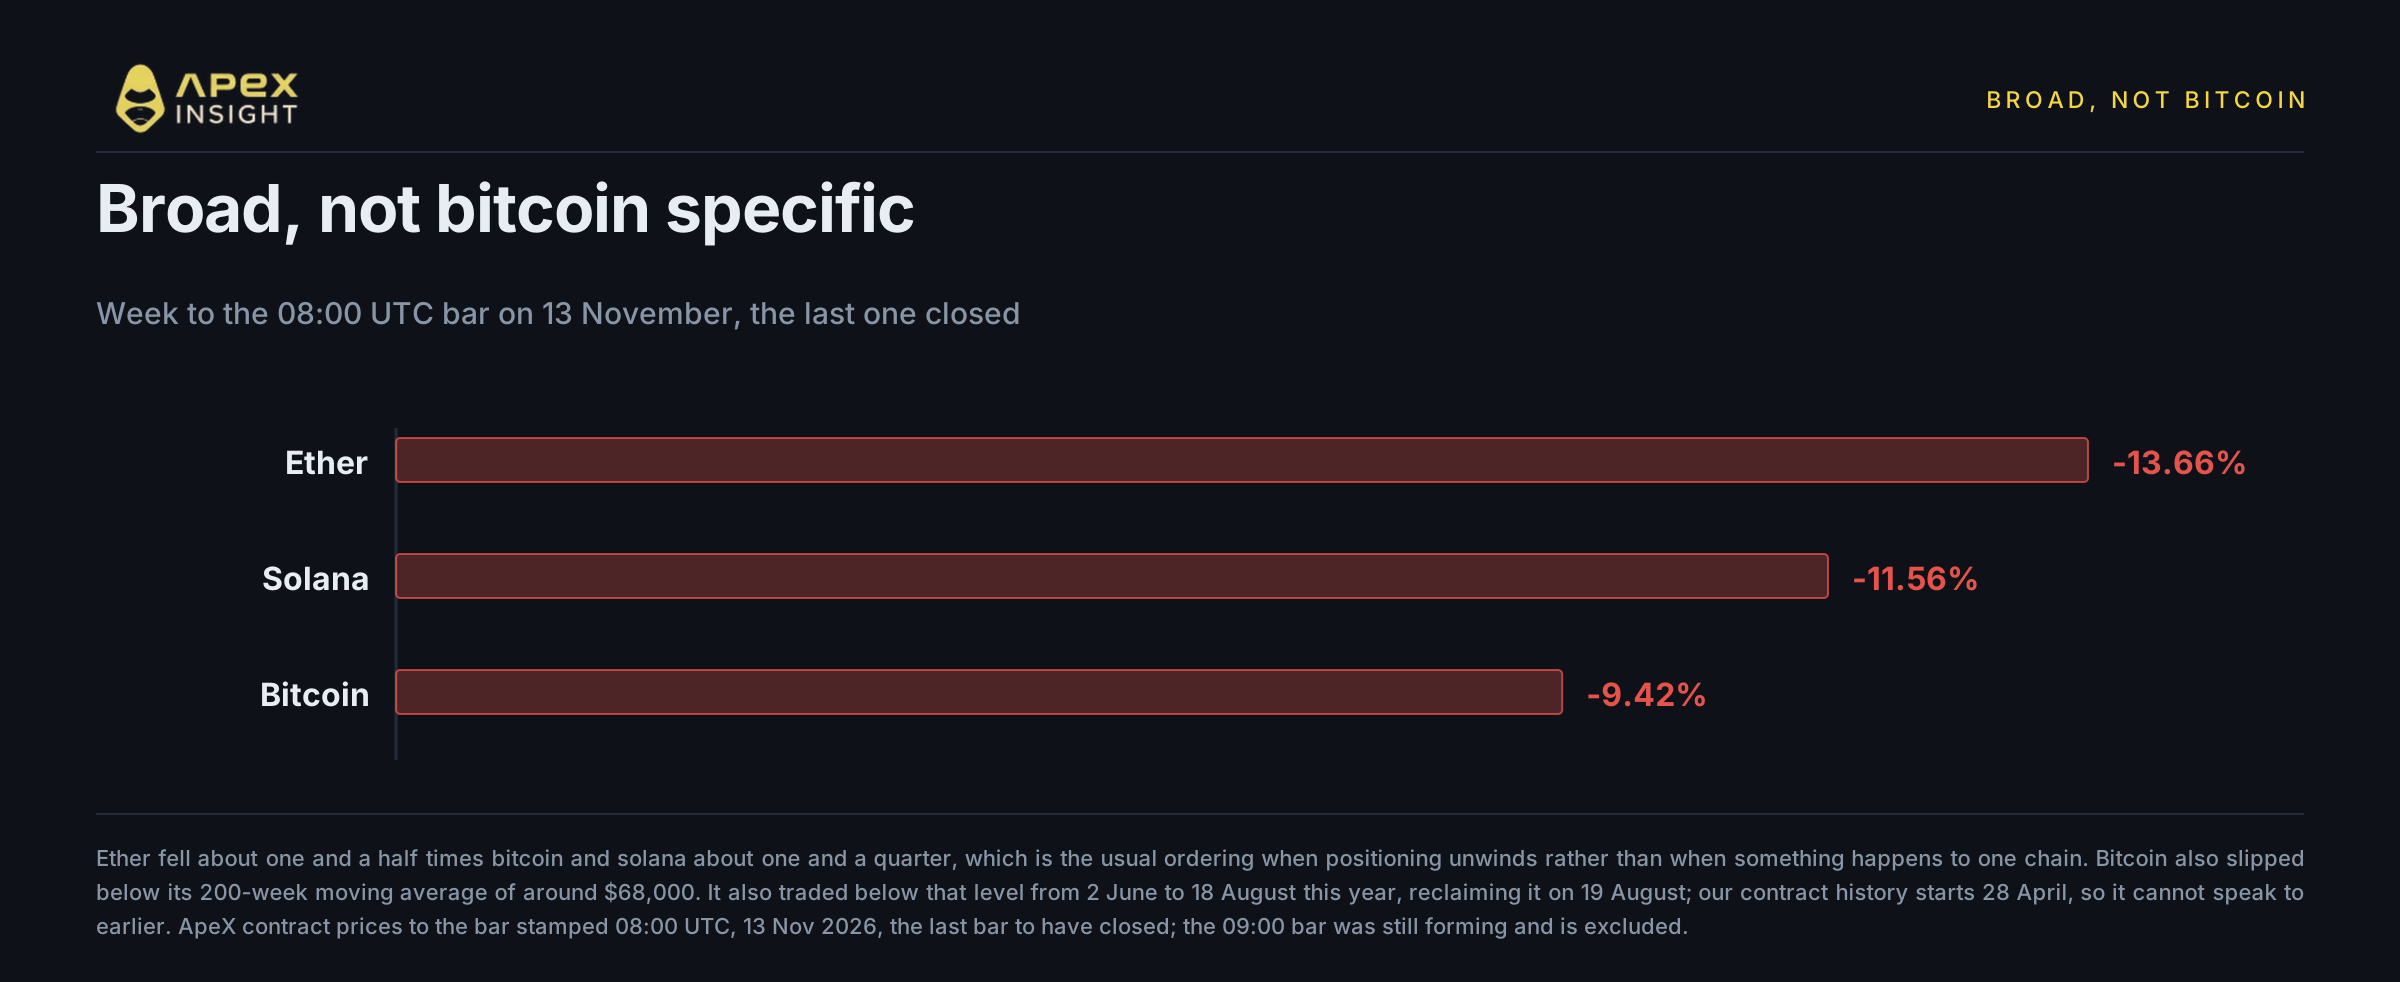
The first thing to establish is whether this is a bitcoin story or a crypto story. It is a crypto story.
Contract | Week | Below 200-day high |
|---|---|---|
-13.66% | -31.15% | |
-11.56% | -36.19% | |
-9.42% | -21.38% |
Ether lost $2,000 along the way: it closed 12 November at 2,019.00 and was at 1,931.73 by the 08:00 UTC bar on the 13th. Ether fell about one and a half times bitcoin and solana about one and a quarter. That ordering is the normal one in a risk selloff: the further out the risk curve an asset sits, the harder it is hit when positioning unwinds. Nothing in it is specific to any one chain.
The level matters too. Bitcoin slipped below its 200-week moving average of around $68,000, which it also traded below from 2 June to 18 August this year, reclaiming it on 19 August; our contract history begins on 28 April, so it cannot speak to any crossing before that. It is also trading well under its 200-day average of roughly $73,000. Those are not predictions, they are just the levels a lot of systematic money watches, and crossing them tends to add supply rather than remove it.
2. Most of the overnight move happened in two hours
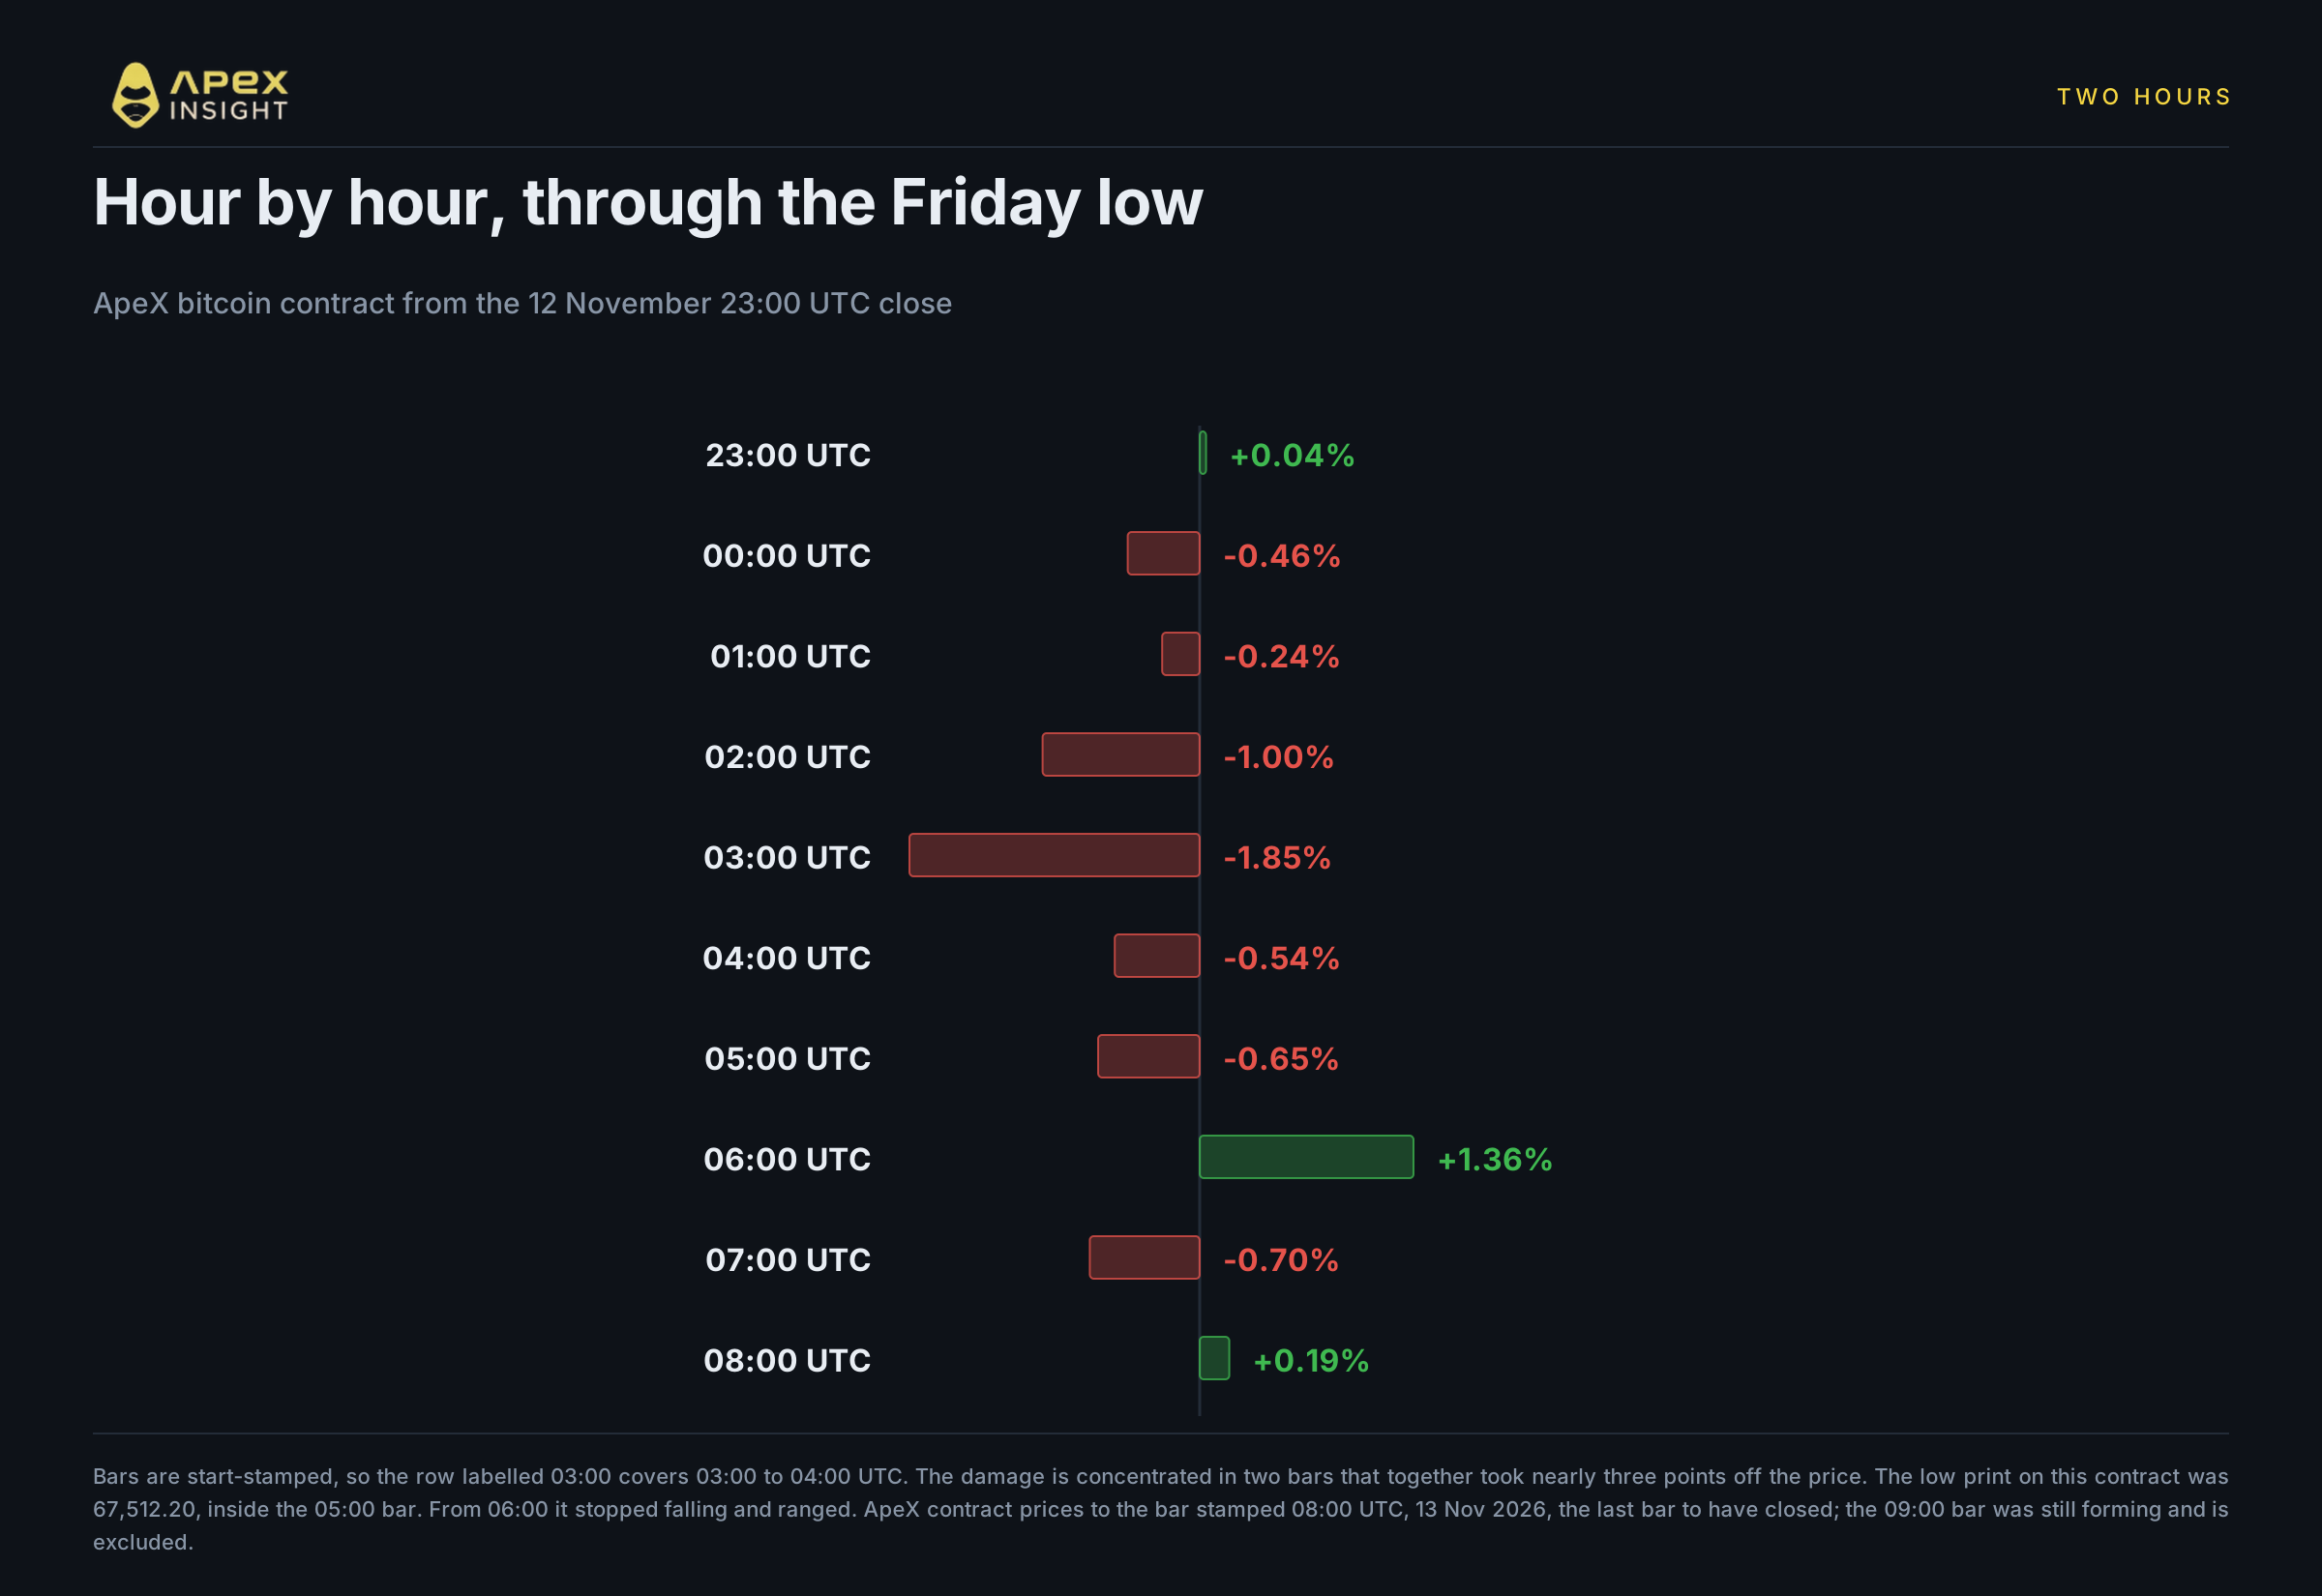
Crypto trades continuously, which means you can watch a selloff happen rather than arrive at a closing price and guess. Here is the ApeX bitcoin contract hour by hour from the Thursday 23:00 UTC close.
Hour, UTC | Close | Move |
|---|---|---|
23:00 | 71,443.10 | +0.04% |
00:00 | 71,115.60 | -0.46% |
01:00 | 70,945.20 | -0.24% |
02:00 | 70,234.70 | -1.00% |
03:00 | 68,934.90 | -1.85% |
04:00 | 68,561.40 | -0.54% |
05:00 | 68,117.50 | -0.65% |
06:00 | 69,045.80 | +1.36% |
07:00 | 68,561.90 | -0.70% |
08:00 | 68,690.90 | +0.19% |
The damage is concentrated in the bars stamped 02:00 and 03:00, which together took nearly three points off the price. The low print on our contract was 67,512.20, inside the 05:00 bar. From 06:00 the contract stopped falling and started chopping in a range, which is the same shape the Nvidia contract made on Wednesday night: information arrives, two hours of repricing, then people wait.
ApeX hourly bars are start-stamped, so the row labelled 03:00 covers 03:00 to 04:00 UTC.
3. What actually sold was leverage
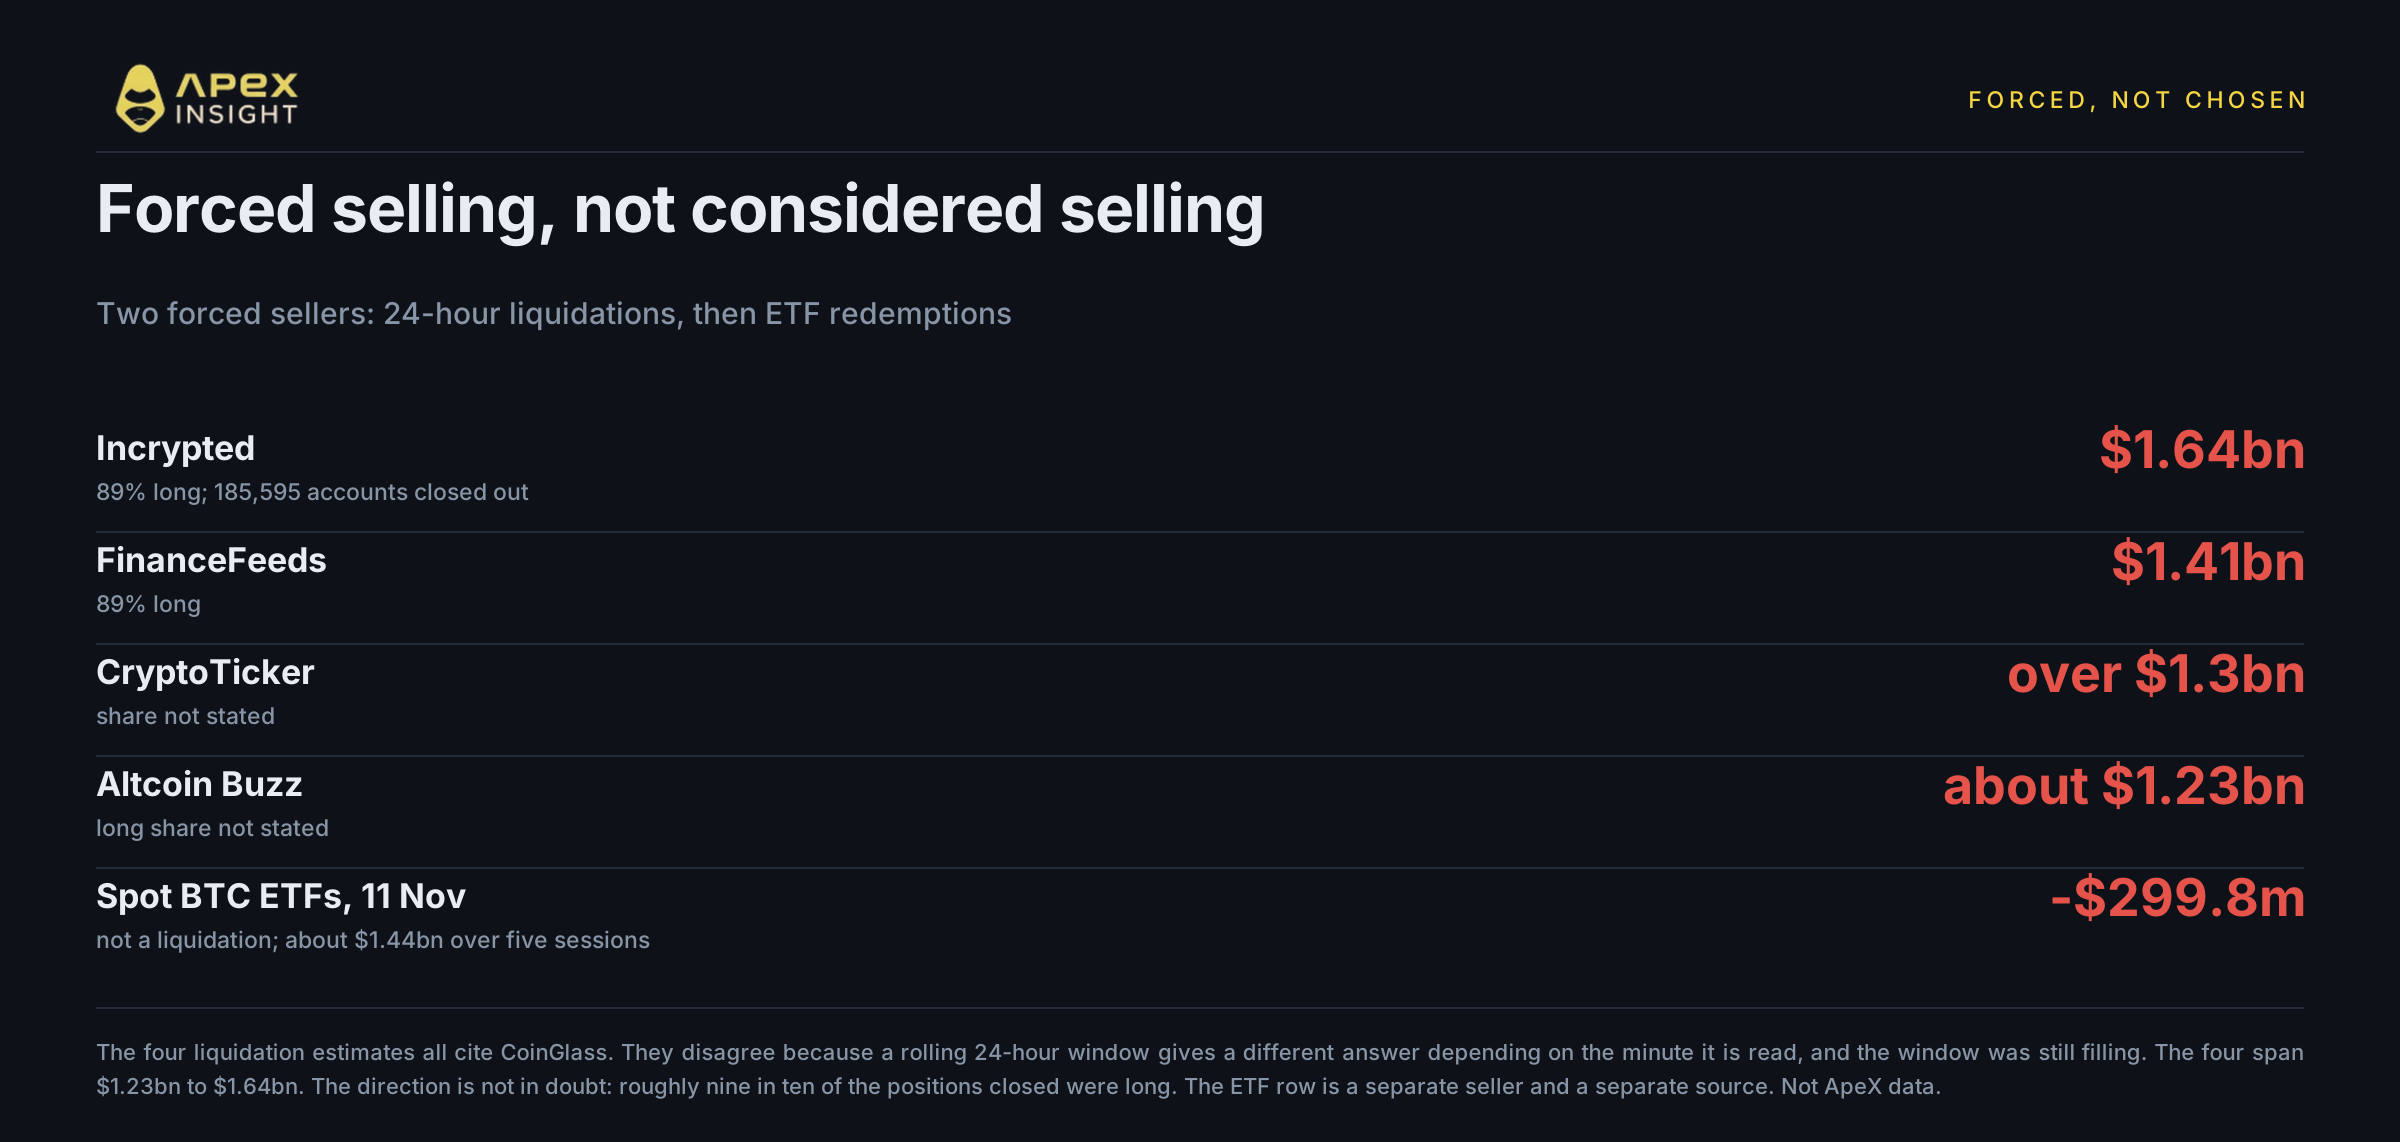
A liquidation is not a decision. When a leveraged position can no longer meet its margin, the exchange closes it at market whether the trader wants out or not. Those forced sales push the price down, which triggers the next set, which is why these moves are fast and then stop.
Estimates of the size vary, and the variation is worth understanding rather than hiding:
Source | 24-hour liquidations | Long share |
|---|---|---|
$1.64bn | 89% | |
$1.41bn | 89% | |
over $1.3bn | not stated | |
about $1.23bn | not stated |
Every one of those cites CoinGlass. They disagree because a rolling 24-hour window gives a different answer depending on the minute you read it, and the window was still filling. The four span $1.23bn to $1.64bn, and the direction is unambiguous: roughly nine out of ten of those positions were long. Incrypted counted 185,595 accounts closed out.
The second seller was the exchange-traded funds. US spot bitcoin ETFs saw $299.8m of outflows on 11 November alone, and about $1.44bn across the five sessions from 5 to 11 November. Those funds were the marginal buyer for much of the past two years, and their 2026 net flows had already turned negative in the week to 6 November. A marginal buyer that turns into a seller changes the price without anyone changing their mind about the technology.
Neither of these is a view about crypto. Both are mechanical.
4. The dollar is the cleanest explanation
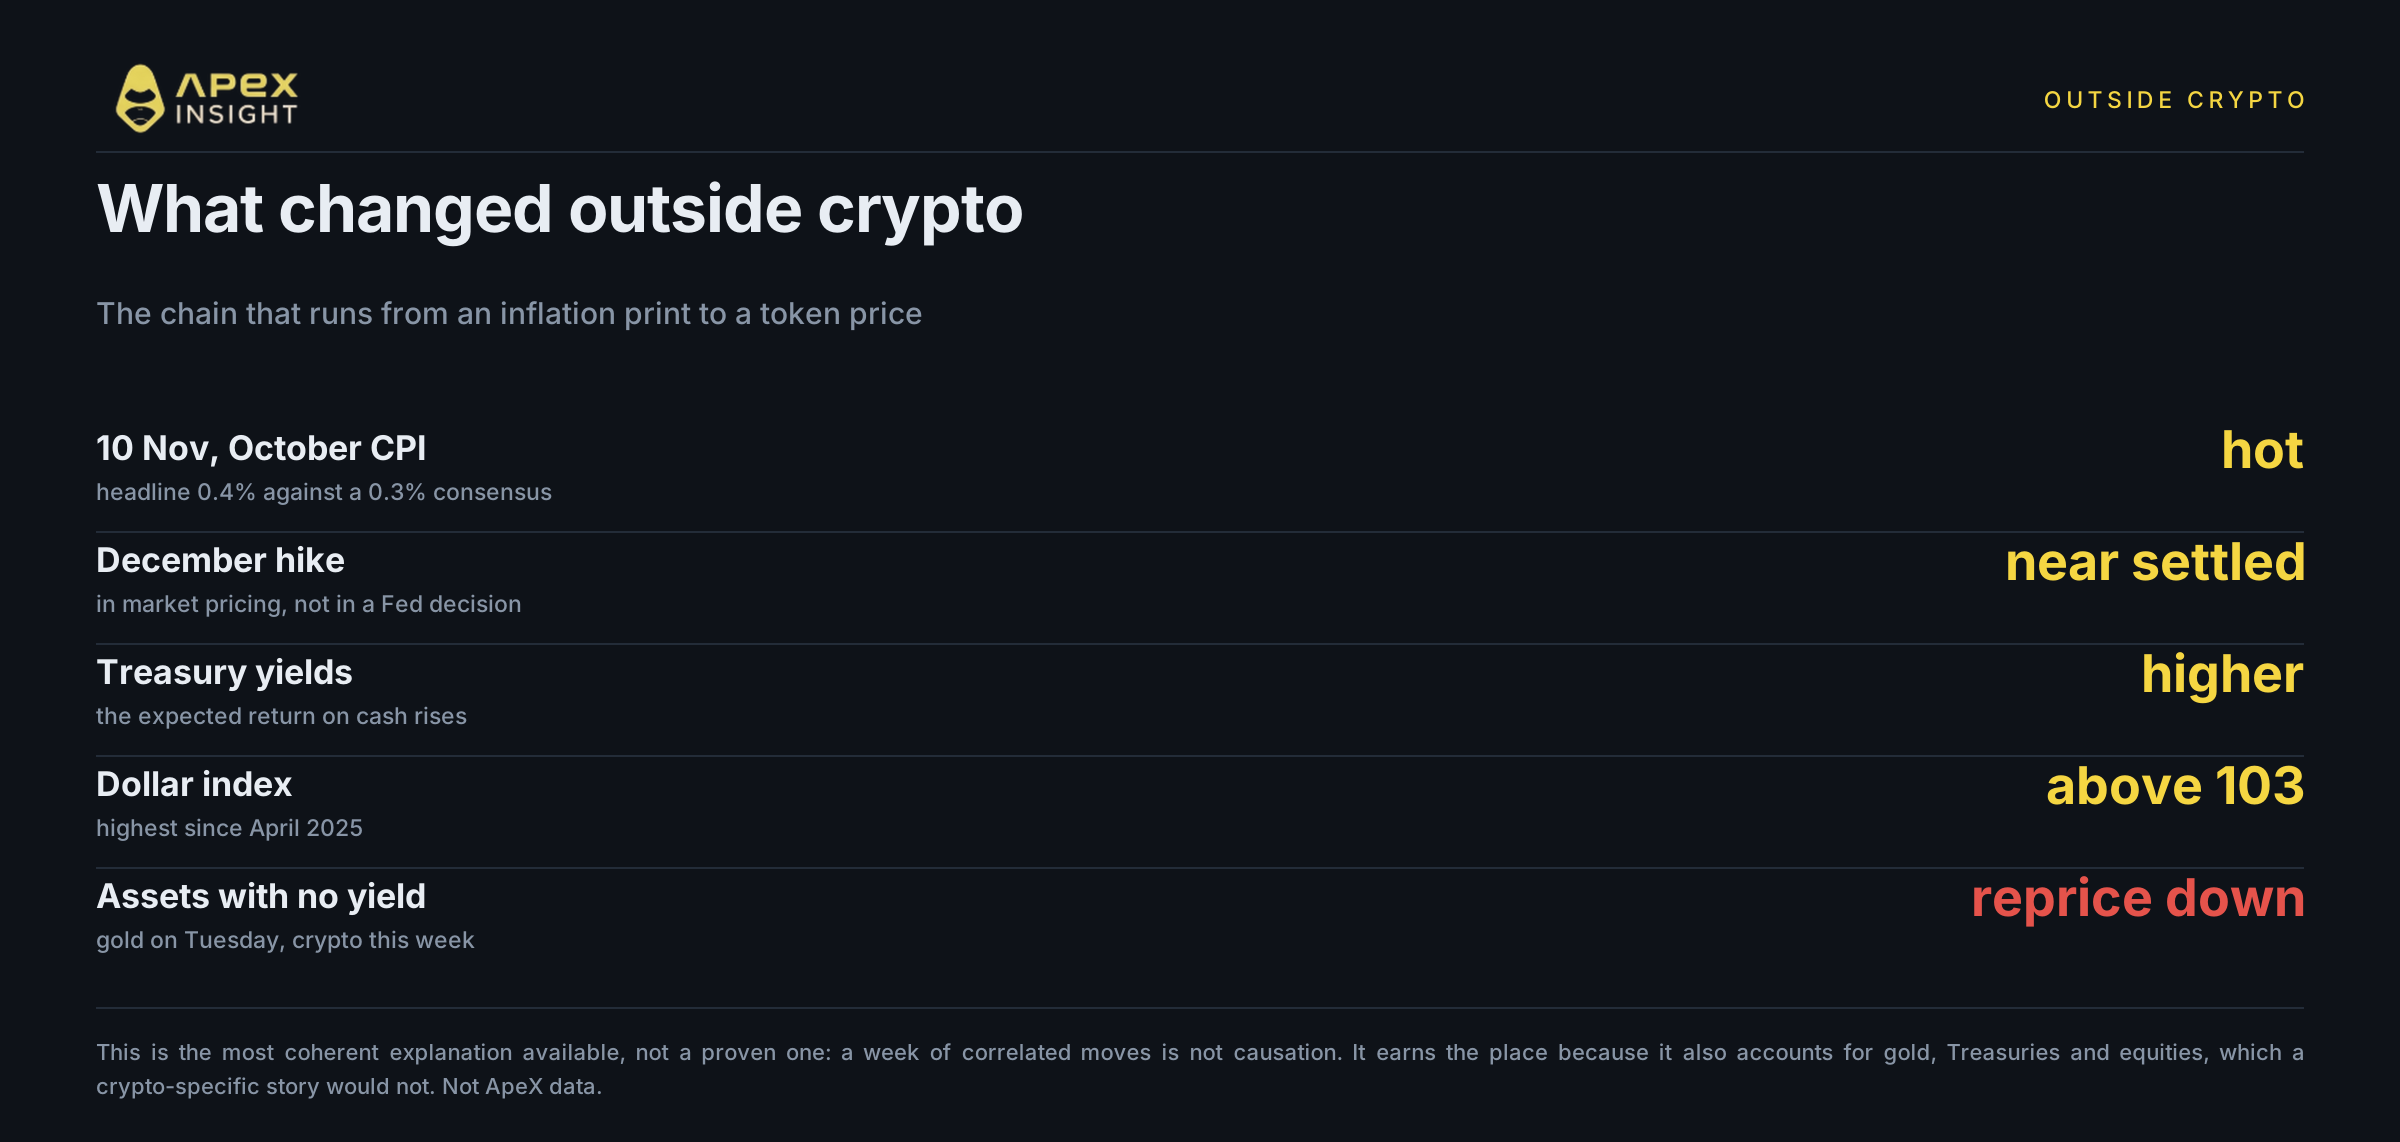
If you want one external number that lines up with this week, it is the dollar.
The US Dollar Index climbed above 103, which is a 19-month high, its strongest since April 2025. A stronger dollar raises the cost of holding anything priced in dollars that pays no yield, which is the entire category bitcoin sits in. We walked through the same mechanism when gold fell on Tuesday's hot inflation print: when the expected real return on cash goes up, assets with no yield reprice down.
The chain runs through the Federal Reserve. October CPI came in hot on 10 November, headline at 0.4% against a 0.3% consensus and core at 0.3% for a third straight month. That took December hike pricing from about 72% a week earlier to 88.8% on a quarter-point move, with the remaining 11.2% on a half point and a hold no longer priced at all, lifted Treasury yields, and lifted the dollar with them. Note what that is and is not: it is where the market sits, not a decision the Fed has taken. Crypto is on the far end of that chain, not the start of it.
The honest caveat: this is a coherent story, not a proven one. The dollar rose and crypto fell in the same window, and the mechanism linking them is well understood, but a week of correlated moves is not causation. What makes it the most coherent explanation available is that it also accounts for gold, for the Treasury move and for the equity weakness, which a crypto-specific story would not.
Nvidia's chief executive also resigned on 12 November, and several outlets listed it among the drivers. We would be careful with that one. It is a reason for weaker risk sentiment in general, but the direct contribution of the technology news to crypto selling has not been established, and the crypto move was already underway on the dollar and the liquidation cascade.
5. Why is WLFI higher on the week?
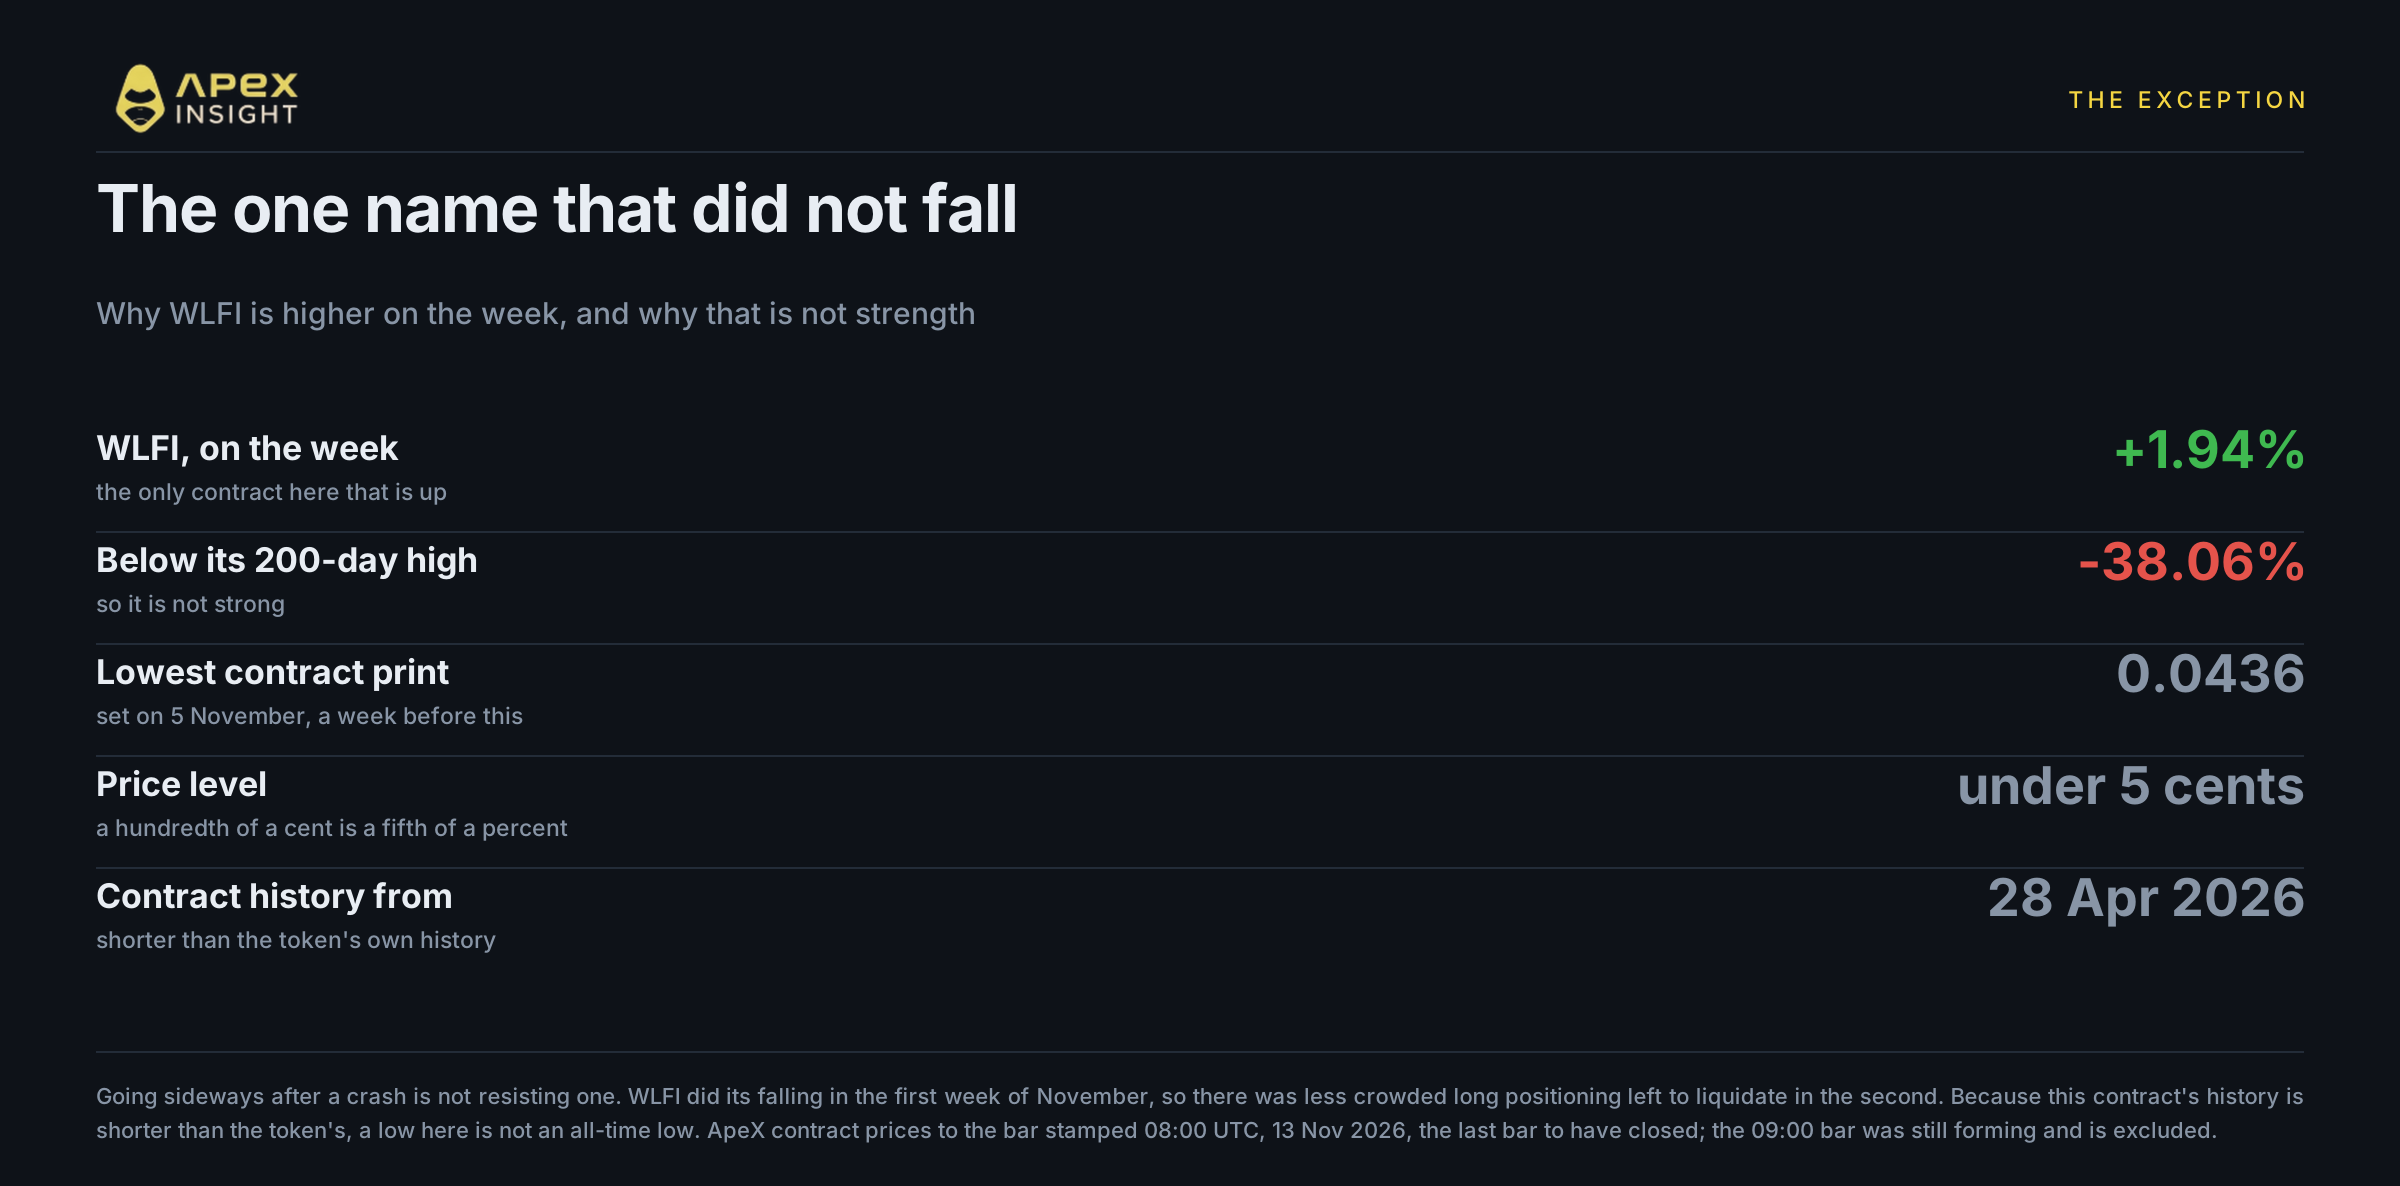
In the set of contracts tracked here, exactly one is up over the week: WLFI, the World Liberty Financial token, at +1.94%.
That needs explaining carefully, because the obvious reading is wrong. WLFI is not strong. It is 38.06% below its own 200-day high and it fell to 0.0436 on 5 November, the lowest print in its contract history. What has happened since is that it has stopped going down: it has traded between roughly 0.046 and 0.049 for a week while bitcoin lost nine points.
Three things to hold in mind before reading anything into that.
First, the base is tiny. At under five cents, a move of a hundredth of a cent is a fifth of a percent, so percentage changes on WLFI are noisier than the same number on bitcoin.
Second, it had already fallen. An asset that dropped hard in the first week of November had less crowded long positioning left to liquidate in the second. Going sideways after a crash is not the same as resisting one.
Third, our contract's history only begins on 28 April 2026, so "lowest in contract history" is not the same as an all-time low. The token launched on 1 September 2025 and traded in the tens of cents in its first days, far above today's mid-four-cent level; aggregators disagree on exactly how high that opening spike went, so we are not putting a drawdown figure on it. Reporting this week has described both WLFI and the TRUMP token at record lows on spot venues. Where a venue's own history is shorter than the asset's, say so rather than implying a record.
What is genuinely notable is only this: the politically exposed corner of crypto did its falling a week before the rest of the market did, and the two moves had different causes.
6. Most of the equities fell less than the asset, the reverse of last week
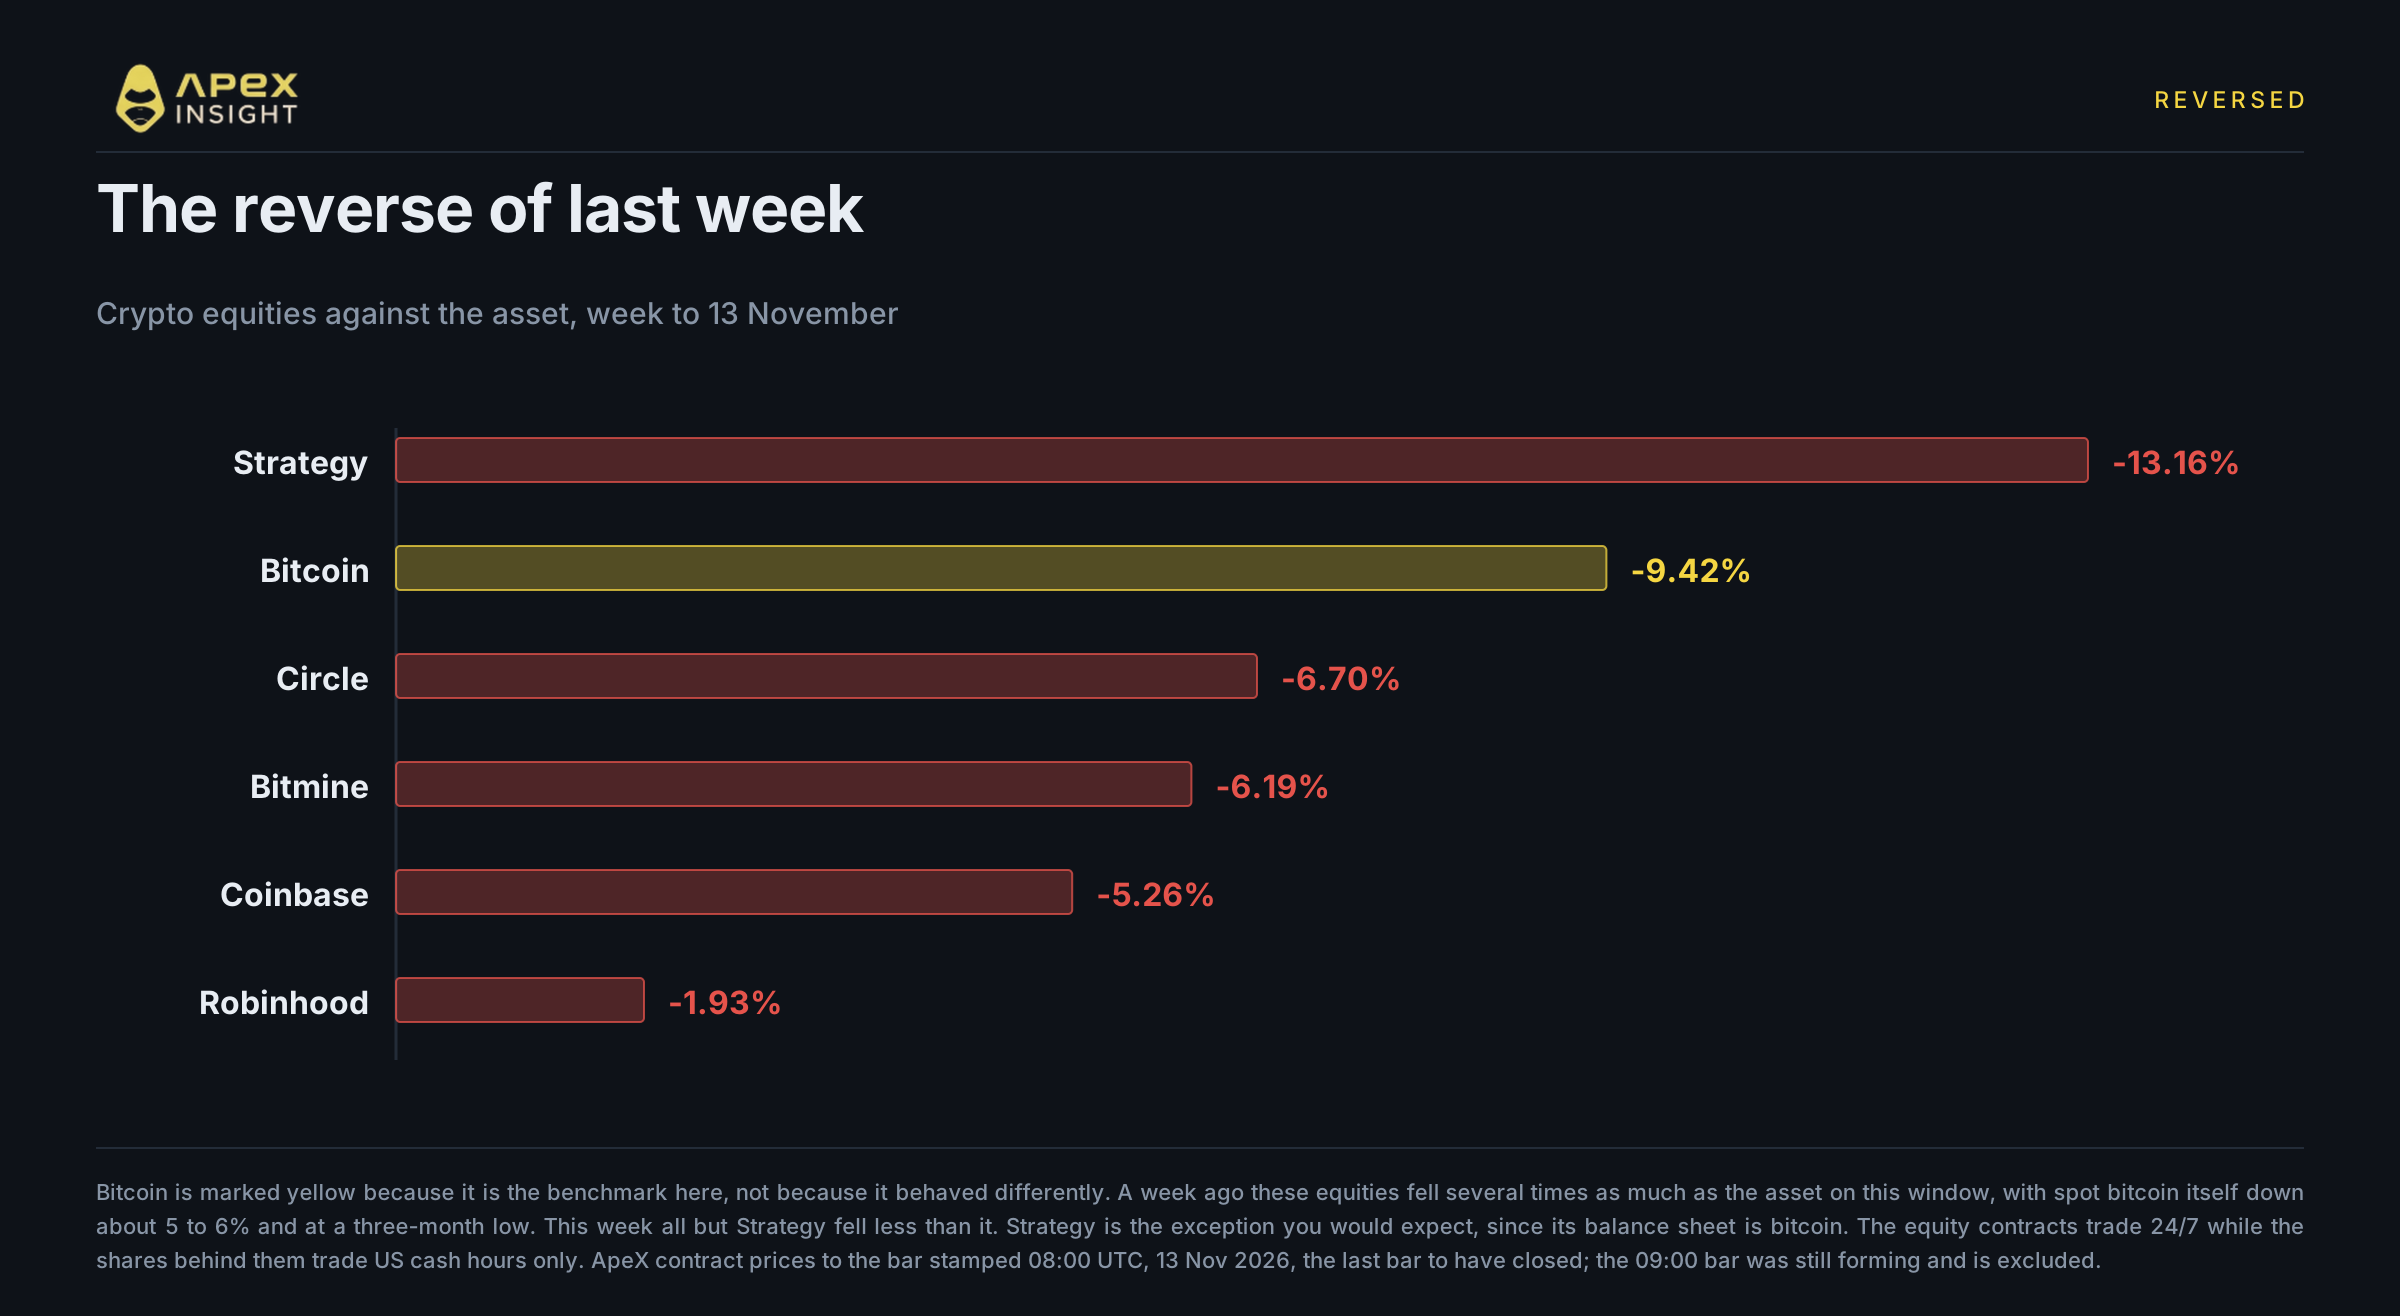
A week ago we wrote about crypto equities falling several times as much as bitcoin on our contract window. That framing needs one correction in hindsight: spot bitcoin was not flat that week, it was down around 5 to 6% and at a three-month low. The equities still fell by more. This week the relationship inverted for all but Strategy.
Contract | Week | Below 200-day high |
|---|---|---|
-13.16% | -43.29% | |
-9.42% | -21.38% | |
-6.70% | -55.36% | |
-6.19% | -39.66% | |
-5.26% | -42.85% | |
-1.93% | -37.78% |
Coinbase fell a little over half what bitcoin fell. Robinhood fell 1.93%, which is close to nothing in a week like this. Only Strategy fell more than the asset, and that is the one case where you would expect it: it is a treasury company whose balance sheet is bitcoin, so it should track the coin and then some.
The most coherent reading is that these are two different kinds of week. Last week's move was about a policy proposal that would hit the business of intermediating crypto, which is an equity problem and not a price problem. This week's move is about the dollar and forced selling, which is a price problem and only reaches the equities second-hand. The same two groups of contracts can lead and lag in consecutive weeks without either week being wrong.
One caveat on the equity rows. These are ApeX TradFi contracts, which trade 24/7, while the shares behind them trade US cash hours only. Over a window that includes two nights and a Friday morning, part of what you are seeing is the contract pricing moves the shares have not had the chance to make.
Trade the move, either way
Go long or short bitcoin, ether and the crypto equities from one cross-margin account.
Contracts grouped by the argument they belong to, not alphabetically.
The assets doing the falling. All three trade continuously, so there is no gap to wait through.
The asset against its treasury company. Strategy is the one equity here that should track the coin, which makes the pair a clean test of whether it is doing so.
The intermediaries that held up better. Both fell less than the asset this week, the reverse of the week before.
A word that matters more than usual in a week like this. Trading carries a high risk of loss, and leverage increases both gains and losses. Most of the selling described in this article was leveraged positions being closed against their owners' wishes, which is the specific risk leverage creates. Nothing here is financial advice, and none of it is a recommendation to buy or sell anything. Do your own research and size positions you can afford to lose.
If you need any help, feel free to reach out to our team on Discord.
Website: https://www.apex.exchange
Twitter: https://twitter.com/OfficialApeXdex
Telegram: https://t.me/ApeXdex
Methodology. Contract figures are our own arithmetic on ApeX Omni contract prices and are not spot prices from any other venue; the two differ, and our contract's low print of 67,512.20 sits about $43 below the lowest spot print we found that morning, $67,555 on Coinbase, and further below the $67,652 and $67,922 lows reported by CoinDesk and CoinGecko. Crypto contracts are measured on calendar-day boundaries at 23:00 UTC, because they trade continuously. The week window runs from the 6 November 23:00 UTC close to the bar stamped 08:00 UTC on 13 November. Because bars are start-stamped, that bar covers 08:00 to 09:00 and is the last one to have closed; the bar stamped 09:00 was still forming while this was written and is excluded everywhere, since a figure measured into an open bar changes on every read and cannot be reproduced afterwards. The final day of the week window is therefore partial, and is labelled as such throughout. Hourly bars are start-stamped, so the bar stamped 03:00 UTC covers 03:00 to 04:00 UTC, and the hour-by-hour table in section 2 therefore ends at the 08:00 row. The 200-day high for each equity contract uses weekday bars only, because the underlying share can only set a high while its cash market is open, and the first bar of a contract's history is excluded as a listing placeholder. WLFI's ApeX contract history begins on 28 April 2026, which is shorter than the token's own history, so figures described as lows are lows within that window and not all-time lows. The nine contracts here are a hand-picked basket and not a sample. Liquidation totals, ETF flows, dollar index levels, moving averages, CPI figures and market-implied Fed probabilities are from the sources hyperlinked at each claim and are not ApeX data. Figures are as at the 08:00 UTC bar on 13 November 2026 and will go stale quickly.