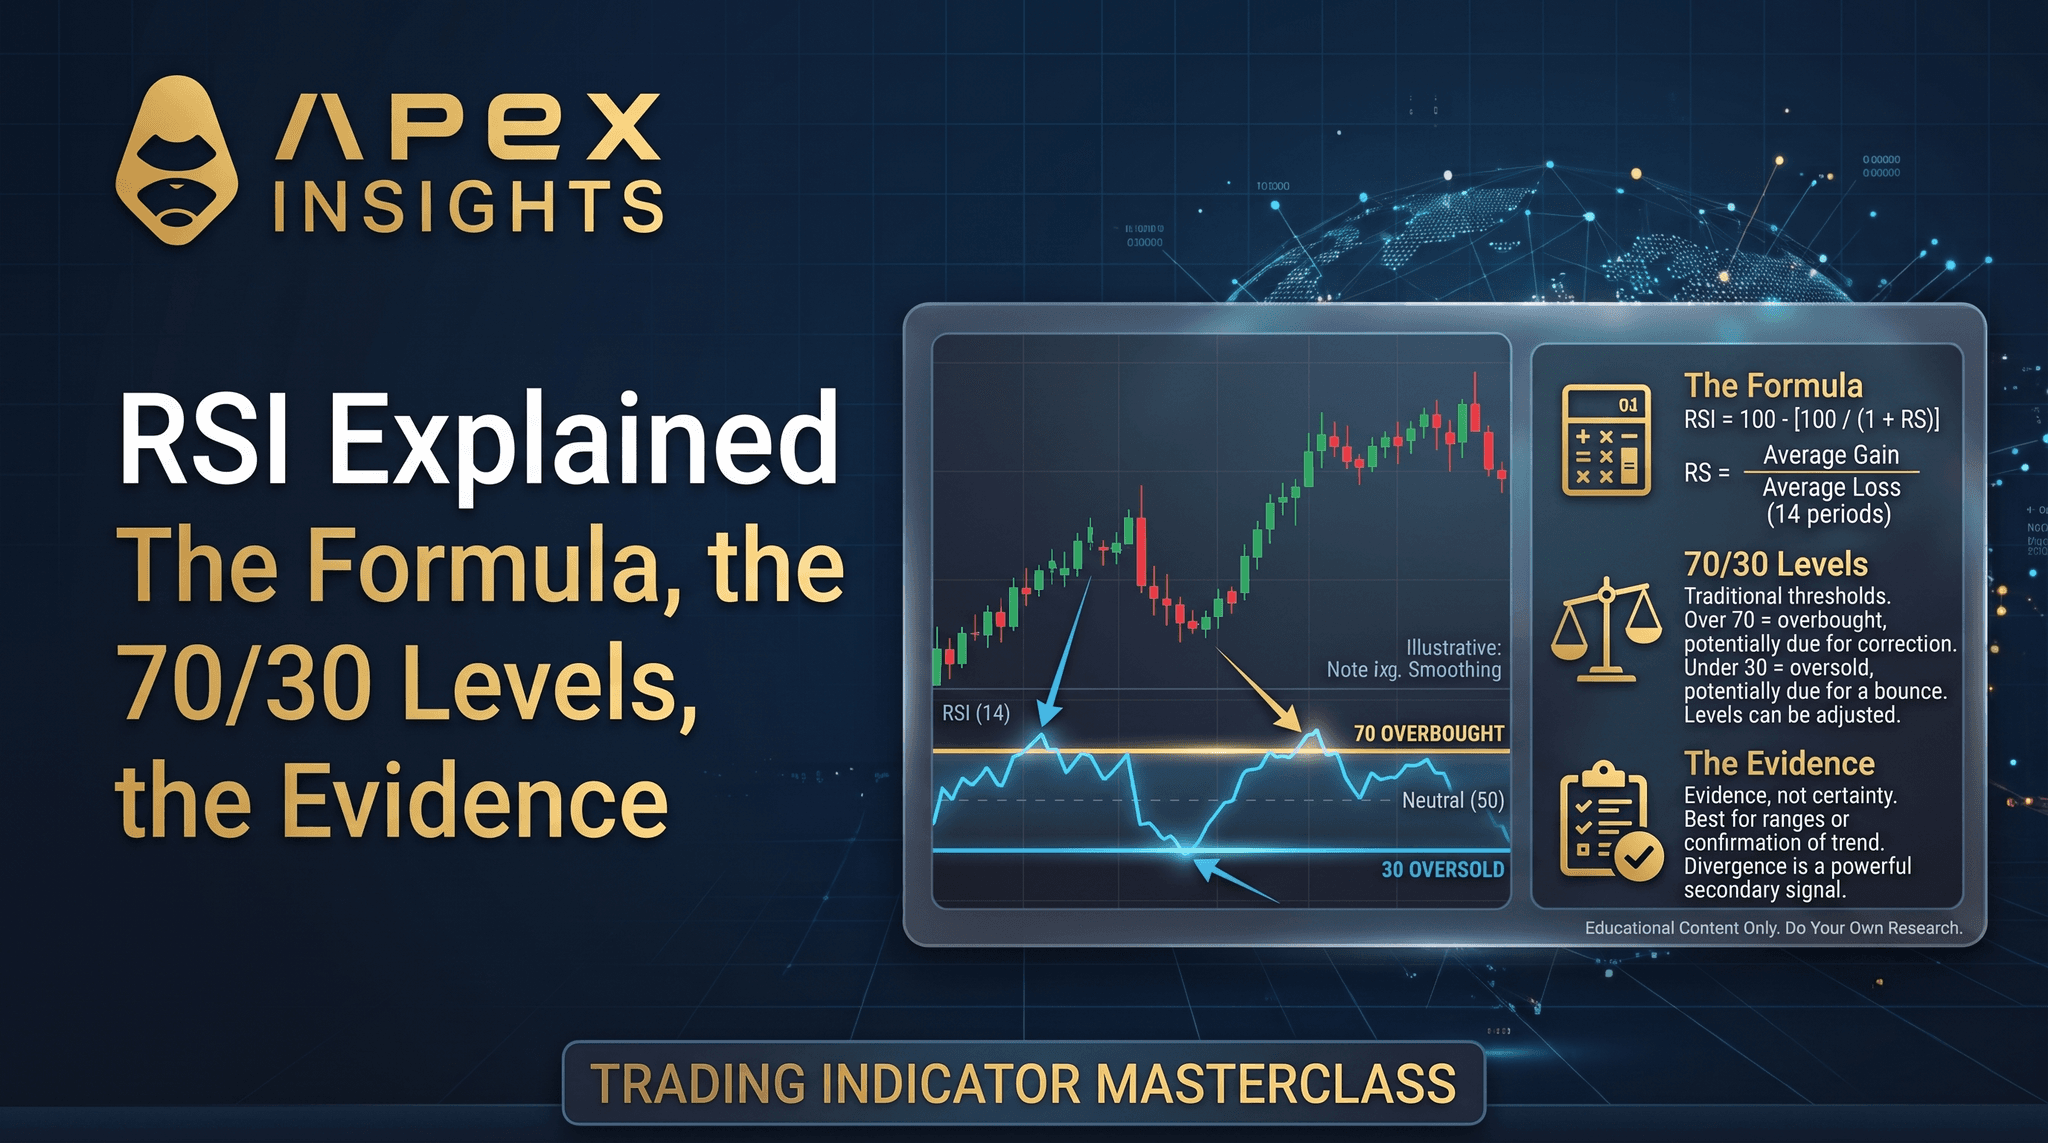
RSI Explained: The Formula, the 70/30 Levels, the Evidence
What RSI measures, why 70+ isn't a sell signal, and which RSI stats fall apart under scrutiny.


What RSI measures, why 70+ isn't a sell signal, and which RSI stats fall apart under scrutiny.

TradingView charts on ApeX Omni: 100+ indicators, 110+ drawing tools, 9 chart types, per perp.
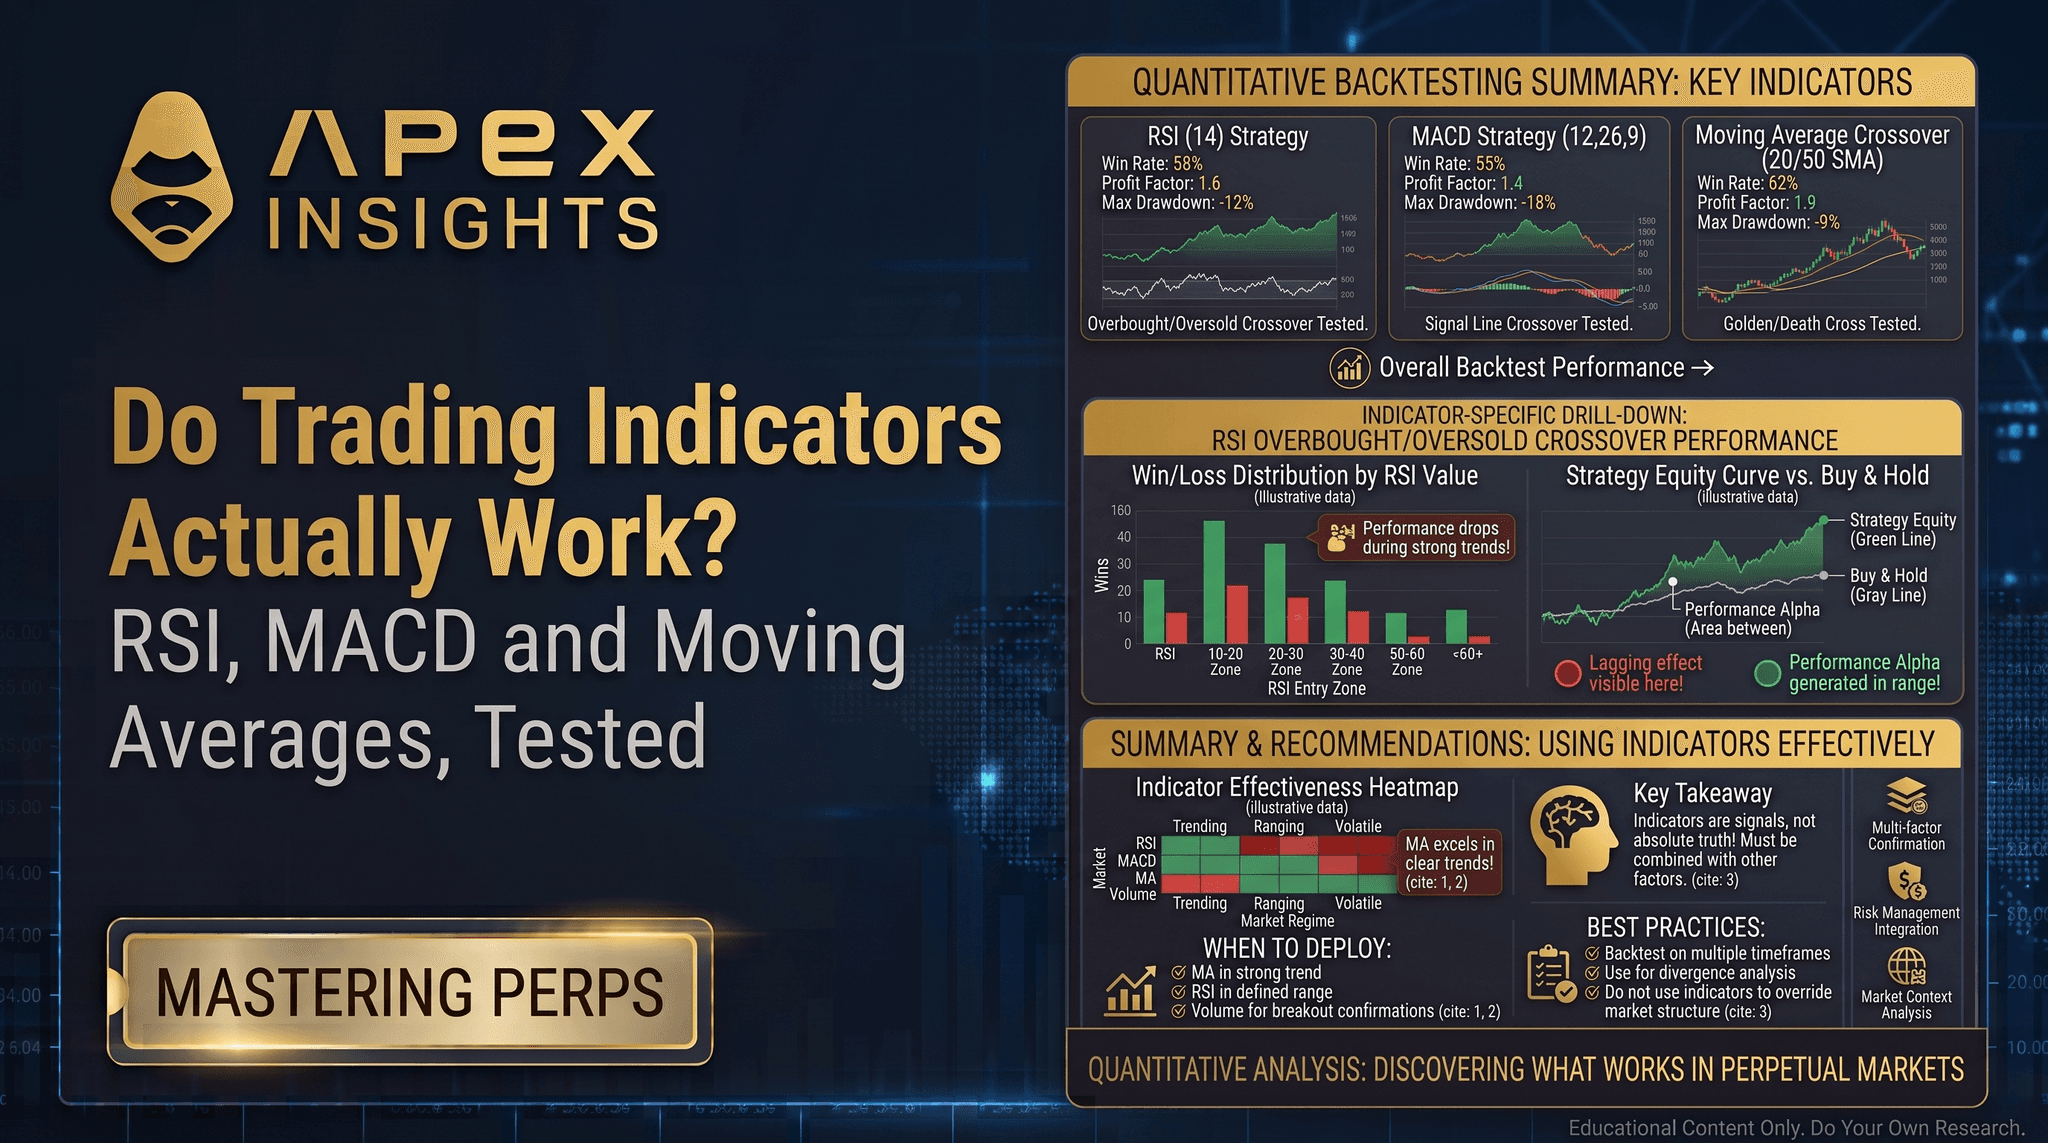
RSI, MACD & moving averages: what they measure, why they lag, and if they really work.
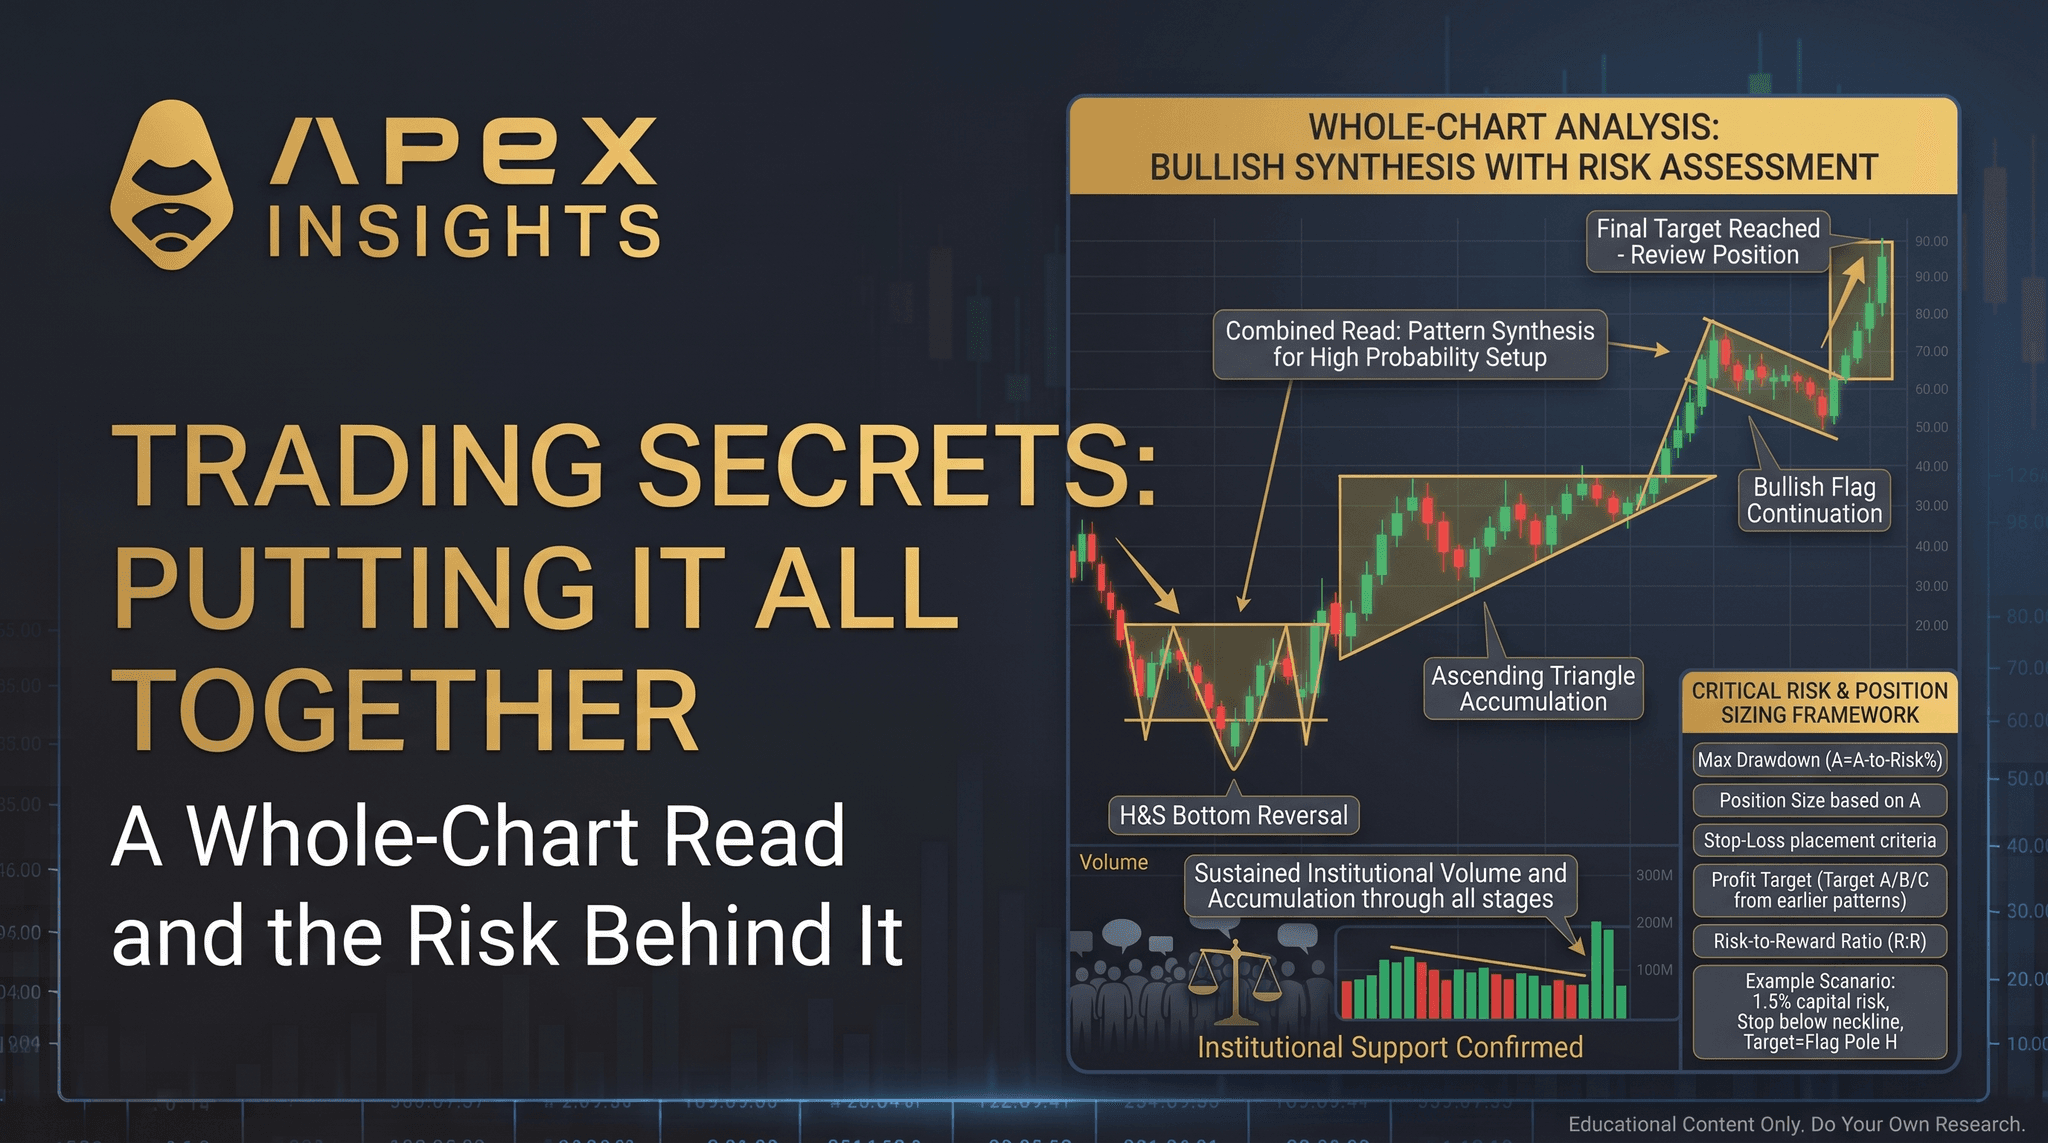
Learn how to combine trading signals into confluence and why risk management decides who survives.
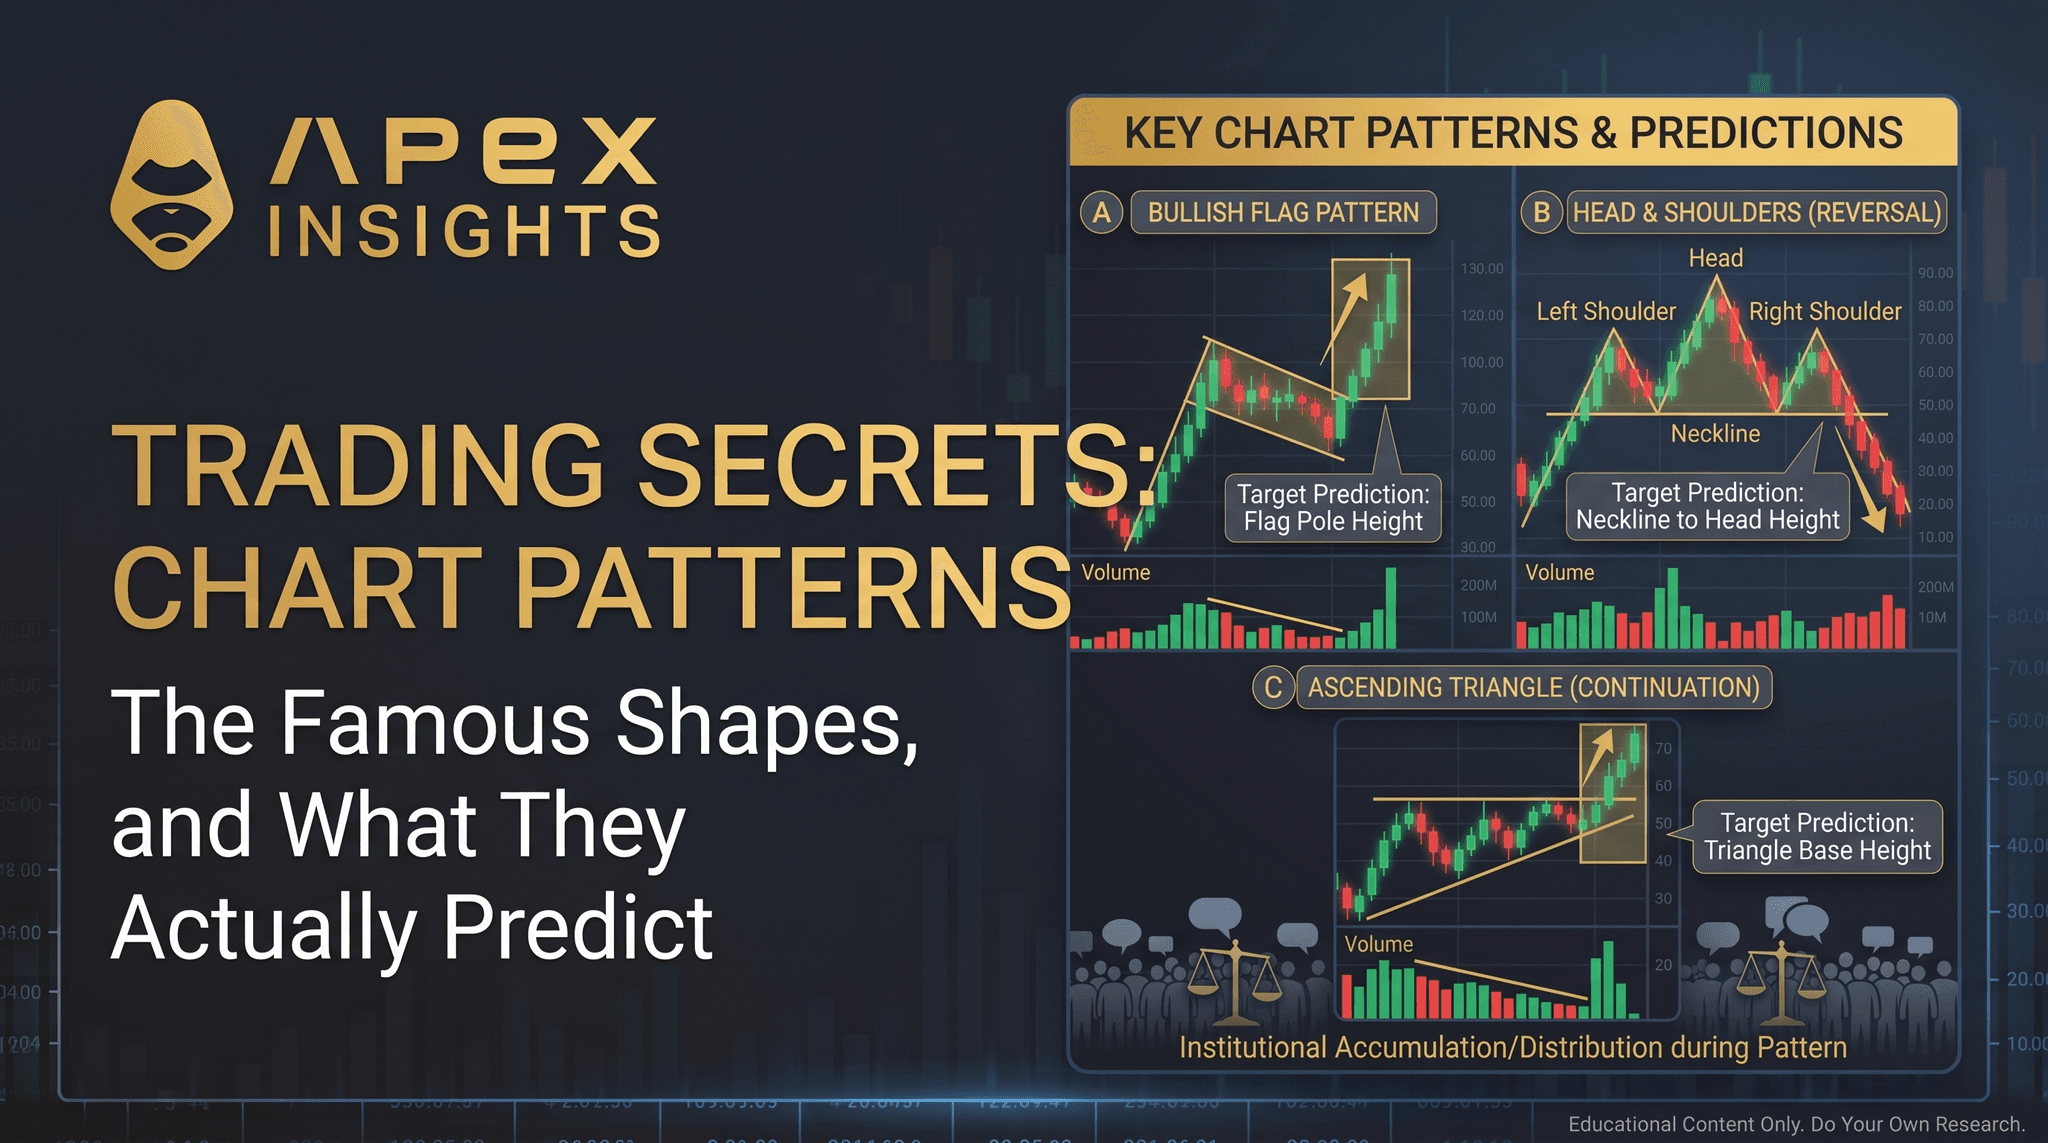
Learn what chart patterns like head-and-shoulders really do, and what tested data says they earn.
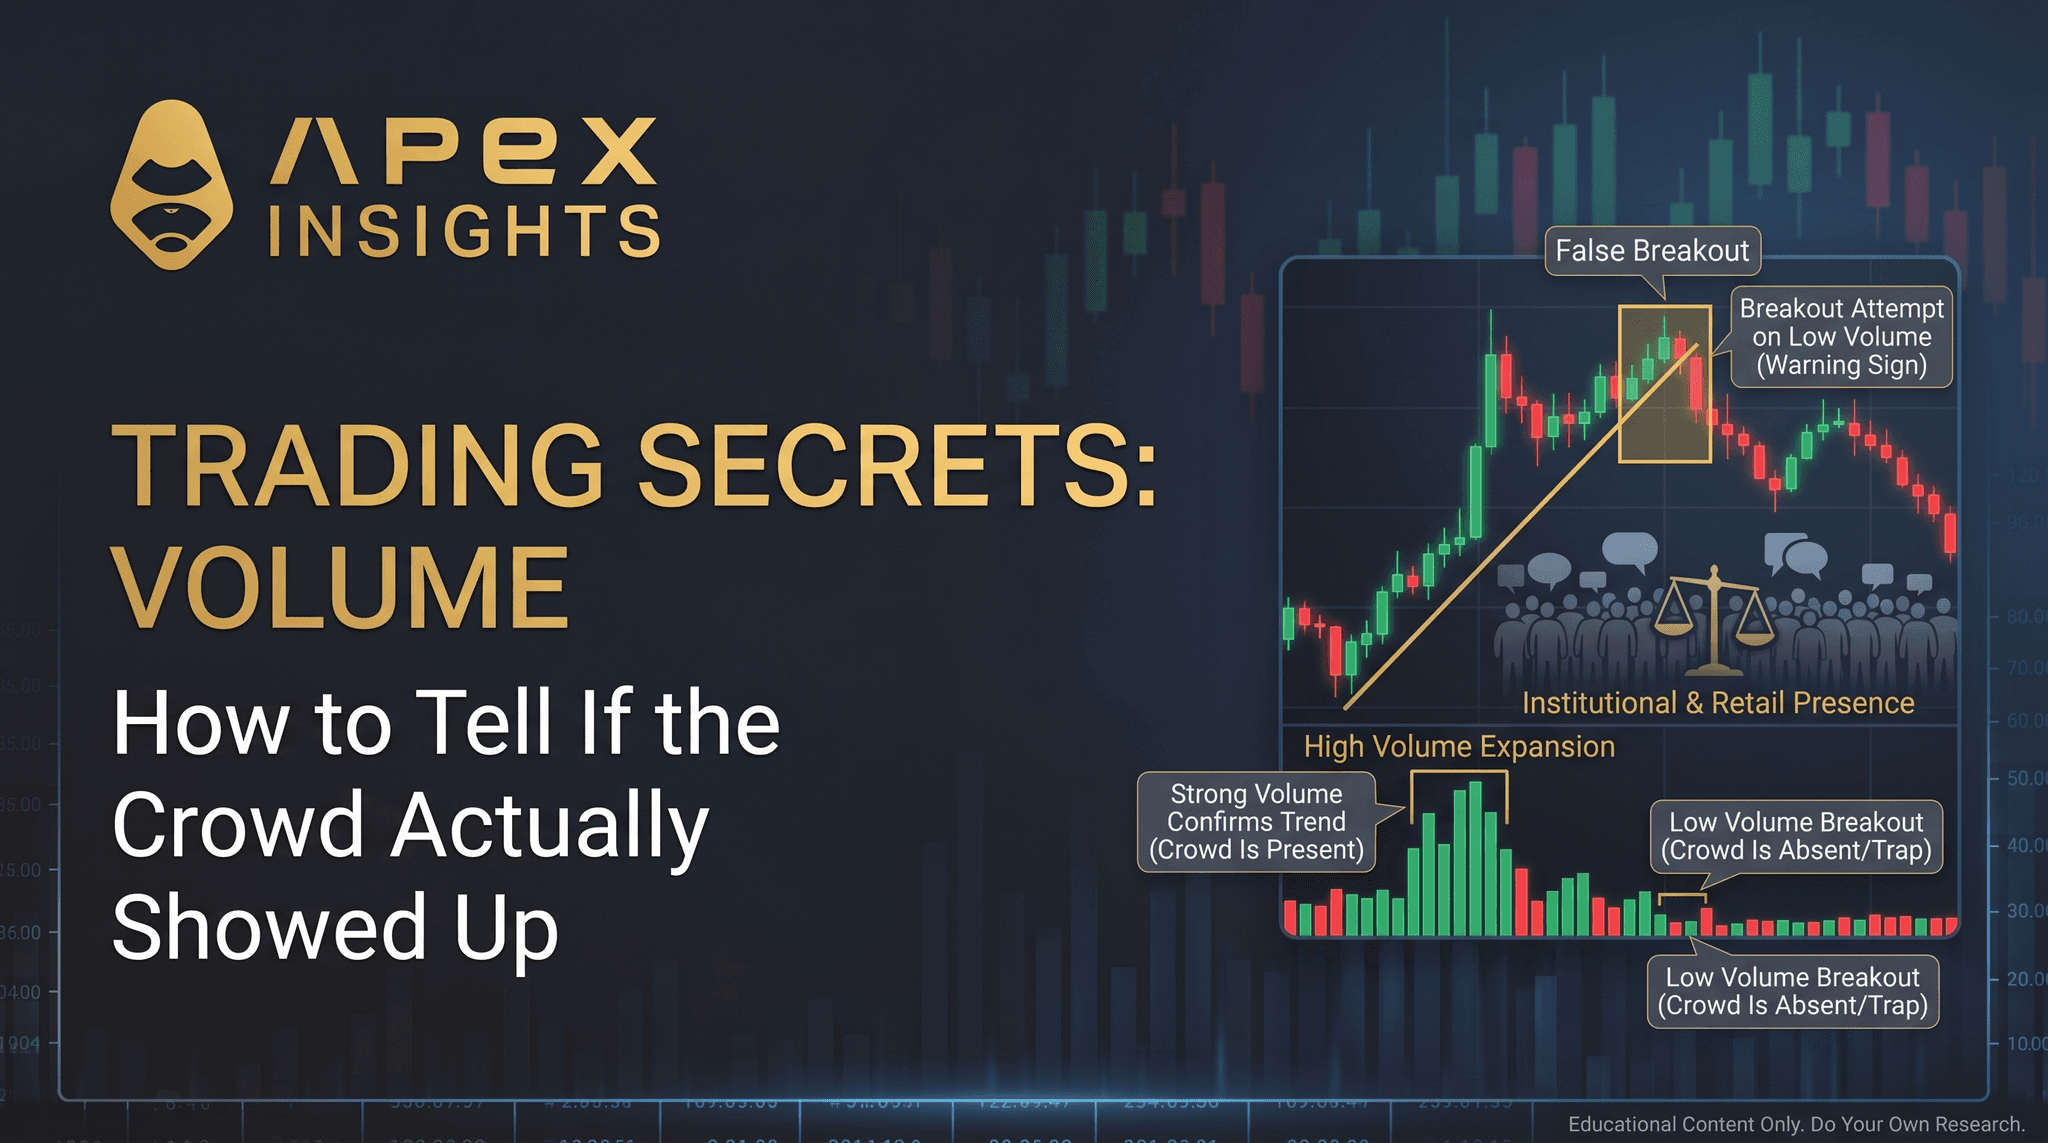
Learn what trading volume really tells you, why it tracks size not direction, and when it is fake.
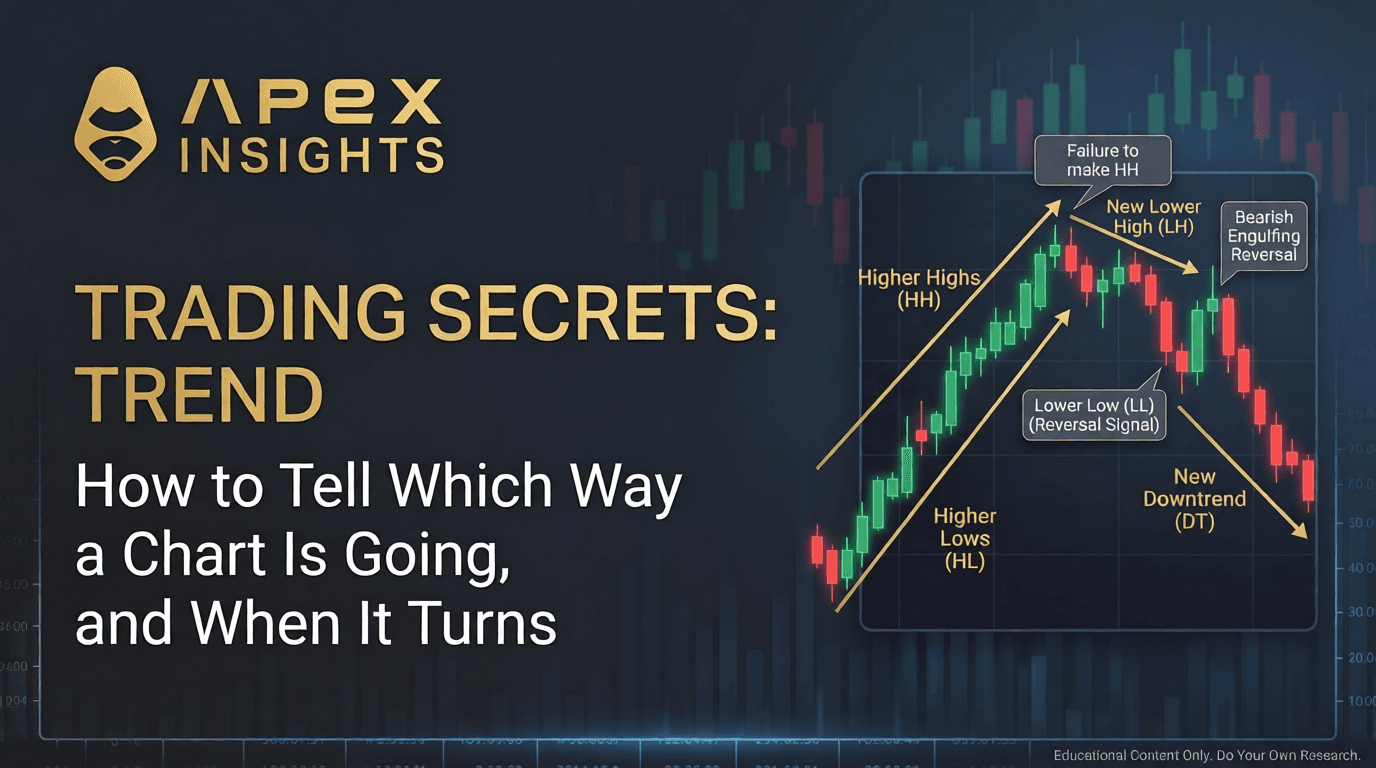
Learn how trends work, how to read higher highs and lows, and why momentum is backed by research.
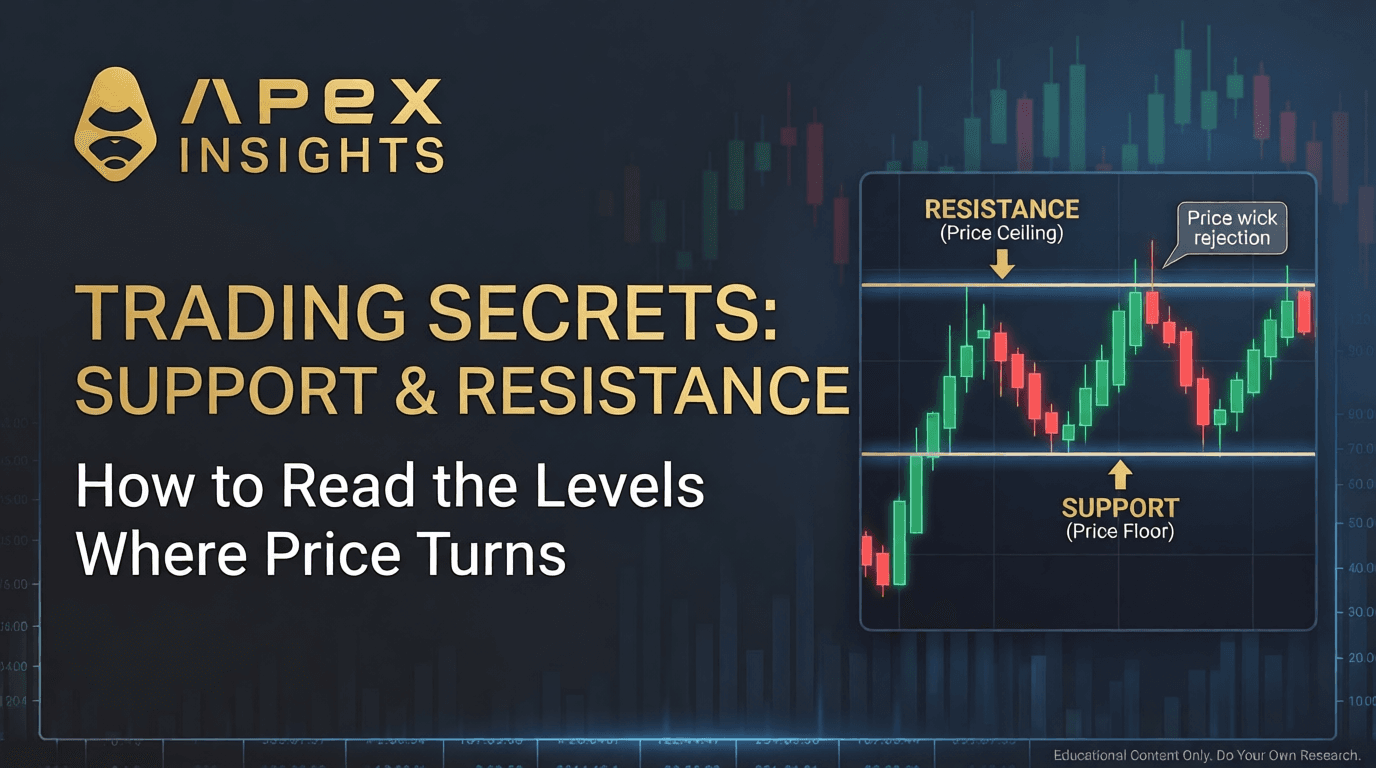
Learn how support and resistance levels work, how to spot real breaks, and what research proves.

Two and three-candle patterns ranked by tested performance: where reputation meets real evidence.