



A single candle, as we saw in the last installment, is close to a coin flip. Put two or three in a row and something changes: now you have a small story, a setup followed by a reaction, and the story is harder to fake than any one bar. This is where candlestick reading starts to earn its keep, and the tested evidence backs it up. When Thomas Bulkowski ranked all 103 candlestick types by how they actually perform, the entire top of the list is two- and three-candle patterns (Bulkowski).
That is the good news. The catch from Part 2 still applies: a famous name is not a guarantee, and some of the most-taught patterns reverse far less often than their reputation suggests. This guide walks the patterns worth knowing, two candles then three, and pairs each with what the testing actually shows. Reputation in one column, evidence in the other.
A quick reminder on the numbers below. Bulkowski's "reversal rate" is a frequency: how often price moved the expected way after the pattern, drawn from a database of millions of candle lines. It is not a win rate and not a measure of profit. A pattern can reverse often and still go almost nowhere afterward, and as you will see, several do exactly that.
Why two candles beat one
The logic is simple. A single candle shows one period's fight. A two-candle pattern shows a fight and a response: the first candle sets a tone, the second either confirms a reversal or overwhelms it. That built-in confirmation is why combinations carry more weight, and why Bulkowski's best-performing patterns are almost all multi-candle. None of the classic single candles cracks the top five.
It is worth saying what these patterns are not. They are not predictions you act on blind. Every one below still needs a prior trend to work against, and most still want confirmation from the candle that follows. The pattern improves your odds; it does not remove the need to think.
Two-candle patterns
Engulfing
The most intuitive of all. The second candle's real body completely swallows the first.
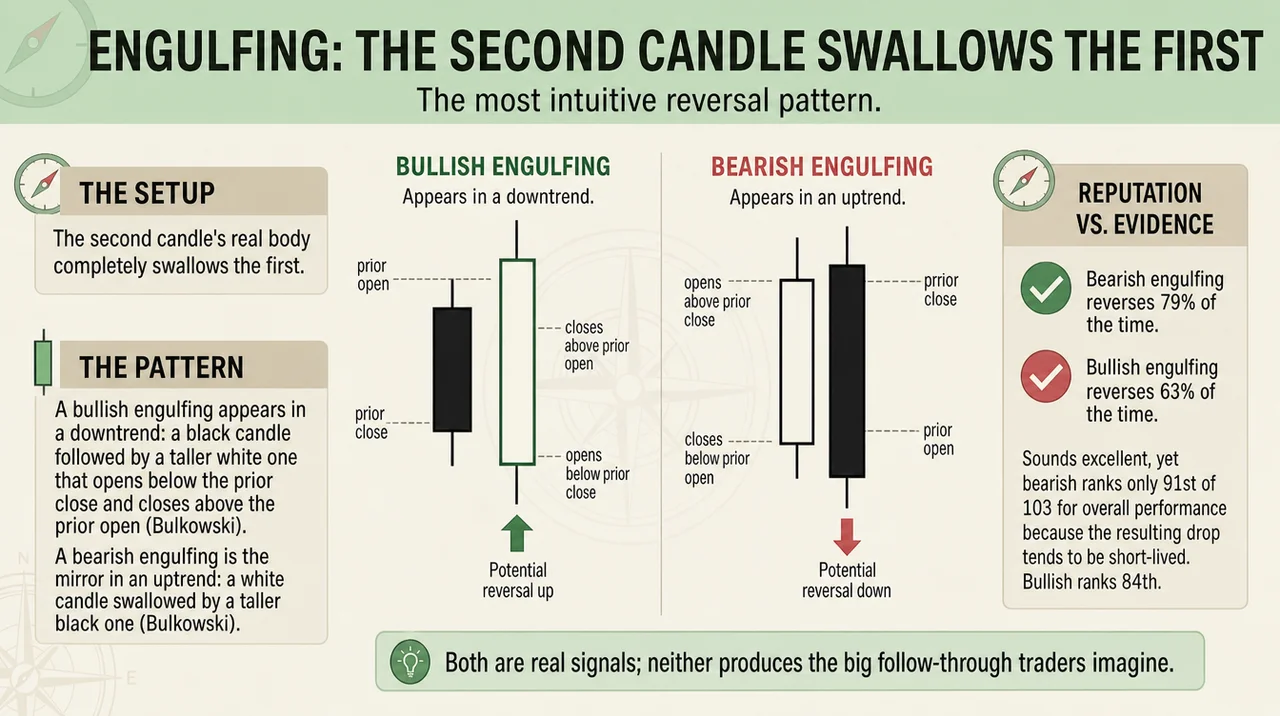
A bullish engulfing appears in a downtrend: a black candle followed by a taller white one that opens below the prior close and closes above the prior open (Bulkowski). A bearish engulfing is the mirror in an uptrend: a white candle swallowed by a taller black one (Bulkowski).
Here is the first reputation-versus-evidence lesson. Bearish engulfing reverses 79% of the time, which sounds excellent, yet it ranks only 91st of 103 for overall performance because the resulting drop tends to be short-lived. Bullish engulfing reverses a more modest 63% and ranks 84th. Both are real signals; neither produces the big follow-through traders imagine.
Harami
The harami is the engulfing pattern reversed: a large first candle, then a small second candle that sits inside the first one's body. The name comes from an old Japanese word for "pregnant," which is exactly what the shape looks like, the big candle carrying the little one.
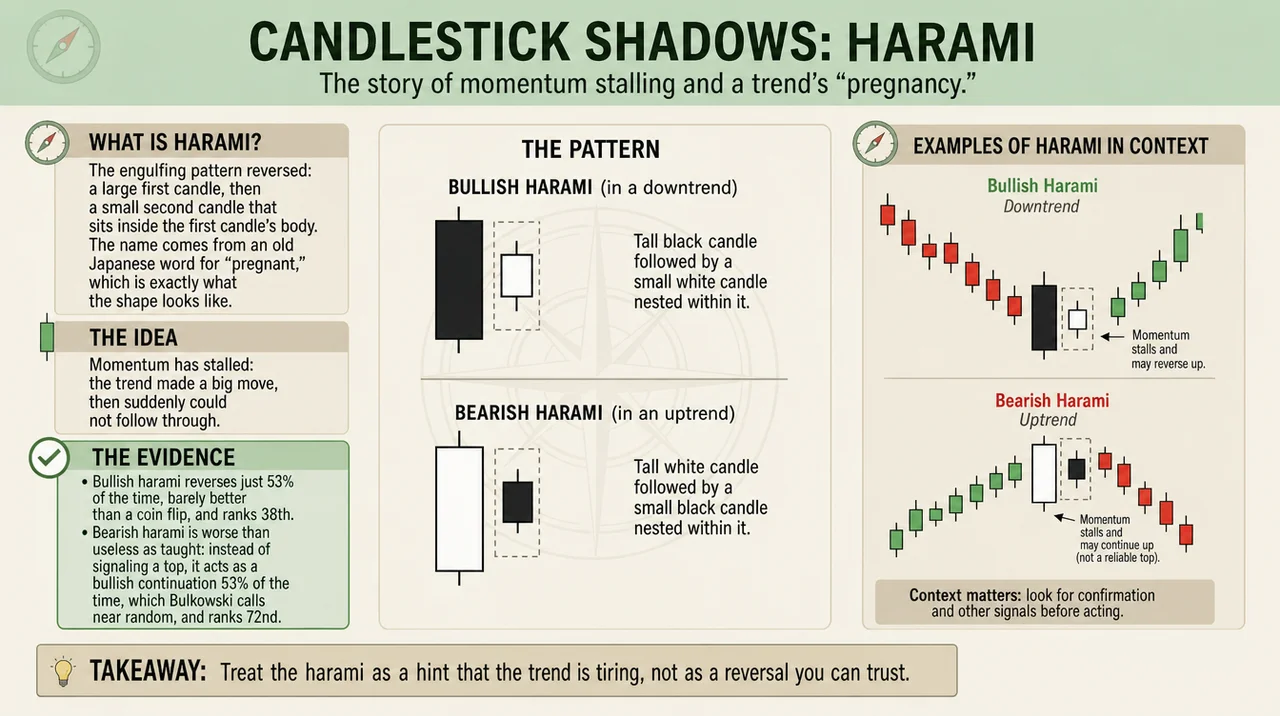
A bullish harami is a tall black candle in a downtrend followed by a small white candle nested within it (Bulkowski). A bearish harami is a tall white candle in an uptrend followed by a small black candle inside it (Bulkowski). The idea is that momentum has stalled: the trend made a big move, then suddenly could not follow through.
The evidence is sobering. The bullish harami reverses just 53% of the time, barely better than a coin flip, and ranks 38th. The bearish harami is worse than useless as taught: instead of signaling a top, it acts as a bullish continuation 53% of the time, which Bulkowski calls near random, and ranks 72nd. Treat the harami as a hint that the trend is tiring, not as a reversal you can trust.
Piercing line and dark cloud cover
These two are softer versions of engulfing, where the second candle pushes deep into the first body without fully swallowing it.
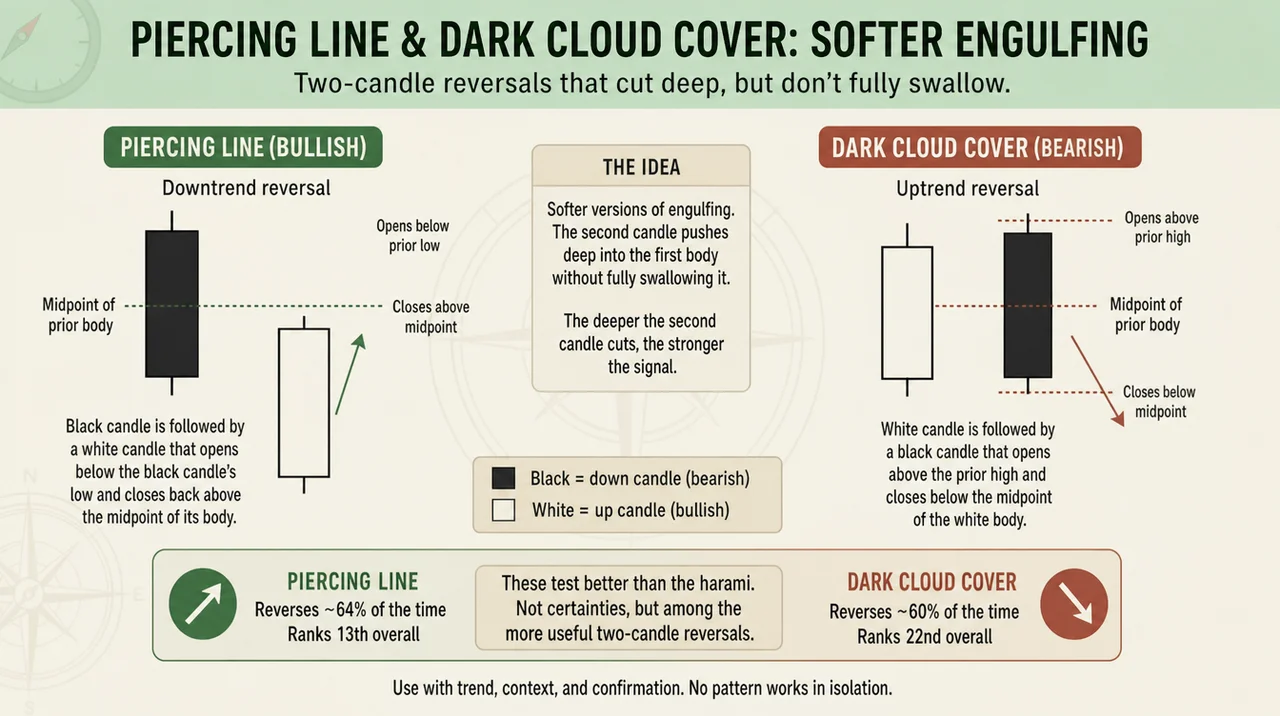
A piercing line is bullish: in a downtrend, a black candle is followed by a white candle that opens below the black candle's low and closes back above the midpoint of its body (Bulkowski). A dark cloud cover is the bearish mirror: in an uptrend, a white candle is followed by a black one that opens above the prior high and closes below the midpoint of the white body (Bulkowski). The deeper the second candle cuts, the stronger the signal.
These test better than the harami. Piercing reverses 64% of the time and ranks a respectable 13th overall; dark cloud cover reverses about 60% and ranks 22nd. Not certainties, but among the more useful two-candle reversals.
Tweezers
Two adjacent candles with a matching high (a tweezers top in an uptrend) or a matching low (a tweezers bottom in a downtrend), like the two prongs of a tweezer touching the same level (Bulkowski). The theory: price hit the same wall twice and got rejected.
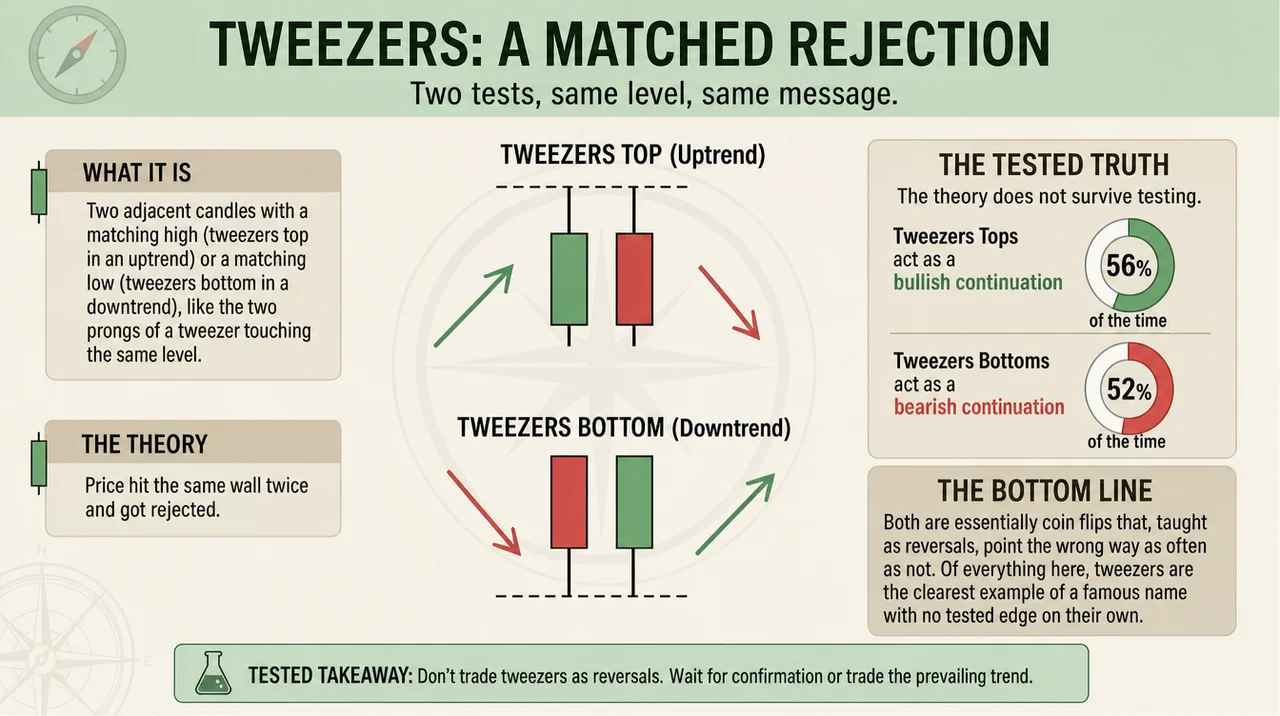
The theory does not survive testing. Tweezers tops act as a bullish continuation 56% of the time, and tweezers bottoms act as a bearish continuation 52% of the time (Bulkowski). Both are essentially coin flips that, taught as reversals, point the wrong way as often as not. Of everything here, tweezers are the clearest example of a famous name with no tested edge on their own.
Three-candle patterns
Add a third candle and you add a full act to the story: trend, pause, reversal. These are some of the best performers in the entire catalog.
Morning star and evening star
The stars are three-candle reversals built around a small middle candle (the "star") that gaps away from the trend, signaling exhaustion, before the third candle drives the other way.
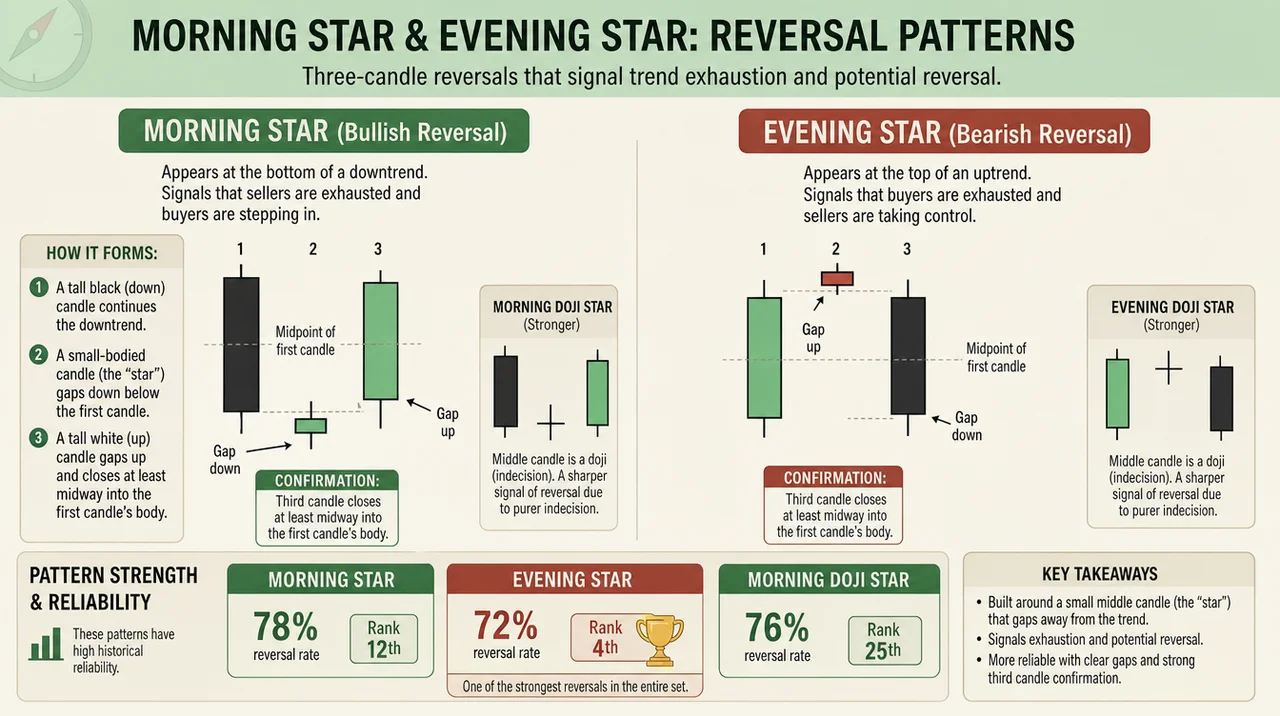
A morning star marks a bottom: in a downtrend, a tall black candle, then a small-bodied candle that gaps below it, then a tall white candle that gaps up and closes at least midway into the first candle's body (Bulkowski). An evening star marks a top, flipping the colors and direction (Bulkowski). When the middle candle is a doji, you get a morning (or evening) doji star, a slightly sharper version because the doji is purer indecision (Bulkowski).
These hold up. The morning star reverses 78% of the time (rank 12th), the evening star reverses 72% (rank 4th overall, one of the strongest reversals in the entire set), and the morning doji star reverses 76% (rank 25th). The stars are where multi-candle reading genuinely shines.
Three white soldiers and three black crows
Three long candles marching the same direction, each opening inside the previous body and closing near its extreme.
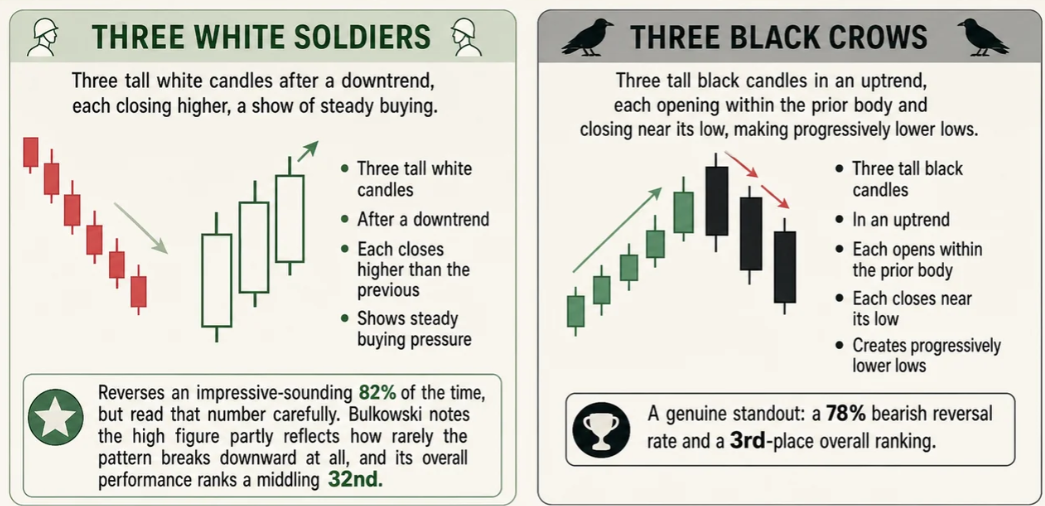
Three white soldiers is three tall white candles after a downtrend, each closing higher, a show of steady buying (Bulkowski). Three black crows is three tall black candles in an uptrend, each opening within the prior body and closing near its low, making progressively lower lows (Bulkowski).
Three black crows is a genuine standout: a 78% bearish reversal rate and a 3rd-place overall ranking. Three white soldiers reverses an impressive-sounding 82% of the time, but read that number carefully. Bulkowski notes the high figure partly reflects how rarely the pattern breaks downward at all, and its overall performance ranks a middling 32nd. Strong, but not the powerhouse the headline percentage implies.
Three line strike: the cautionary number-one
The single best-performing candlestick in Bulkowski's entire ranking is the bearish three line strike: three black candles making lower lows, then one tall white candle that opens below the prior close and closes above the first candle's open. In theory it is a bearish continuation. In testing it does the opposite, acting as a bullish reversal 84% of the time, and it ranks 1st of 103 (Bulkowski).
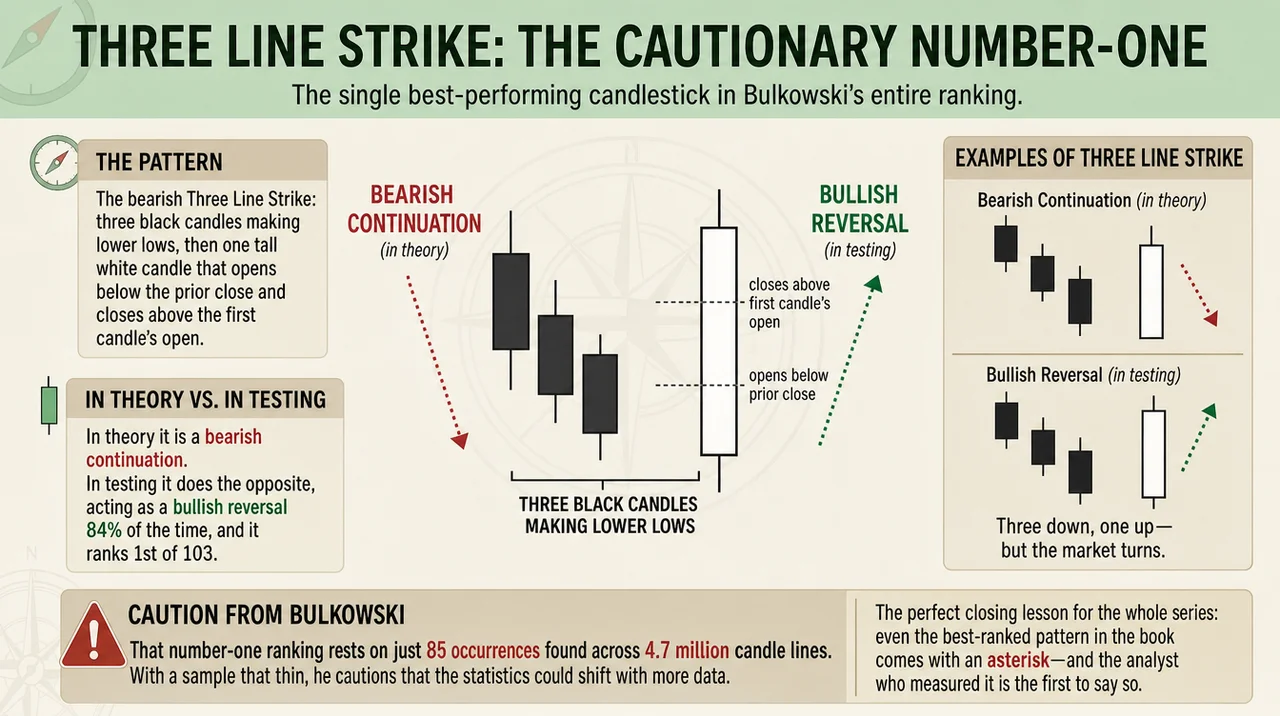
Before you build a strategy on it, read Bulkowski's own warning. That number-one ranking rests on just 85 occurrences found across 4.7 million candle lines. With a sample that thin, he cautions that the statistics could shift with more data. It is the perfect closing lesson for the whole series: even the best-ranked pattern in the book comes with an asterisk, and the analyst who measured it is the first to say so.
The patterns at a glance
Pattern | Candles | Reputation | Tested reversal rate | Overall rank (of 103) |
Three line strike (bearish) | 3+1 | Bearish continuation | 84% (acts bullish) | 1 |
Three black crows | 3 | Bearish reversal | 78% | 3 |
Evening star | 3 | Bearish reversal | 72% | 4 |
Morning star | 3 | Bullish reversal | 78% | 12 |
Piercing line | 2 | Bullish reversal | 64% | 13 |
Dark cloud cover | 2 | Bearish reversal | ~60% | 22 |
Three white soldiers | 3 | Bullish reversal | 82% | 32 |
Bullish harami | 2 | Bullish reversal | 53% (near random) | 38 |
Bearish harami | 2 | Bearish reversal | 53% (acts bullish) | 72 |
Tweezers top | 2 | Bearish reversal | 56% (acts bullish) | 81 |
Bullish engulfing | 2 | Bullish reversal | 63% | 84 |
Bearish engulfing | 2 | Bearish reversal | 79% (move is brief) | 91 |
Reputation versus evidence
Lay the table out and the lesson is unmistakable: fame and reliability are not the same thing. Bearish engulfing reverses four times out of five and still ranks near the bottom because the move evaporates. The harami and tweezers, taught in every beginner course, are coin flips that often point the wrong way. Meanwhile the three-candle stars and crows, less hyped, quietly do the work.
So how do you use any of this honestly? The same way you read a single candle, only with better raw material:
Demand a prior trend. A reversal pattern with nothing to reverse is just noise. The required trend is part of every definition above for a reason.
Mind the location. A pattern at a known support or resistance level is worth far more than the same shape in open space.
Wait for confirmation, and watch volume. The strongest setups get a follow-through candle in the expected direction, ideally on heavier volume.
Respect the sample. A reversal rate is a frequency, not a profit, and a dazzling number built on a handful of cases (hello, three line strike) deserves skepticism, not a position.
Common mistakes
Trusting the name over the numbers. "Bearish engulfing" sounds decisive; its tested follow-through is weak. Learn the rate, not just the label.
Forcing a fit. A small candle near the first body is not a harami, and a second candle that does not actually engulf is not engulfing. Loose pattern-matching manufactures signals that were never there.
Ignoring the trend. Every pattern here is defined by the trend it appears in. Strip that away and you are reading shapes, not markets.
Trading without confirmation. Even a 78% pattern fails one time in five. Position sizing and a confirming candle exist precisely for that fifth time.
Where this leaves you
So far this series has worked from the inside out: the history of the candle, then a single bar as a story of conviction and rejection, and now two and three bars as the stronger, testable patterns that actually move the odds. The throughline has held the whole way: candles are a genuinely useful lens, and the people selling you guaranteed signals are selling folklore.
The honest version is less thrilling and far more durable. A good pattern tilts the odds; it never promises the outcome, and it only earns its keep in the right place: in a real trend, at a level that matters, with confirmation. A morning star in open space is noise; the same star at support, in a downtrend running out of steam, is a setup. That context is what the rest of this series builds. Next we leave the candles themselves and turn to where they carry the most weight: support and resistance, the price levels where the market keeps showing its hand.
Explore more from this series: Part 1 | Part 2 | Part 3
This article is for educational and informational purposes only and is not financial, investment, or legal advice. Do your own research and consult a licensed professional before investing.